March 4th, 2024
What Is Statistical Analysis? Your In-Depth Guide
By Zach Fickenworth · 12 min read
In one corner you have raw data, heaps of numbers, and figures that – at first glance – appear to be mere noise. In the other corner you have meaningful insight, the kind of understanding that drives decisions, sparks innovation, and reveals hidden truths.
And the bridge between these two realms? Statistical analysis.
Defining Statistical Analysis
Statistical analysis refers to the process of collecting and analyzing data with a specific purpose in mind. The purpose might be to understand relationships, identify trends and patterns, test hypotheses, or predict future trends. Achieving all these purposes is made possible by removing bias from the data, which leaves you with a more accurate and reliable foundation for making informed decisions.
These informed decisions are made across various fields. Statistical analytics is widely used in fields like business, finance, healthcare, and social sciences. And it’s not solely used for decision-making. Statistical analysis is also fundamental to scientific research, business intelligence, and quality control.

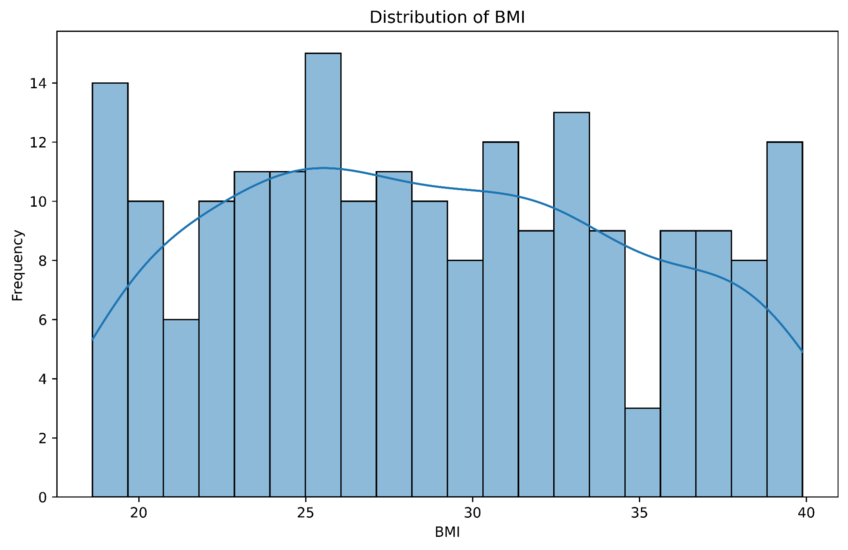
Example histogram showing the distribution of Body Mass Index (BMI) values in a dataset. Created in seconds with Julius AI
Types of Statistical Analysis
A data set can be manipulated and analyzed in various ways, depending on the nature of the data and the research questions. That’s why it shouldn’t be surprising that there’s also more than one type of statistical analysis.
Two of these types are considered the main statistical methods – descriptive statistics and inferential statistics. However, the remaining four statistical methods are no less important, so let’s do a quick overview of each.
Descriptive Analysis
As the name suggests, descriptive statistics only exists to describe the data, i.e., provide simple summaries of the data set. In other words, analyzing data this way will lead to no conclusions about the content of the data set. It simply makes complex data sets easier to read and understand.
Since “simplicity” is the key word here, the data is most commonly presented in visual form – charts, graphs, and tables – as this allows the reader to grasp the main characteristics of the data set at a glance.
Inferential Analysis
Inferential statistics goes a step further than descriptive analysis. Sure, it also summarizes the data, but it primarily focuses on drawing conclusions – or making inferences – based on the data points.
So, thanks to inferential analysis, all you need is a representative sample of the population to make an educated guess about the whole population. Of course, there’s always a level of uncertainty in such guesses, so keep in mind that the conclusions drawn using inferential statistics are based on probabilities; they aren’t absolute truths.

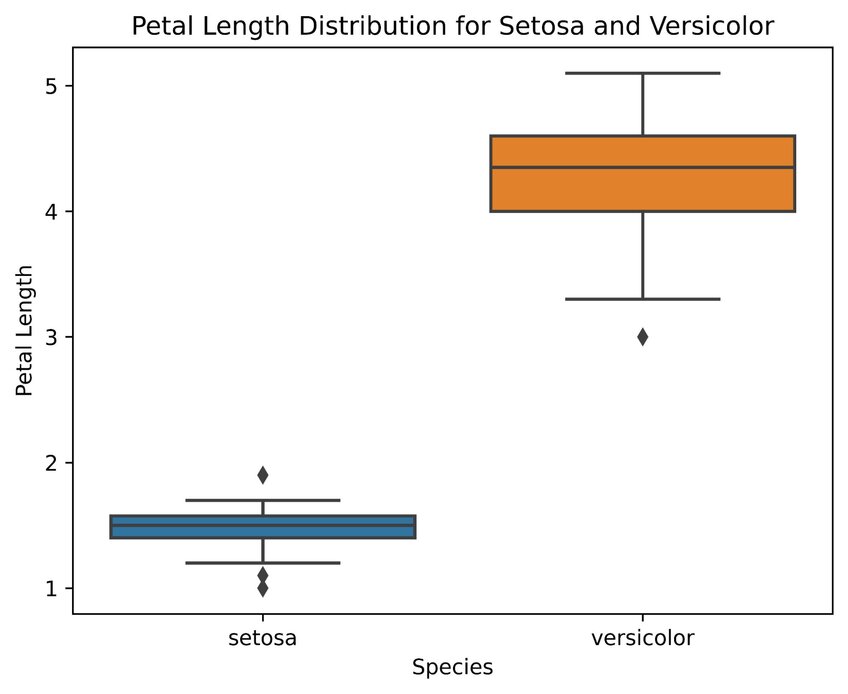
Inferential analysis example to determine if there is a significant difference in the mean petal length between the species setosa and versicolor. The p-value is less than the significance level of 0.05, so—in this example—the null hypothesis is rejected and there is a significant difference. Created in seconds with Julius AI
Predictive Analysis
With predictive analysis, statistical analysts rely on artificial intelligence, machine learning algorithms, data modeling, and data mining to identify the likelihood of future outcomes based on historical data. This type of statistical analysis is widely used in any field where forecasting future trends is valuable, such as marketing and finance.
Prescriptive Analysis
Prescriptive analysis is to predictive analysis what descriptive analysis is to inferential analysis. This type of statistical analysis involves making specific, actionable recommendations based on forecasts received via predictive analysis. In other words, you can use prescriptive analysis to find out how to best achieve a desired outcome.
Exploratory Data Analysis
Exploratory data analysis also deals with statistical inference, i.e., drawing conclusions from the data. But unlike inferential analysis, this type tackles unknown data associations. The result? You get to analyze potential instead of existing relationships within the data and formulate hypotheses for further investigation.
Causal Analysis
With causal analysis, you can determine the causal relationship between variables. In simpler terms, this analysis uncovers why certain events or outcomes occur and how they affect the other variables. This type of statistical analysis is often considered the most challenging statistical model, as establishing a clear temporal relationship between cause and effect is no easy task.
Why Is Statistical Analysis Important?
As previously mentioned, statistical analysis bridges the gap between the chaotic world of raw data and the structured realm of meaningful insights. It provides a framework for organizing, analyzing, and interpreting data in an uncomplicated manner, without which researchers, businesses, and policy-makers would struggle to make informed decisions. Without statistical analysis, most of these decisions would be made based on intuition and guesswork instead of hard data and evidence.
That’s why you’ll see statistical analysis virtually everywhere. In healthcare research. Market analysis. Social sciences. Financial analysis. Educational research. Public policy. Any field that relies on data-driven decision-making can’t make it without statistical analysis.
What Is the Process for Statistical Analysis?
The exact process for statistical analysis depends on the model you use to analyze data. However, a comprehensive statistical analysis should generally follow a few key steps:
1. Data collection: Gathering the relevant data for the analysis
2. Data organization: “Cleaning” the data by removing duplicates, inaccuracies, and inconsistencies
3. Data presentation: Arranging the data for easy analysis
4. Data analysis: Looking into the data using a specific technique
5. Data interpretation: Explaining the findings
Software for Statistical Analysis
Though this guide might make it appear simple, statistical analysis is no simple task. That’s why there are numerous statistical analysis software tools available. These statistical software tools range from user-friendly options that can instantly transform a beginner into a math expert to advanced tools that cater to the needs of experienced statistical analysts.
The first category has caused nothing short of a revolution in the world of statistical analysis, as it has eliminated virtually all entry barriers for individuals and organizations looking to analyze data. Use tools like Julius AI, and it won’t matter if you’re a student who’s just starting to learn about statistical models. Each and every one of these models will be available to you in a few clicks.
Upgrade Your Statistical Analysis with Julius AI
Think of Julius AI as your personal AI-powered data science assistant that can help you crush your statistical analysis.
The tool works similarly to ChatGPT. All you need to do is insert a few prompts – and your data set – and voilà! You’ll receive detailed statistical analyses, visualizations, and insights, all tailored to your specific needs.
Frequently Asked Questions (FAQs)
What is meant by statistical analysis?
Statistical analysis is the bridge that transforms raw data into meaningful insights. It involves collecting, organizing, interpreting, and presenting data to uncover patterns, relationships, and trends. By applying statistical methods, you can draw conclusions from data, make predictions, and support informed decision-making across various fields like business, healthcare, and social sciences.
What is an example of statistical analysis?
A common example of statistical analysis includes a company collecting survey data from 1,000 customers, using descriptive statistics to summarize the average satisfaction score, and then using inferential statistics to predict overall customer satisfaction trends. This analysis helps the company identify areas for improvement and make data-driven decisions.
