
A moderating variable (also called a moderator variable) changes the strength or direction of the relationship between two other variables. It answers a different question from "does X affect Y?": namely when, for whom, and under what conditions.
Here's the everyday version. Exercise tends to lift your mood, but it lifts it a lot more for people with strong social support than for people going through it alone. Same action, very different payoff, depending on a third variable. That third variable is the moderator.
By the end of this guide you'll be able to spot a moderator in your own data, write the hypothesis for it, test it with an interaction term, and run the whole thing (with or without writing code).
What is a moderating variable?
A moderating variable is a third variable that changes how a predictor and an outcome relate. Statisticians usually label the predictor X, the outcome Y, and the moderator W. The moderator can make the X–Y link stronger, weaker, flat, or even flip its direction.
Think of it as a dial. As W goes up or down, the slope between X and Y moves with it.
Picture the relationship as an arrow running from X to Y. A moderator sits off to the side of that arrow and points at it, bending how steep it is.
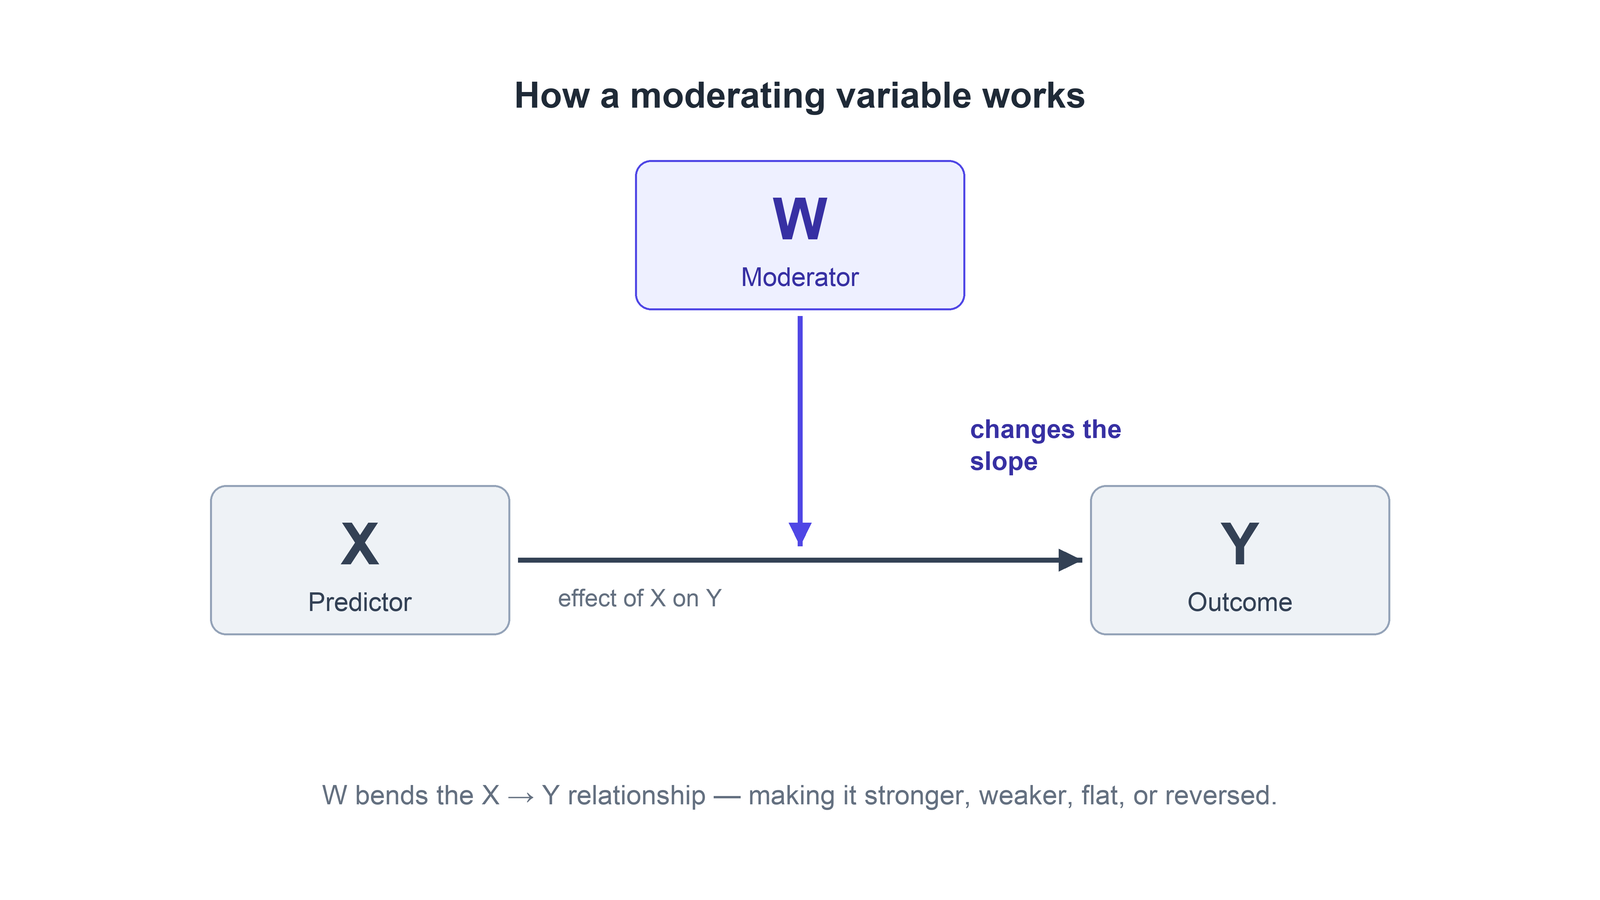
That's the part people miss when they first meet the concept. A moderator's whole job is to set the conditions under which the main relationship holds. In plain terms, it changes the strength or direction of a correlation that's already there.
So the effect of X is conditional on W. "Study time improves exam scores" becomes "study time improves exam scores more for students with little prior knowledge." The second version names a condition, and that condition is the moderator.
7 everyday examples of moderating variables
The fastest way to lock this in is to read a handful of examples and watch the same pattern repeat. In each one, the moderator changes who the effect shows up for and how strong it is, without being the cause of the outcome itself.
| 🎯 Field | ➡️ Predictor (X) | 🏁 Outcome (Y) | 🔀 Moderator (W) |
| Education | Study time | Exam performance | Prior knowledge |
| Psychology | Stress | Anxiety or low wellbeing | Social support |
| Fitness | Training intensity | Muscle gain | Age |
| Healthcare | Medication dosage | Treatment response | Body weight |
| Marketing | Ad exposure | Purchase intention | Brand familiarity |
| Workplace | Training | Employee performance | Motivation |
| Workplace | Workload | Job satisfaction | Organizational support |
Take the stress example, since it's the classic one. Stress usually drags wellbeing down, but social support softens the blow. For someone with a strong support network, high stress barely moves the needle. For someone isolated, the same stress hits hard. Support is the moderator (this is the "buffering" pattern you'll see named in a lot of psychology papers).
One honest caveat: these are illustrative hypotheses, not settled facts. Each one would still need theory to justify it and a real test to confirm it. They're here to train your eye for the pattern.
Moderator variable vs. mediator variable (and how both differ from confounders and control variables)
This is where most people get tangled, so let's settle it. A mediator explains how or why X affects Y. A moderator tells you when or for whom.
A mediator sits on the causal path: X causes M, and M causes Y. A moderator sits off to the side, changing the slope through an interaction. The quickest tell is a single question: can X cause this variable? If yes, you're probably looking at a mediator. If no, it's probably a moderator.
| ❓ Question | 🧩 Mediator variable | 🎚️ Moderator variable |
| What does it answer? | How or why does X affect Y? | When or for whom does X affect Y? |
| Relationship to X | Must be caused by X | Must not be caused by X |
| Position in the model | On the path: X → M → Y | On the side: X × W → Y |
| How you test it | Indirect effect (bootstrapping) | Interaction term in regression |
| If you remove it | The X→Y link weakens or disappears | The X→Y link stays, but varies by W |
This moderator–mediator split traces back to a 1986 paper by Baron and Kenny that still anchors how researchers talk about it today (Journal of Personality and Social Psychology). If you want the mediation side in depth, we cover it in Baron and Kenny's procedures for mediational hypotheses.
Two more variables get confused with moderators, so it's worth a quick line on each:
- Confounder: a variable linked to both X and Y that biases your estimate. It threatens the validity of your result, so you adjust for it to get a cleaner number.
- Control variable: something you include in the model to rule out alternative explanations or tighten precision. You're not interested in it for its own sake.
- Intervening variable: just another name for a mediator.
The twist that trips people up: the same measured variable can be a moderator in one study and a mediator in another. Age might moderate a treatment effect in one design and confound it in another. The label depends on the question you're asking and where the variable sits in your model, not on the variable itself.
How to test for moderation (the interaction term)
You test for moderation by adding an interaction term to a regression and checking whether it's significant. The model looks like this:
Y = b0 + b1·X + b2·W + b3·(X × W) + e
The coefficient to focus on is b3, which sits on the X-by-W product. If b3 is statistically significant (usually p < 0.05, or a 95% confidence interval that excludes zero), the moderator is changing the X–Y relationship. The conditional effect of X at any given value of W is b1 + b3·W, which is the formula you lean on when you interpret results.
The workflow I'd follow is below, and the probing in step 5 is where I've watched people stall far more often than the regression itself:
- Center your continuous variables: subtract the mean from X and W. Centering makes the lower-order coefficients easier to read and can ease multicollinearity. It's helpful, though it isn't required to test the interaction.
- Build the product term: multiply centered X by centered W to create X × W.
- Run the regression: enter X, W, and X × W together. Keep X and W in the model even if they look weak.
- Check b3: look at its coefficient, confidence interval, and p-value, plus the bump in explained variance.
- Probe with simple slopes: estimate the effect of X at low (one standard deviation below the mean), average, and high (one standard deviation above) values of W.
- Plot it: put X on the horizontal axis, the predicted outcome on the vertical, and draw one line per moderator level. Non-parallel lines are the visual signature of moderation.
A quick illustrative read: suppose social support moderates the stress–satisfaction link and the interaction comes back at b = 0.18, 95% CI [0.07, 0.29]. Because it's positive, the negative effect of stress on satisfaction gets weaker as support rises. (Those are made-up numbers for the walkthrough, not a finding.)
One caution the tidy blog posts skip: a significant interaction shows a conditional association under your model. With observational or cross-sectional data, it isn't proof of a causal moderating process. If you want the mechanics of the underlying model, our guide to regression analysis goes deeper.
Types of moderating variables: categorical vs. continuous
Before you code anything, ask one question: is your moderator a group label or a number? The answer changes how you set up the test.
Categorical moderators
A categorical moderator splits your data into groups, like gender, treatment condition, or region. You code it with an indicator (say, 0 for the comparison group and 1 for the focal group). Then the slope of X is b1 in the reference group and b1 + b3 in the focal group, so b3 is the gap between the two slopes. A moderator with more than two categories needs k−1 indicators, each with its own interaction term.
Continuous moderators
A continuous moderator is a number, like age, income, or a motivation score. Here b3 tells you how much the X slope shifts for every one-unit rise in the moderator. Because one unit isn't always meaningful, it's common to report the effect of X at a few substantively useful values rather than every point on the scale.
How to write a moderation hypothesis and map a conceptual framework
A clean moderation hypothesis names four things: the predictor, the outcome, the moderator, and the expected pattern. A reliable template:
The relationship between [X] and [Y] is moderated by [W], such that the relationship is stronger (or weaker, or more negative) when [W] is high than when it's low.
Filled in: "The relationship between study time and exam performance is moderated by prior knowledge, such that study time helps more for students with lower prior knowledge." If your theory doesn't predict a direction, a non-directional version is fine, as long as you can say why you expect moderation at all.
Mapping it into a conceptual framework is mostly about where the arrow lands. X and Y sit on a horizontal path. The moderator gets its own arrow pointing at the middle of that path, not at X or Y on their own. That placement is what visually separates a moderator from a plain predictor or a mediator.
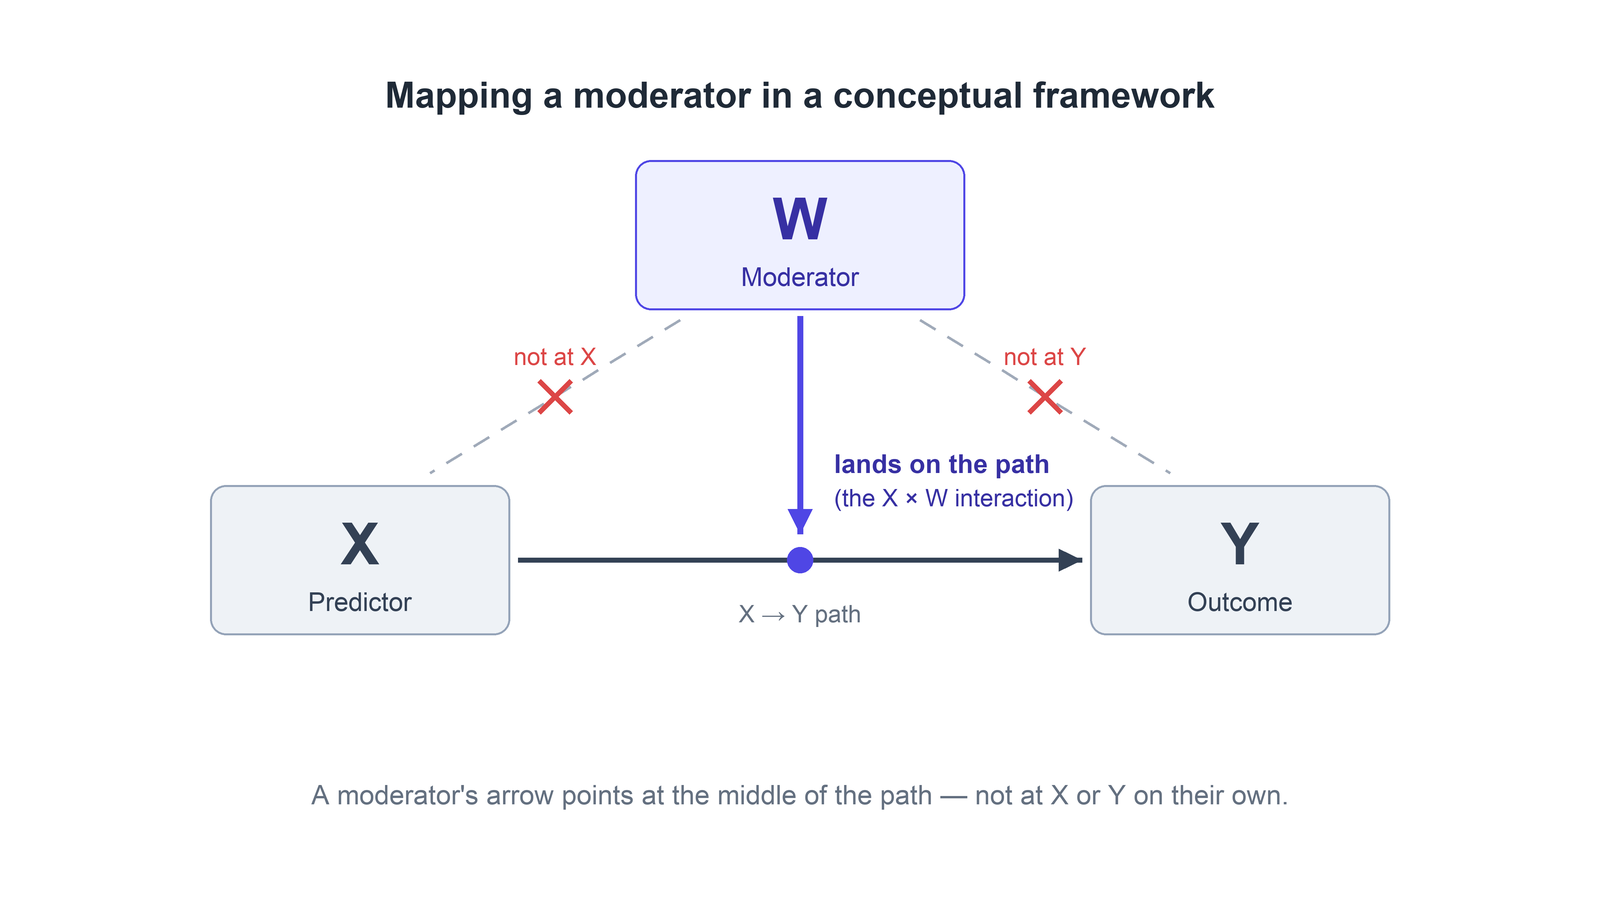
If your framework starts stacking several linked paths, you're drifting toward path analysis territory, which handles multiple relationships at once.
How to run a moderation analysis: SPSS PROCESS, R, jamovi, and Julius
Once you know the model, running it is the easy part. A few common routes:
- SPSS PROCESS: Andrew Hayes's macro handles simple moderation with Model 1. It centers variables, builds the interaction, runs simple slopes, and plots the result. Grab it from Andrew Hayes's PROCESS page.
- R: one line does the core job: lm(outcome ~ predictor * moderator, data = your_data). The * adds both main effects and the interaction. Packages like interactions and marginaleffects handle simple slopes and Johnson–Neyman plots.
- jamovi: the free GAMLj module gives you a point-and-click interaction model with simple slopes and graphs, no syntax required.
- JASP: good for testing interactions with either frequentist or Bayesian regression. For moderators that are latent constructs, you'd step up to structural equation modeling instead.
- Julius: upload a dataset or connect your database, then ask in plain language whether W moderates the effect of X on Y. More on that below.
Assumptions and common mistakes to avoid
Moderation inherits the assumptions of whatever model you're running. For ordinary regression that means the usual suspects: a correctly specified form, independent observations, roughly constant residual variance, reliable measures, and enough spread in both X and W. And if X isn't randomized, causation has to be argued, not assumed.
The mistakes are more interesting, because they're the ones that quietly wreck an analysis:
- Reading W's main effect as moderation: a significant coefficient on W by itself proves nothing about moderation. The test is the X × W term.
- Dropping lower-order terms: keep X and W in the model whenever the interaction is in it. Pulling them out changes what the model even means.
- Chopping a continuous moderator into "high" and "low": it throws away information and power, and invents arbitrary cutoffs. Keep it continuous unless you have a real threshold.
- Thinking centering creates moderation: centering only moves the reference point. It doesn't add or remove an interaction.
- Reporting just the p-value: readers need the coefficient, the confidence interval, the simple slopes, and a plot to know what actually happened.
- Claiming causality from cross-sectional data: an interaction in a one-time survey describes a conditional association, nothing stronger.
Run your moderation analysis without writing code
Everything above assumes you're comfortable in SPSS syntax or R. Plenty of people who need a moderation answer, like marketers, finance analysts, and ops leads, aren't, and that's exactly where the work stalls.
That's exactly the problem we built Julius to solve. It's an AI data analysis tool that lets you run real statistics by asking questions in plain English, so a moderation test doesn't require a stats degree or a free afternoon fighting with code.
Here's how Julius helps:
- Ask in plain language: upload a CSV or connect a database like PostgreSQL, Snowflake, or BigQuery, then ask whether W moderates the effect of X on Y.
- Interaction terms, handled: Julius sets up the moderated regression, computes the X × W term, and tests whether it's significant.
- See the pattern: it plots simple slopes so you can read the interaction without writing any charting code.
- Repeatable analyses: re-run the same test on fresh data and get consistent output instead of a slightly different answer each time.
A moderating variable is really just a way of admitting that an effect isn't the same for everyone. A good test respects that, with theory behind it, the interaction term front and center, and honest reporting of what you found. Or skip the setup entirely and run the whole test with Julius’s AI statistics solver.
Want to test for moderation without touching a line of code? Try Julius for free today.
Frequently asked questions
What is the difference between moderation and mediation?
Moderation and mediation answer different questions. A mediator explains how or why X affects Y and sits on the path X → M → Y, while a moderator explains when or for whom by changing the strength or direction of the X–Y relationship through an interaction. A mediator must be caused by X; a moderator must not be.
Is a moderating variable the same as a moderator variable?
Yes, a moderating variable and a moderator variable are the same thing. Both names describe a third variable that changes the strength or direction of the relationship between a predictor and an outcome. You'll see the two terms used interchangeably across textbooks and papers.
How do you choose a moderator variable?
Choose a moderator that theory says should change the effect you're studying. It should be measurable with reasonable reliability, vary enough across your sample, and not be caused by your predictor. A good moderator has a clear reason to expect different slopes for different groups or values.
How do you know if moderation is significant?
Moderation is significant when the interaction term (X × W) in your regression is statistically significant, typically a p-value under 0.05 or a 95% confidence interval that excludes zero. A significant interaction means the moderator is changing the X–Y relationship rather than leaving it constant.
How do you interpret a moderating variable?
Interpret a moderating variable by probing the interaction, not just its sign. Estimate simple slopes at low, average, and high values of the moderator, then plot them to see the pattern. The moderator strengthens, weakens, or reverses the X–Y relationship depending on the size and direction of the interaction coefficient.