

The best AI-powered tools for marketing analysis turn campaign data into decisions you can act on. But search for AI marketing tools and you'll find lists that mix them in with caption generators and logo makers.
To sort through that clutter, I ran ad spend, lead, conversion, SEO ranking, and product analytics data through the tools I could access and researched the rest. Here are my top 15 picks for 2026, grouped by the analysis job each one does.
15 best AI-powered tools for marketing analysis: TL;DR
- Julius: Best for marketers and business users who want to ask questions of their data in plain English and get shareable charts without writing SQL
- Whatagraph: Best for agencies that send recurring multi-channel client reports
- AgencyAnalytics: Best for agencies that want white-label PPC and SEO client dashboards priced per client
- Adverity: Best for enterprise teams that need to unify and clean data from many marketing sources before analysis
- Databox: Best for small teams that want AI-assisted KPI dashboards with little setup
- Klipfolio: Best for data-minded teams that want to build custom dashboards and metrics from scratch
- Semrush: Best for marketers who research competitor keywords and track organic and AI search rankings in one place
- Similarweb: Best for teams sizing up a market and benchmarking traffic against competitors they can't measure directly
- Mixpanel: Best for growth teams tracing where users drop off between the ad click and the conversion
- Fullstory: Best for teams diagnosing a conversion problem by watching session replays alongside behavioral data
- HubSpot Marketing Hub: Best for marketers who want predictive lead scoring and campaign analytics in the same place as their CRM contacts
- Optimove: Best for enterprise marketing teams that want churn and lifetime value predictions tied to their customer segments
- Otterly AI: Best for marketers tracking whether ChatGPT, Google AI Overviews, and Perplexity mention their brand
- ChatGPT: Best for marketers who want quick, one-off answers from an uploaded campaign export
- Claude: Best for marketers who want step-by-step reasoning on a dataset they upload
How I researched and tested these AI-powered marketing analysis tools
I ran sample ad spend, lead, conversion, SEO ranking, and product analytics data through the tools I could access and reviewed the rest through vendor documentation and product walkthroughs.
I asked each one the questions marketers ask every week, like which channel drove the cheapest conversions and where users dropped off. Then I checked every answer against what I could already see in Google Analytics and my ad accounts.
Here's what I considered:
- Depth of insight: Whether the tool told me something I'd act on or only repackaged a number I already had
- Setup effort: How long it took to connect a data source and reach a usable answer
- Pricing clarity: Whether the plan I'd need is the one on the pricing page or sits several tiers up
- Data connections: How many of my data sources it pulled in without a workaround
- Sharing and collaboration: Whether I could pass a result to a teammate or client without exporting a screenshot
The picks that earned their spot pointed me to a next step, like a drop-off point or a keyword gap, and the ones that only restated my numbers ranked lower.
💡 Tip: If you want reporting across every channel, you can find that wider category in our guide to marketing analytics tools.
15 best AI-powered tools for marketing analysis: quick comparison
| 💻 Tool | 🎯 Best for | 🔥 Starting price (billed annually) | ⚡ Strengths |
| Julius | Asking data questions without SQL | $16/month | Natural-language questions, shareable charts, and public data search |
| Whatagraph | Agency reporting across ad platforms | $812/month | Cross-channel reports, AI-written summaries, and white-label output |
| AgencyAnalytics | Branded dashboards for many small clients | $20/client/month | White-label dashboards, scheduled client reports, and an AI search tracking add-on |
| Adverity | Enterprise data unification | Custom pricing | Data integration, automated cleaning, and unified dashboards |
| Databox | Quick KPI views for lean teams | $71/month, 5 data sources included | An AI analyst for metric questions, prebuilt dashboards, and a free plan |
| Klipfolio | Custom metric and layout design | $120/month, includes 3 dashboards | Custom dashboards, scripted calculations, and wide integration coverage |
| Semrush | Competitor keyword gaps | $117.33/month | Keyword gap analysis, traffic analytics, and AI visibility tracking |
| Similarweb | Market share benchmarking | $125/month | Traffic estimates, audience overlap, and AI-built market dashboards |
| Mixpanel | Funnel drop-off analysis | Custom pricing | Funnels, retention curves, and behavioral cohorts |
| Fullstory | Seeing why visitors leave | Custom pricing | Session replay, heatmaps, and AI session summaries |
| HubSpot Marketing Hub | Campaign reporting inside a CRM | $7/user/month | Customer journey analytics, CRM-tied reporting, and lead scoring on higher plans |
| Optimove | Churn and lifetime value forecasting | Custom pricing | Churn prediction, lifetime value modeling, and customer segmentation |
| Otterly AI | Brand mentions in AI answers | $25/month | Multi-engine tracking, citation analysis, and GEO audits |
| ChatGPT | One-off questions on uploaded exports | $8/month, billed monthly | File-based analysis, chart generation, and deep research |
| Claude | Explained reasoning on uploaded datasets | $17/month | Step-by-step reasoning, large file handling, and code execution |
*Pricing correct as of October 2026. Confirm with vendor.
Reporting and dashboards
1. Julius: Best for asking data questions without SQL

- What it does: Julius is an AI data analysis tool where you ask questions in plain English and get back charts, tables, and reports.
- Best for: Marketers and business users who want answers from their campaign data without waiting on an analyst
We built Julius so marketers can start an analysis from a question, with or without a spreadsheet in hand. You can connect or upload your own campaign data, search the web for public datasets, or pull company financials through our Financial Datasets partnership covering 17,000+ companies.
As you keep querying connected data, Julius can get better at finding where the right data lives, so answers may get faster and more precise. Vague questions can return broad answers, so you may need a few follow-ups.
Key features
- Natural language analysis: Type a marketing question in plain English and get a marketing visualization, table, or written summary.
- Three ways to bring in data: Connect or upload your own files, search the web for public datasets, or query financial data through the Financial Datasets partnership
- Report and presentation output: Turn an analysis into a written report with the AI Report Generator or a deck with the AI Presentation Maker
Pros and cons
| ✅ Pros | ❌ Cons |
| Follow-up questions let you narrow a result to one channel, campaign, or date range | The prompt-led workflow takes practice for people used to drag-and-drop dashboard builders |
| Charts can be styled with brand colors and fonts before you share them | Heavy statistical modeling and advanced forecasting may call for a specialist tool |
| Results can be exported so teammates without a Julius account can still review them |
What users say
Pro: “If you spend more than 2 hours a week working with data, Julius AI will save you time. Start with the free plan. You’ll know within a week if it fits your workflow. For most non-technical users, it’s a no-brainer.” (Fahim Joharder, Fahim AI independent Julius review)

Con: “Not gonna lie, the first time I uploaded a messy CSV with empty values, the results were off. AI can help identify outliers and handle empty values. But you still need to clean your raw data first.” (Fahim Joharder, Fahim AI independent Julius review)
Pricing
Julius starts at $16 per month.
Bottom line
You can show the code behind any chart to check how Julius calculated a number. If you need recurring branded reports across several ad platforms for clients, Whatagraph might be a better fit.
2. Whatagraph: Best for agency reporting across ad platforms
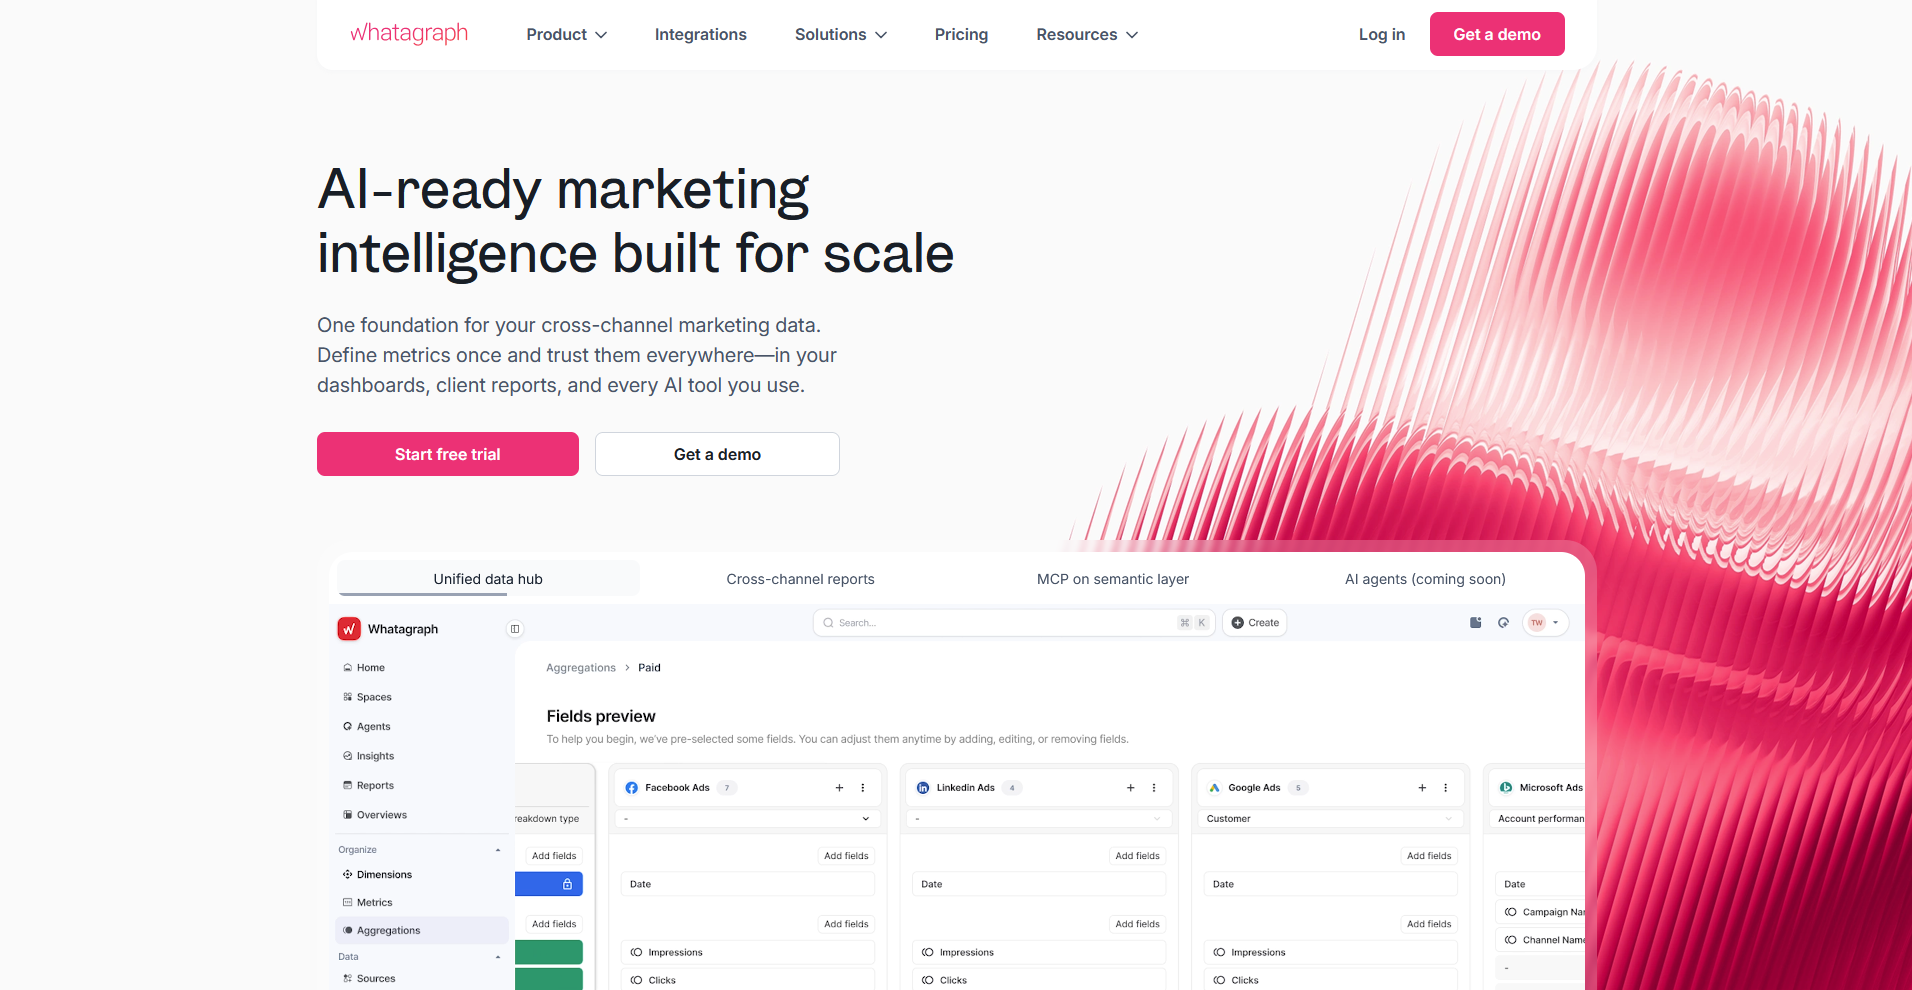
- What it does: Whatagraph is a marketing reporting platform where you pull data from multiple ad and analytics platforms into one client-ready report.
- Best for: Agencies that send polished multi-channel performance reports to clients on a regular schedule
To see how Whatagraph handled a multi-channel client report, I connected Google Ads, Meta Ads, and Google Analytics and built a single report from all three. That report replaced the separate exports I'd normally stitch together by hand.
The Whatagraph IQ summary listed which numbers moved but said little about why, so I had to rewrite it with campaign context before it was ready for a client.
Key features
- Cross-channel integration: Combine data from ad, social, and analytics platforms in one report.
- Whatagraph IQ: Generate written summaries of performance changes from connected data.
- White-label reports: Apply your own agency branding to client-facing reports.
Pros and cons
| ✅ Pros | ❌ Cons |
| One report replaces several platform exports, so there's less manual copying between tabs | Built around agency workflows, so in-house teams with a single brand may use few of the client-facing features |
| Written summaries give clients a plain-English read on what changed | Summaries stay general, so adding campaign context takes extra time |
| Reports can carry agency branding, so clients see your logo |
What users say
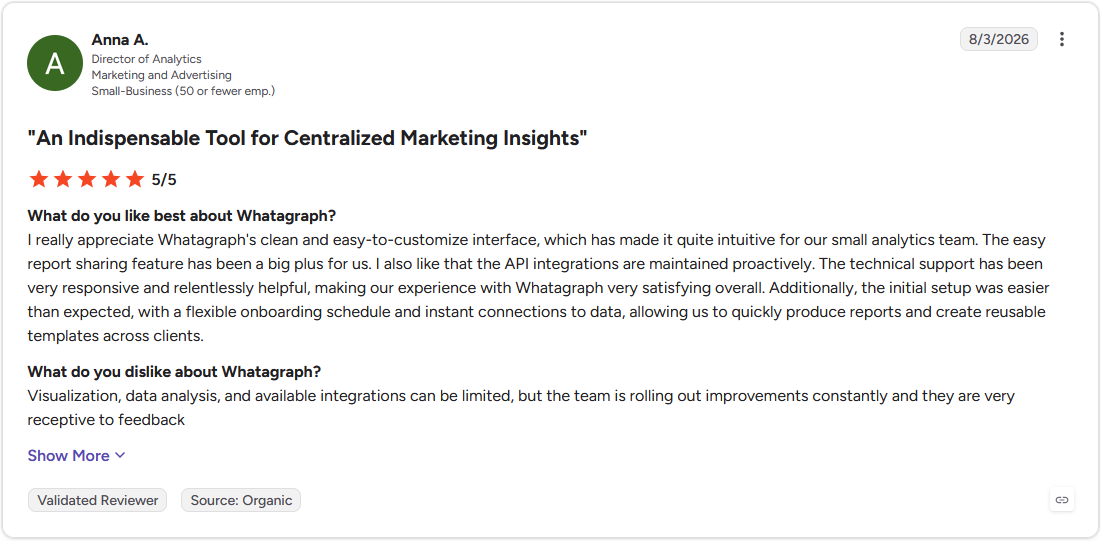
Pro: "I really appreciate Whatagraph's clean and easy-to-customize interface, which has made it quite intuitive for our small analytics team. The easy report sharing feature has been a big plus for us." (Anna A., G2)
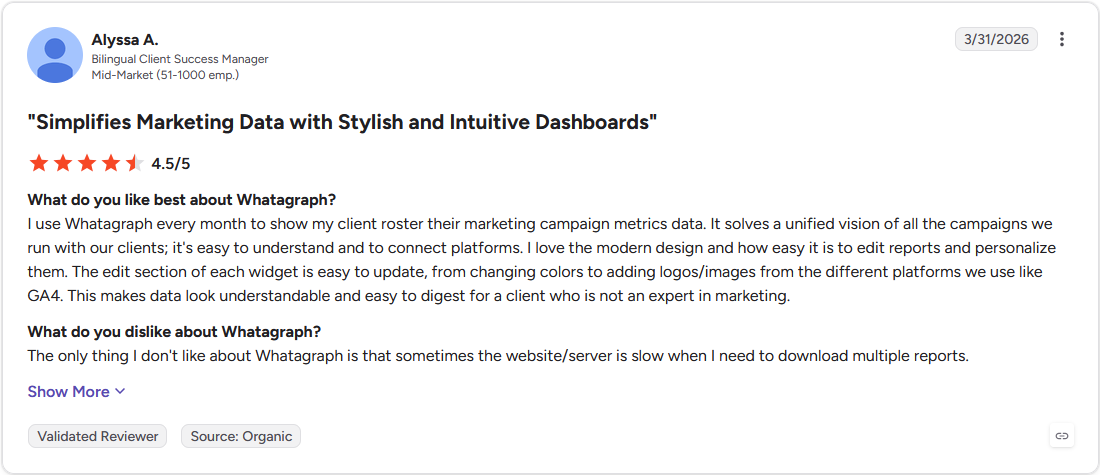
Con: "The only thing I don't like about Whatagraph is that sometimes the website/server is slow when I need to download multiple reports." (Alyssa A., G2)
Pricing
Whatagraph starts at $812 per month.
Bottom line
Reports can be scheduled to send to clients on a set day. If you manage many small clients, AgencyAnalytics could be worth a look.
3. AgencyAnalytics: Best for branded dashboards for many small clients
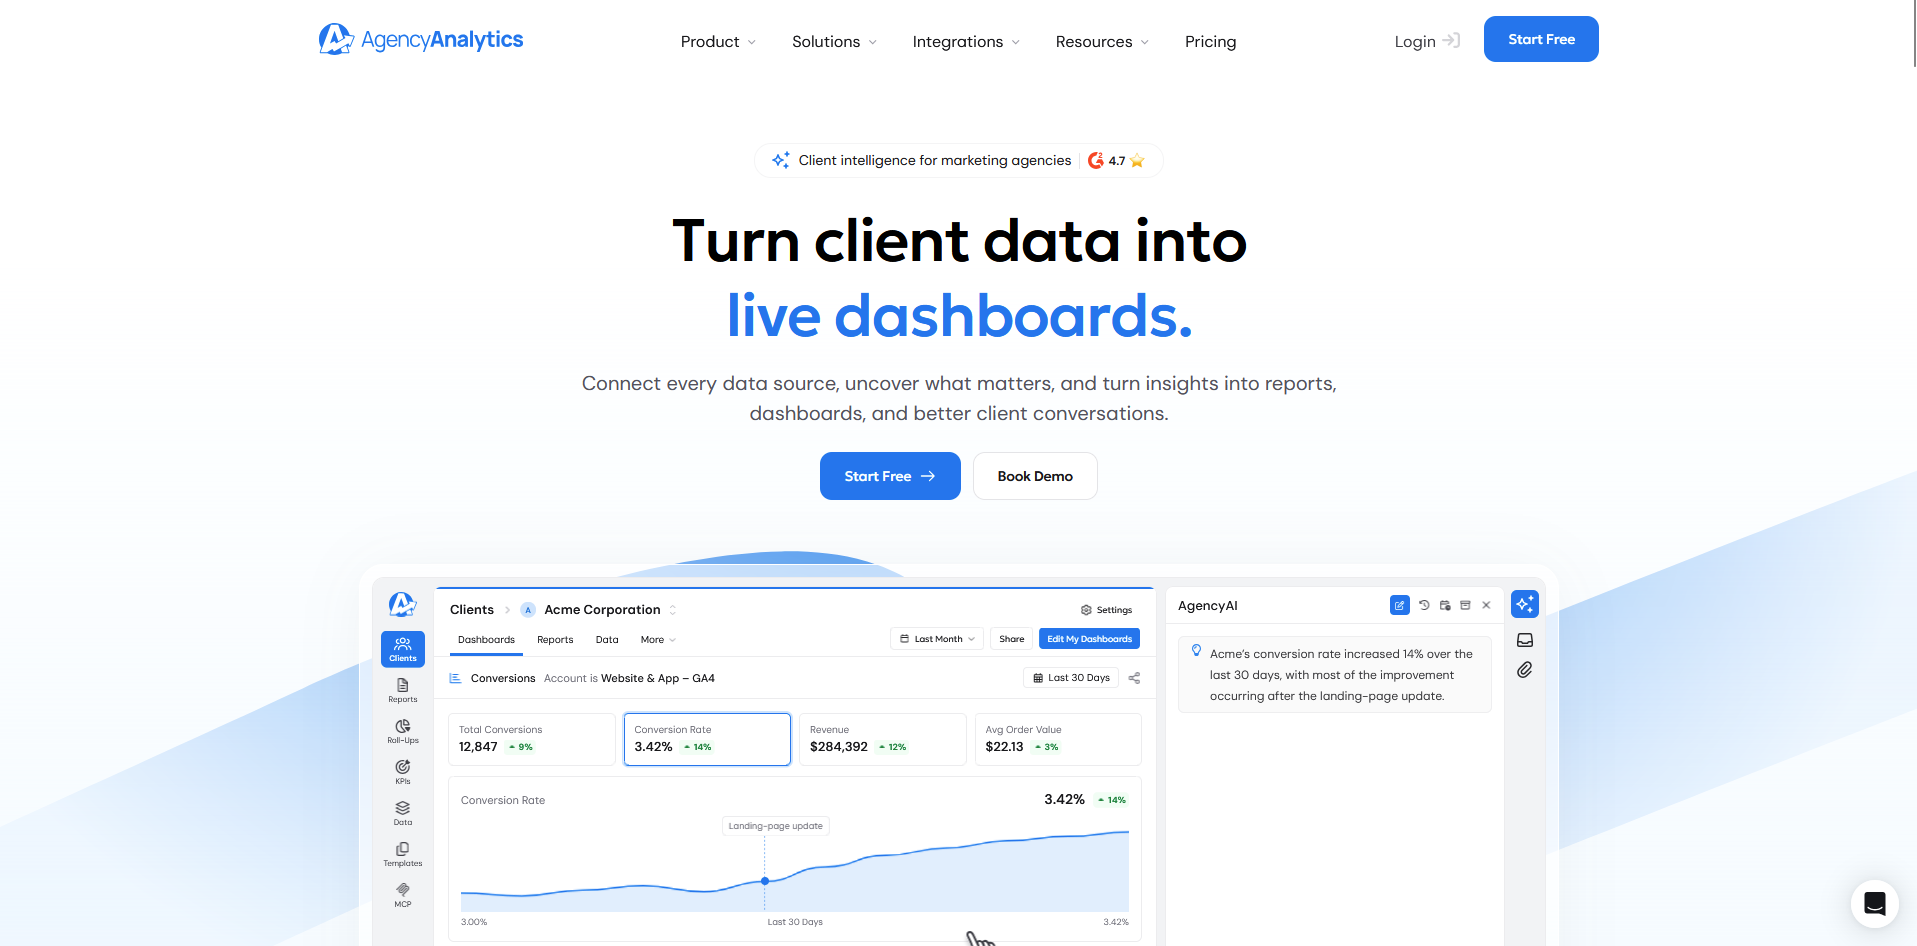
- What it does: AgencyAnalytics is a client reporting platform where you build white-label dashboards for PPC, SEO, and social campaigns.
- Best for: Agencies that need a separate, branded PPC and SEO dashboard for each client on a long roster
AgencyAnalytics is built around white-label client dashboards, so I tested it by connecting Google Ads, Meta Ads, and a rank tracker for a sample client to see how quickly a branded view came together.
The dashboard reported each channel's results clearly and needed no design work from me. When I wanted to learn why a metric moved, I had to look in other tools, because the dashboards focus on reporting.
Key features
- White-label dashboards: Build branded client dashboards that pull in PPC, SEO, and social data.
- Scheduled client reports: Set reports to send to clients on a recurring schedule.
- AI search tracking add-on: Monitor how a client's brand appears in AI-generated answers.
Pros and cons
| ✅ Pros | ❌ Cons |
| Rank tracking and ad metrics appear side by side in one client view | In-house teams reporting on a single brand may use few of the client-facing features |
| Prebuilt connections make setup quick when a new client signs on | Dashboard layouts follow the platform's templates, so unusual client requests may take workarounds |
| Each client gets a separate dashboard, so reporting stays organized by account |
What users say
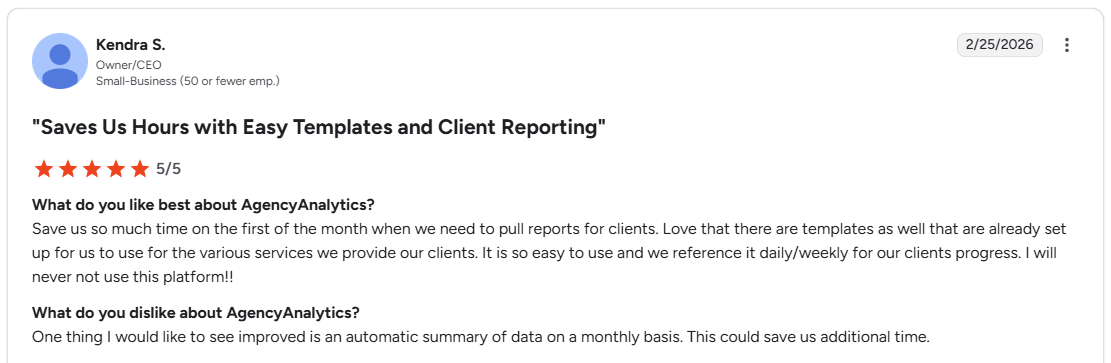
Pro: “Save us so much time on the first of the month when we need to pull reports for clients. Love that there are templates as well that are already set up for us to use for the various services we provide our clients.” (Kendra S., G2)
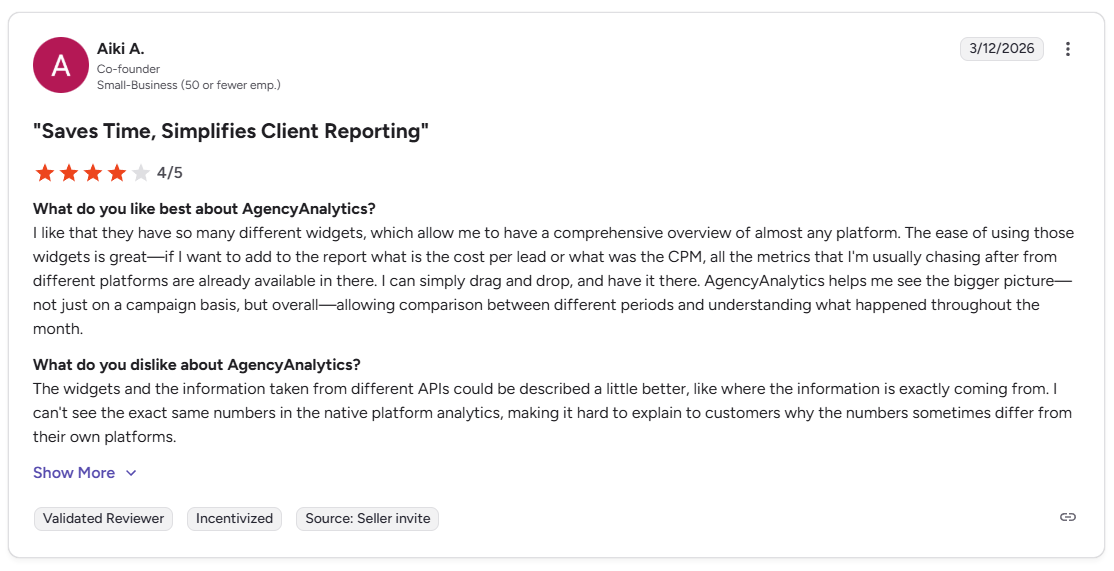
Con: “I can't see the exact same numbers in the native platform analytics, making it hard to explain to customers why the numbers sometimes differ from their own platforms.” (Aiki A., G2)
Pricing
AgencyAnalytics starts at $20 per client per month.
Bottom line
Every core feature is included in the per-client rate, so there are no plan tiers to compare (rank tracking and AI search tracking cost extra). If cleaning data from many sources before reporting is your bigger challenge, Adverity may suit you better.
4. Adverity: Best for enterprise data unification
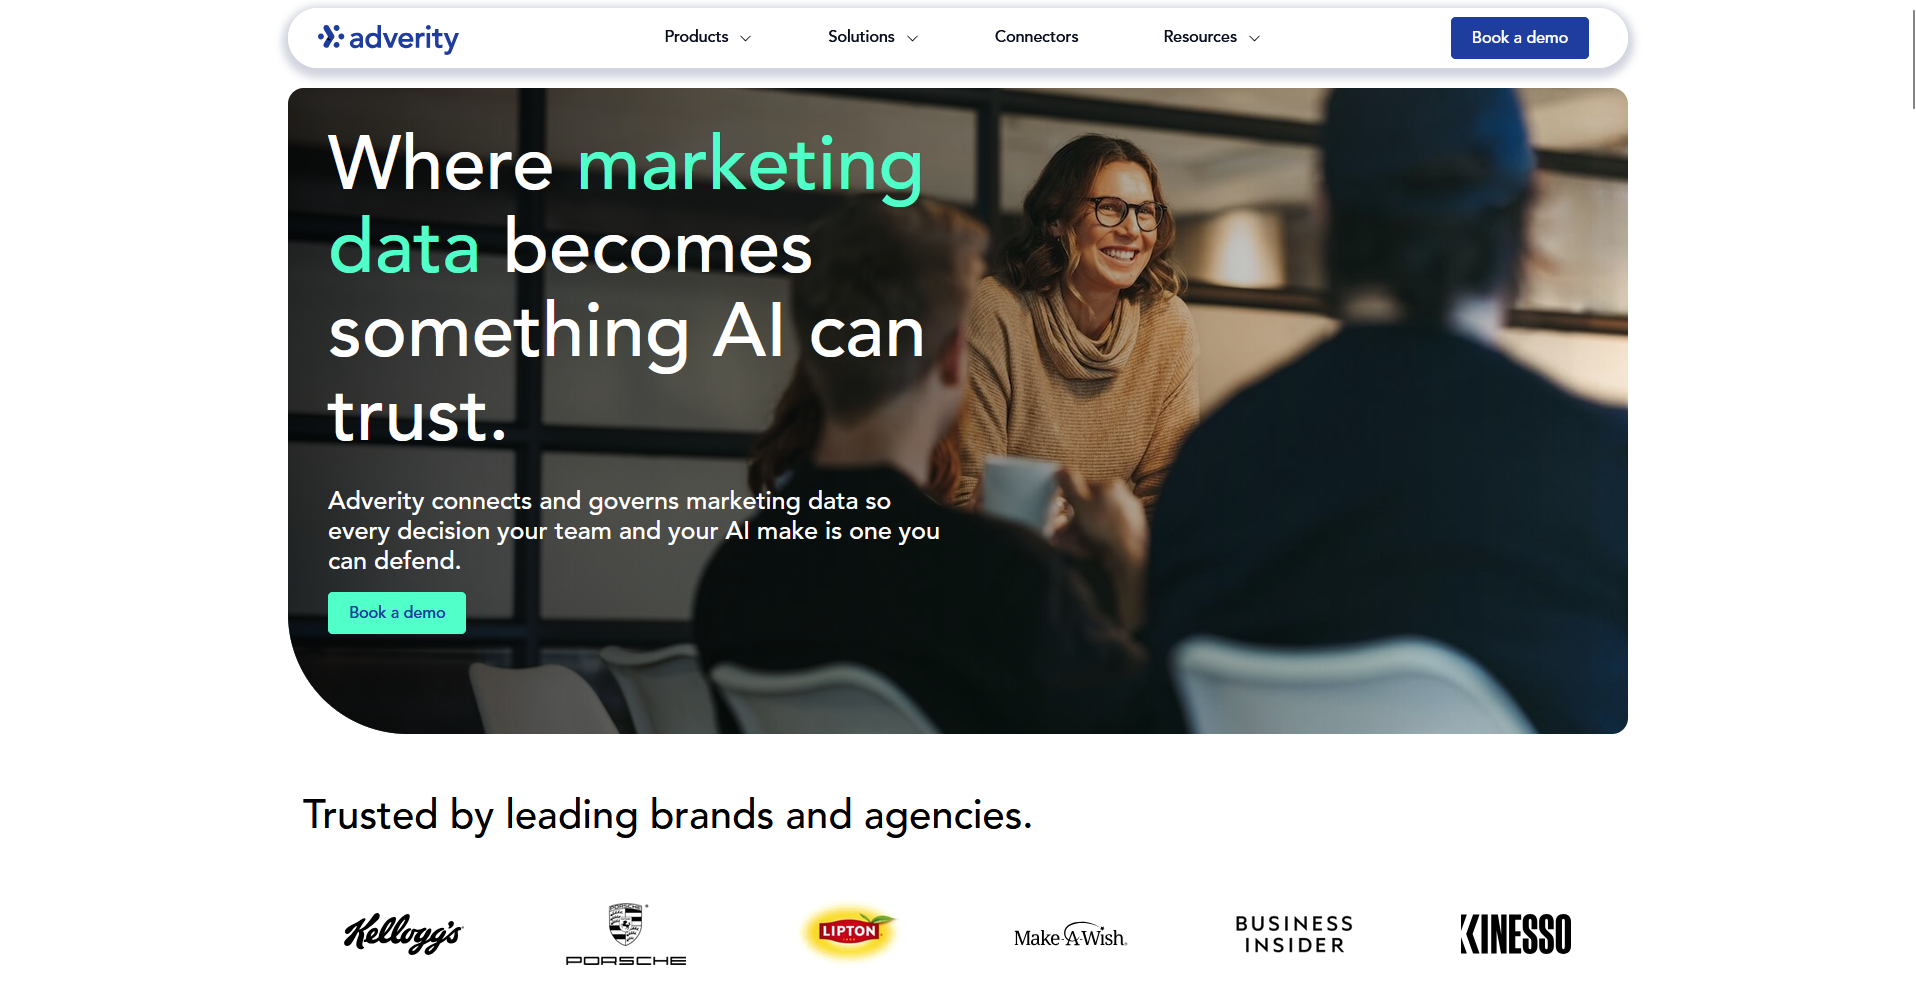
- What it does: Adverity is a marketing data integration platform where you collect data from ad platforms, analytics tools, and CRMs, then clean and standardize it for analysis.
- Best for: Enterprise marketing and analytics teams that pull data from many sources into one reporting layer
I reviewed Adverity's documentation and a product walkthrough to see how it collects data from ad platforms, analytics tools, and CRMs and standardizes it before reporting. In the walkthrough, I watched field names and formats from each source get matched in one place, a step that could replace hours of spreadsheet cleanup.
Setup looked like a job for a data team, so a small marketing group may need technical help to get started.
Key features
- Data integration: Connect and unify data from marketing, sales, and analytics sources.
- Automated transformations: Clean and standardize fields before the data reaches a report.
- Data delivery: Send clean, standardized data to your warehouse or dashboard tool.
Pros and cons
| ✅ Pros | ❌ Cons |
| Data from several platforms can sit side by side for direct comparison | Teams with only a few data sources may use little of what it offers |
| Cleaning rules can run each time new data arrives, so manual spreadsheet fixes shrink | Its core product prepares and organizes data, so you may need another tool to dig into insights. |
| A large number of sources fit in one place, which suits teams managing many platforms |
What users say
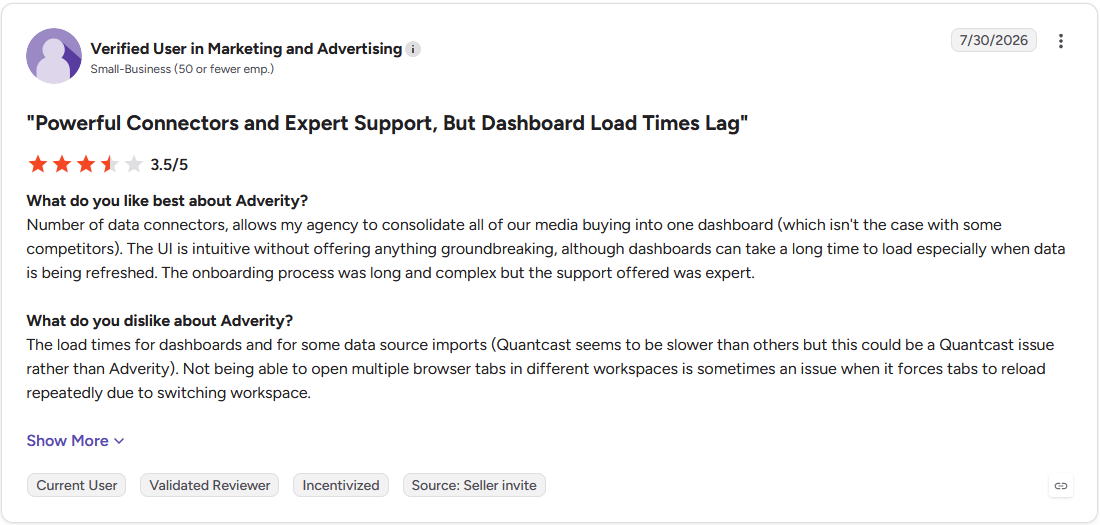
Pro: "Number of data connectors, allows my agency to consolidate all of our media buying into one dashboard (which isn't the case with some competitors)." (Verified User in Marketing and Advertising, G2)
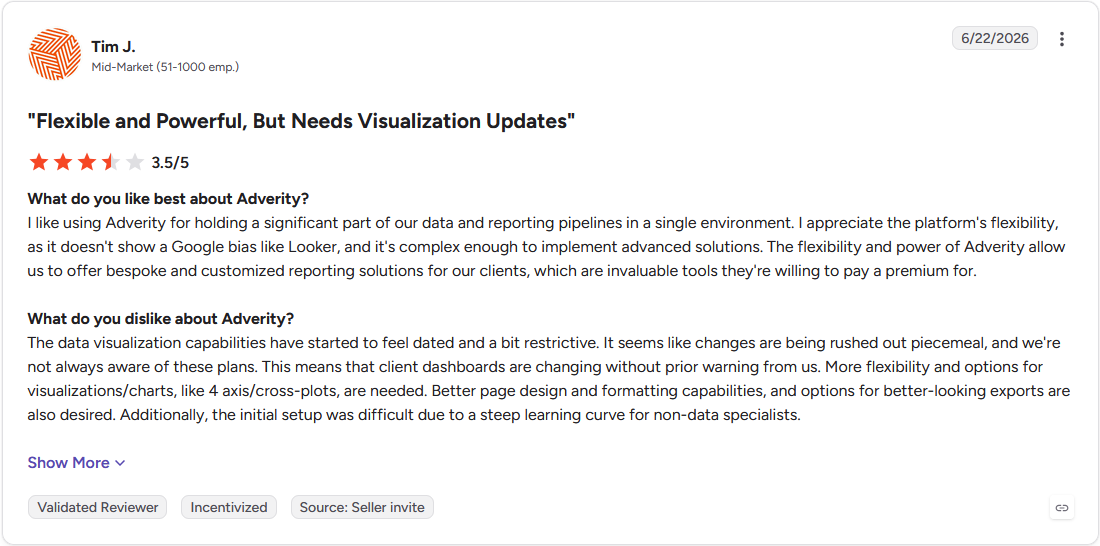
Con: "Additionally, the initial setup was difficult due to a steep learning curve for non-data specialists." (Tim J., G2)
Pricing
Adverity offers custom pricing.
Bottom line
Adverity’s focus on data preparation gives teams a consistent base for any dashboard or analysis tool they use afterward. If you want dashboards you can set up without a data team, Databox is worth checking.
5. Databox: Best for quick KPI views for lean teams
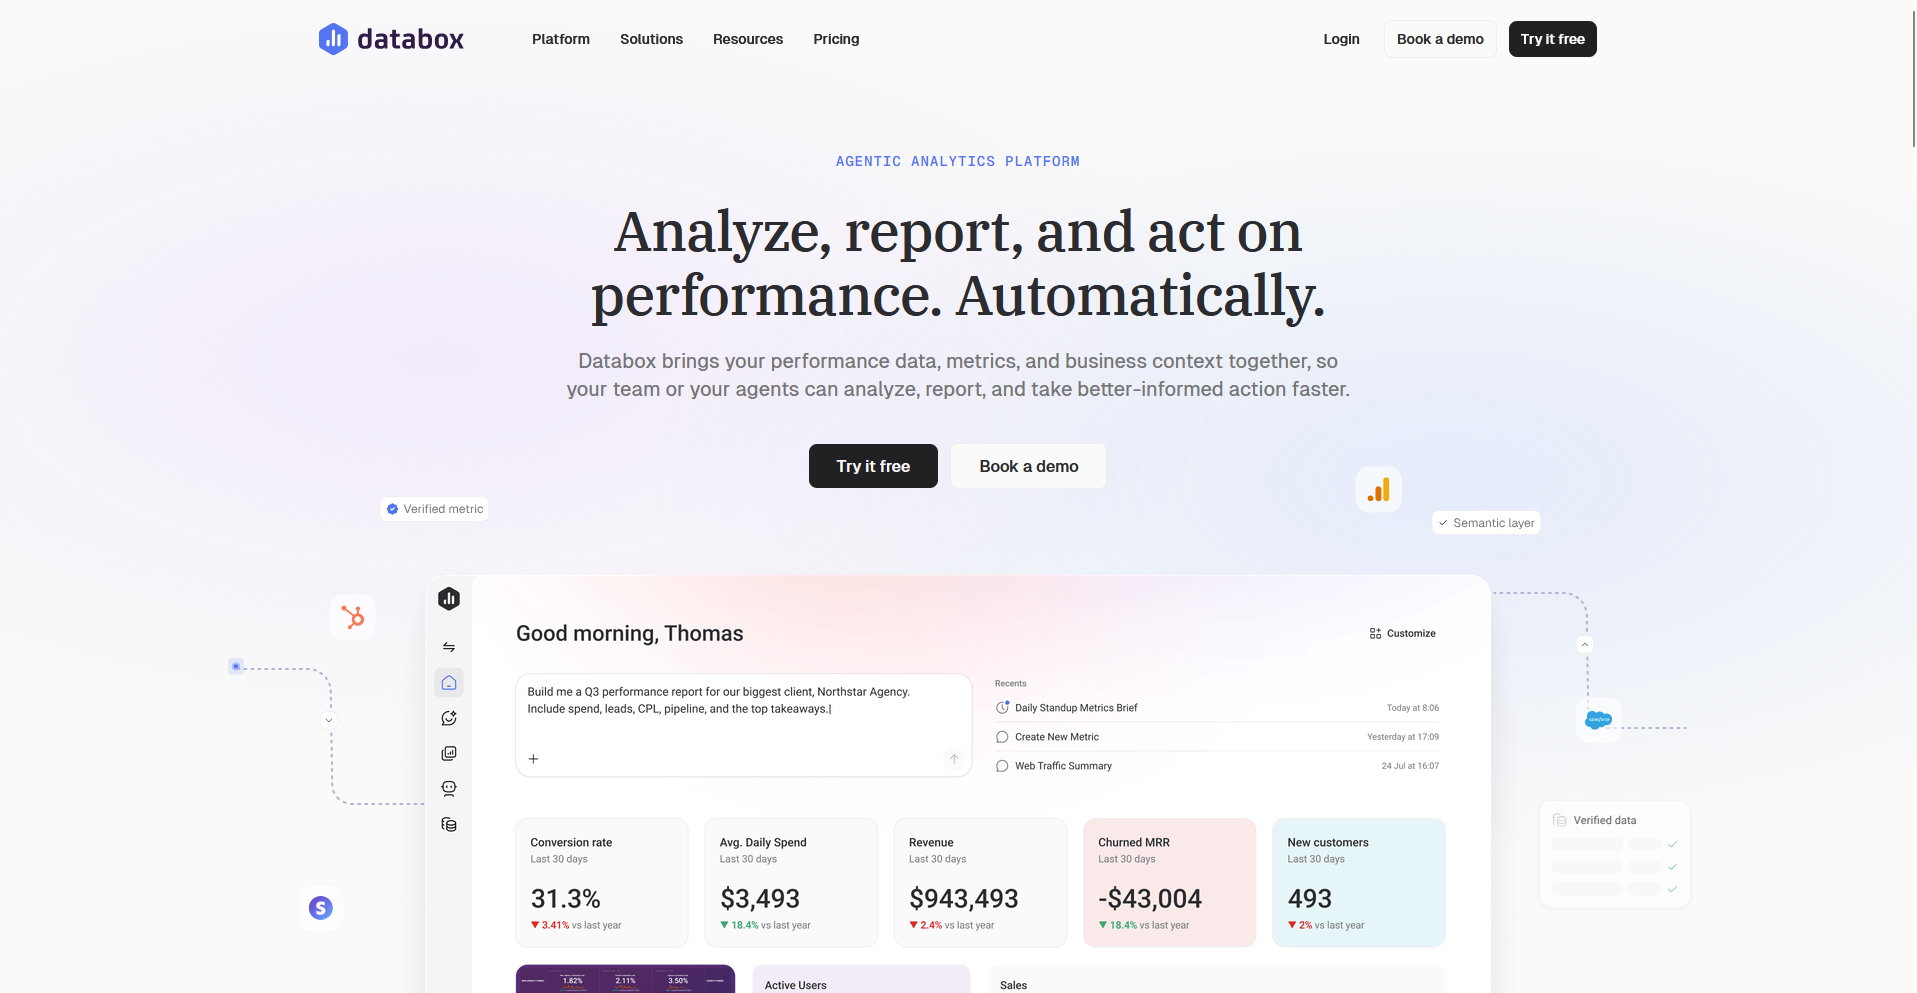
- What it does: Databox is a KPI dashboard platform where you connect your marketing tools and ask an AI analyst questions about performance.
- Best for: Small marketing teams that want working KPI views without a long setup
Databox works by pulling marketing and sales data into KPI dashboards with an AI analyst on top, so I linked Google Ads and a CRM and asked for a performance summary.
I got a plain-English answer showing which campaigns were bringing in leads, and the dashboard was clean enough that I could hand it to a teammate without touching it. Layout options were limited, and a couple of views needed workarounds before they looked the way I wanted.
Key features
- AI analyst: Ask about performance in plain English and get an answer with supporting charts.
- Governed semantic layer: Set metric definitions in one place so the AI analyst reads them consistently.
- Prebuilt dashboards: Start from templates built for common marketing and sales data sources.
Pros and cons
| ✅ Pros | ❌ Cons |
| A free plan lets you try the AI analyst on a small dataset before paying | Layout and styling options are limited for teams that want highly custom dashboards |
| Shared metric definitions can reduce disagreements over whose number is right | AI credits can cap heavier use of the AI analyst on lower plans |
| Answers arrive with a dashboard attached, so results can go straight into a team meeting |
What users say
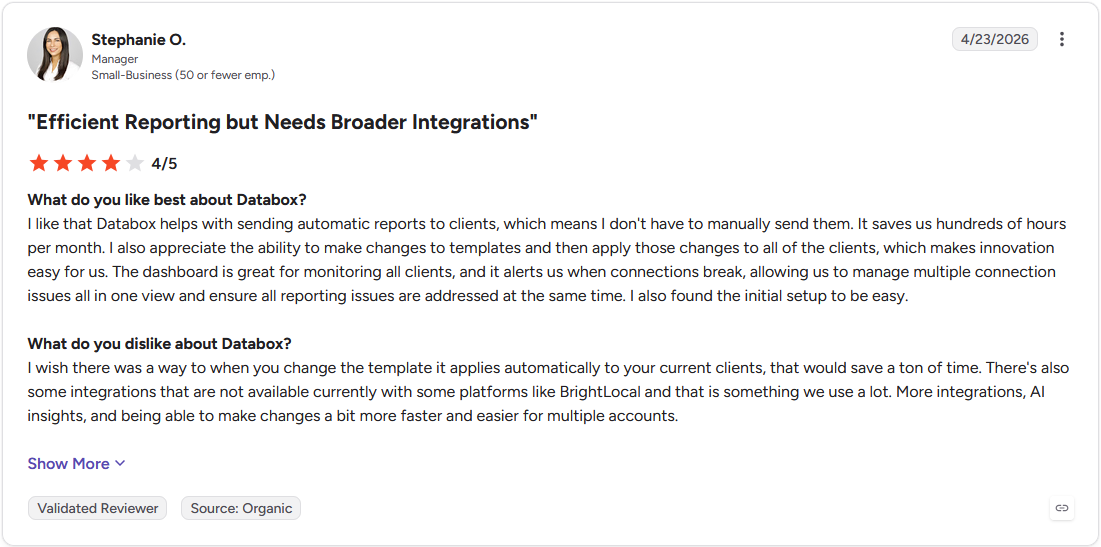
Pro: "I like that Databox helps with sending automatic reports to clients, which means I don't have to manually send them. ... I also found the initial setup to be easy." (Stephanie O., G2)
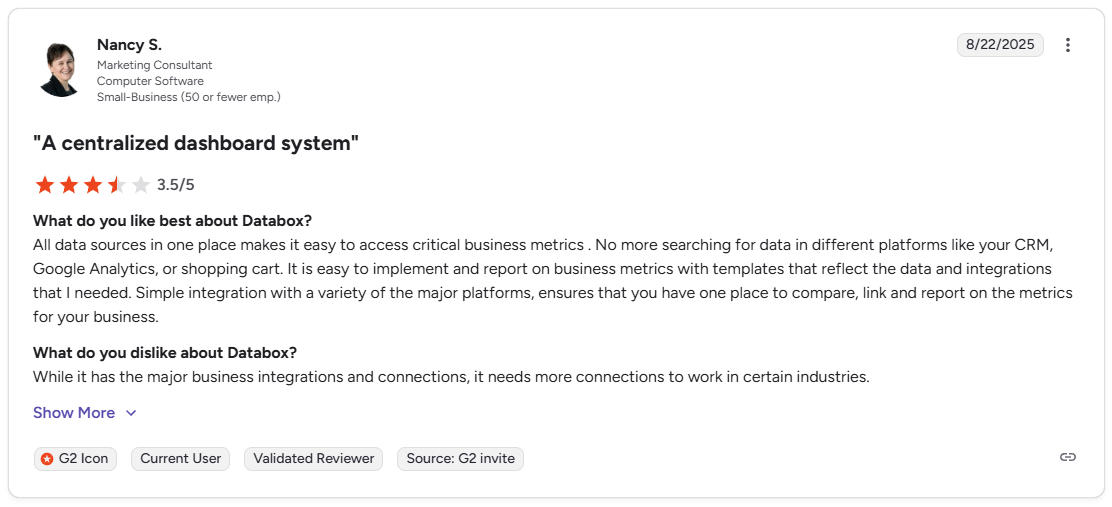
Con: “While it has the major business integrations and connections, it needs more connections to work in certain industries.” (Nancy S., G2)
Pricing
Databox starts at $71 per month with 5 data sources included.
Bottom line
Teams can keep a short list of KPIs in view on a single dashboard. If you want full control over how dashboards are built, Klipfolio is worth a closer look.
6. Klipfolio: Best for custom metric and layout design
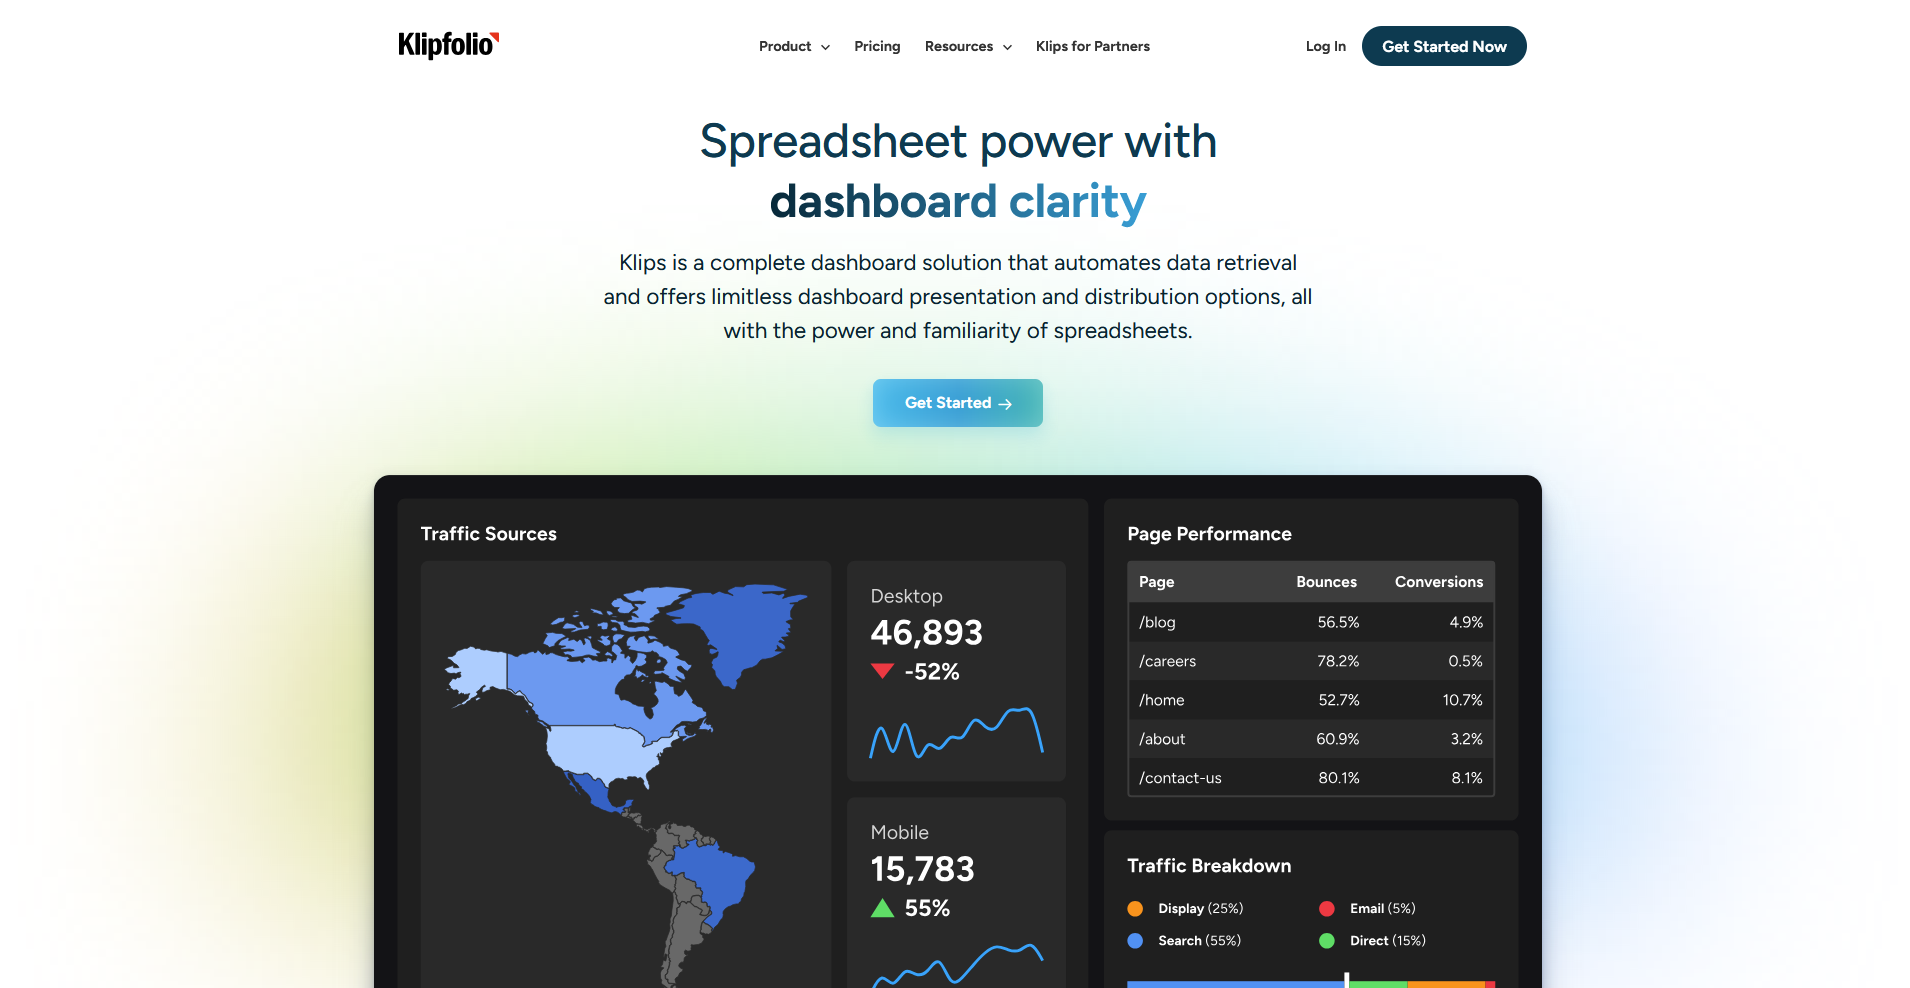
- What it does: Klipfolio is a dashboard platform where you build custom metrics and layouts from marketing, sales, and database sources.
- Best for: Data-minded teams that want to design each metric and dashboard layout themselves
To see how much control Klipfolio gives you over a dashboard, I built a campaign view from scratch, creating my own metrics and scripting a couple of calculations before arranging the layout.
The finished dashboard showed the numbers I'd planned for, in the order I wanted them. Getting there took me about an afternoon of writing formulas to define each metric before any chart appeared on the page.
Key features
- Custom dashboards: Design layouts and metrics, including scripted calculations.
- Wide integrations: Connect marketing, sales, and database sources to one dashboard.
- PowerMetrics: Use a metric-focused analytics layer alongside traditional dashboards.
Pros and cons
| ✅ Pros | ❌ Cons |
| Metrics with unusual definitions can be built to match how your team measures them | Building from scratch takes time and some comfort with formulas |
| Unlimited users on every plan means a whole team can view the same dashboards | Marketers who want a quick answer from a question may find a build-first workflow slow |
| Layouts can be arranged around one stakeholder's questions, which suits executive reporting |
What users say
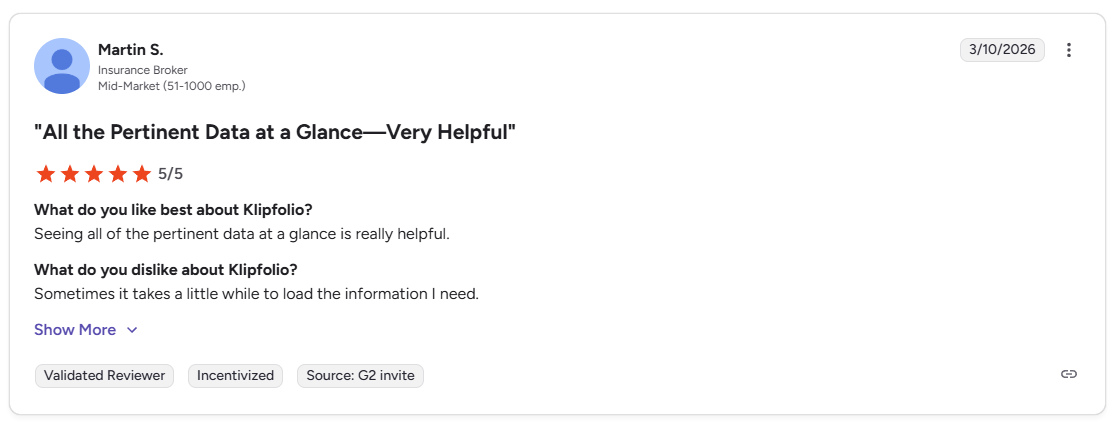
Pro: “Seeing all of the pertinent data at a glance is really helpful.” (Martin S., G2)
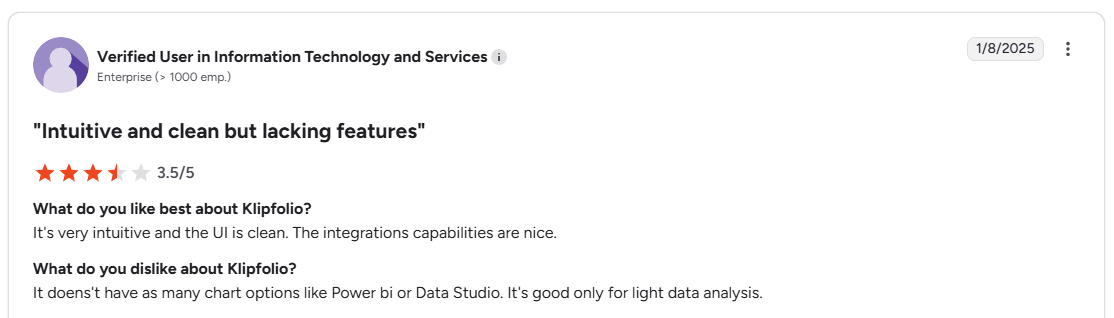
Con: “It doesn't have as many chart options like Power BI or Data Studio. It's good only for light data analysis.” (Verified User, G2)
Pricing
Klipfolio starts at $120 per month and includes 3 dashboards.
Bottom line
Klipfolio’s dashboards are built from metrics you define, so each number can be traced back to a formula. If your team wants to type a question and get a chart back, Julius could be worth testing.
SEO and competitor analysis
7. Semrush: Best for competitor keyword gaps
- What it does: Semrush is an SEO and competitor analysis platform where you research keywords, backlinks, and rival traffic, and track how your brand appears in AI search.
- Best for: Marketers who want to see a competitor's organic strategy and find the keywords it ranks for that you don't
I pointed Semrush at a competitor's domain to see what its organic strategy looked like. Its top pages, paid keywords, and traffic trend came up within a couple of minutes, and the keyword gap report lined my rankings up against three rivals. The AI visibility tracking took longer, since I had to work out which prompts to follow before the data meant anything.
Key features
- Keyword gap analysis: Compare your rankings against competitors and list the terms they rank for that you don't.
- Traffic analytics: Estimate a competitor's traffic sources, top pages, and audience overlap.
- AI visibility tracking: Monitor whether AI engines mention your brand for the prompts you choose.
Pros and cons
| ✅ Pros | ❌ Cons |
| Rank tracking can be split by region and device | AI visibility reports need prompt setup before they're useful |
| Site audits run in the same account as rank tracking, so technical issues show up next to ranking changes | Competitor traffic figures are estimates, so they may differ from a rival's own analytics |
| Competitor ad and keyword data sit beside your own, which makes side-by-side comparison direct |
What users say
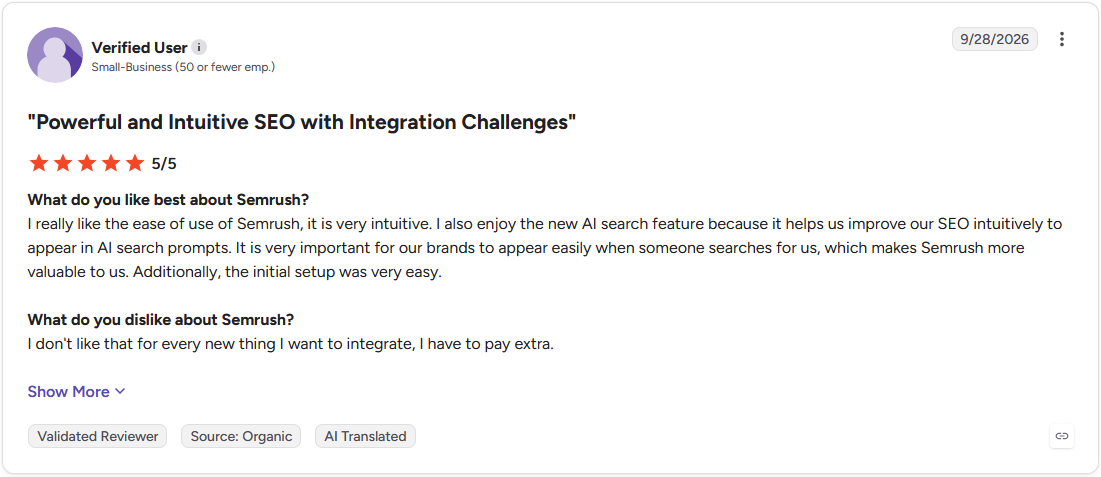
Pro: "I also enjoy the new AI search feature because it helps us improve our SEO intuitively to appear in AI search prompts." (Verified User, G2)
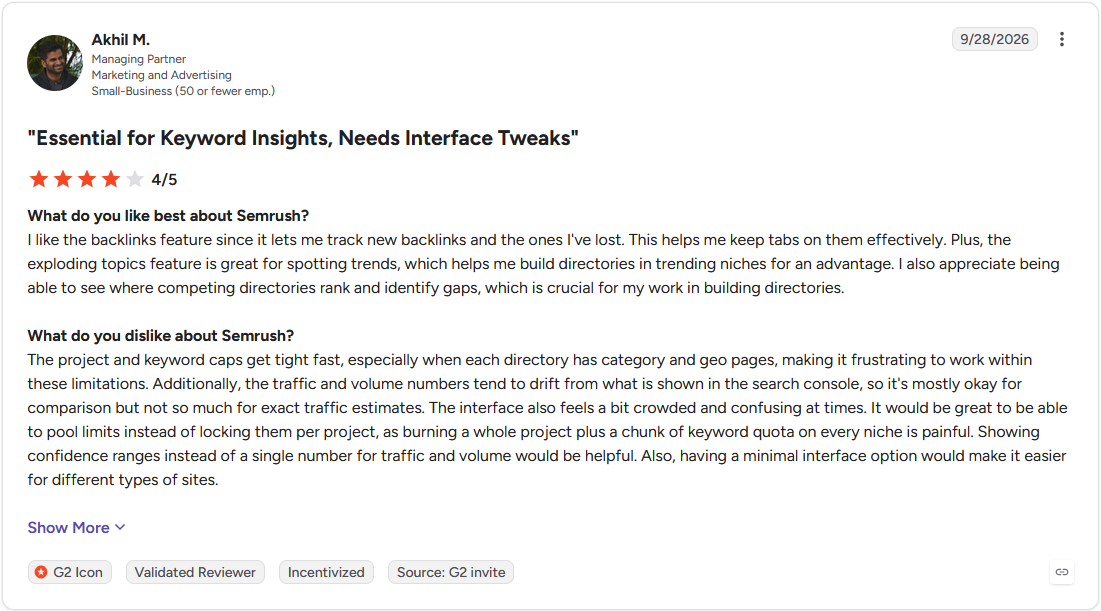
Con: "Additionally, the traffic and volume numbers tend to drift from what is shown in the search console, so it's mostly okay for comparison but not so much for exact traffic estimates." (Akhil M., G2)
Pricing
Semrush starts at $117.33 per month.
Bottom line
Semrush offers an MCP connector that links your account to AI assistants like Claude. If you mostly need traffic and market estimates, Similarweb might fit better.
8. Similarweb: Best for market share benchmarking
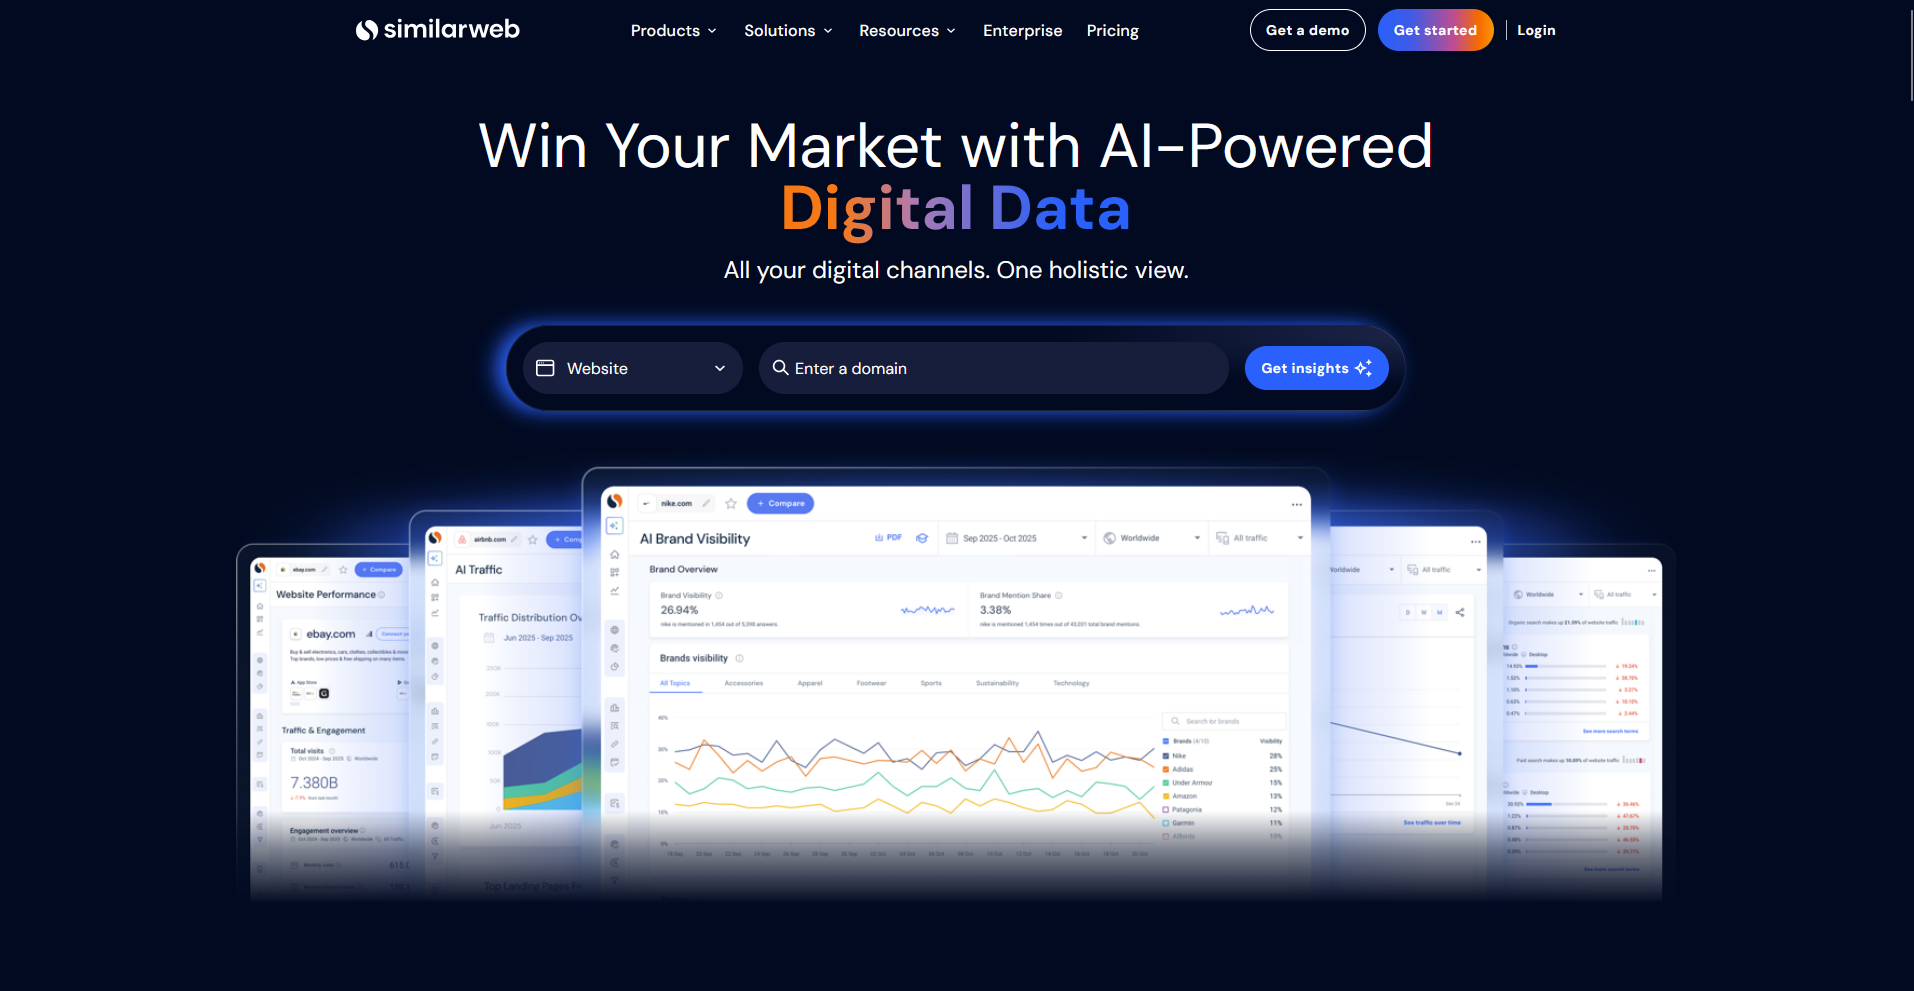
- What it does: Similarweb is a market intelligence platform where you estimate website and app traffic, market share, and audience behavior across a set of competitors.
- Best for: Teams sizing up a market and benchmarking traffic against competitors they can't measure directly
Similarweb is built around modeled traffic estimates, so I tested it by comparing traffic share across a handful of competitors to see who was growing. The report showed which channels fed each rival and where their audiences overlapped with ours, which gave me a clear picture of the market in one sitting.
The numbers didn't match our own analytics exactly, so I treated them as a direction to check before moving any budget.
Key features
- Traffic and market analysis: See estimated traffic, traffic sources, and audience overlap for any set of competitors.
- AI brand visibility: Review which prompts and AI channels send visitors to a site.
- Competitive benchmarking: Compare your paid search and audience engagement against rivals.
Pros and cons
| ✅ Pros | ❌ Cons |
| Market data is organized by use case, so a marketer can open a competitor view without sorting through unrelated reports | Some of the AI search tools are sold as a separate product, so costs can add up |
| AI referral traffic appears in reports shaped like GA4, so the format looks familiar to most marketers | Lower plans may offer too little depth for larger teams running many competitor comparisons |
| Audience overlap shows where competitors draw the same visitors you do |
What users say
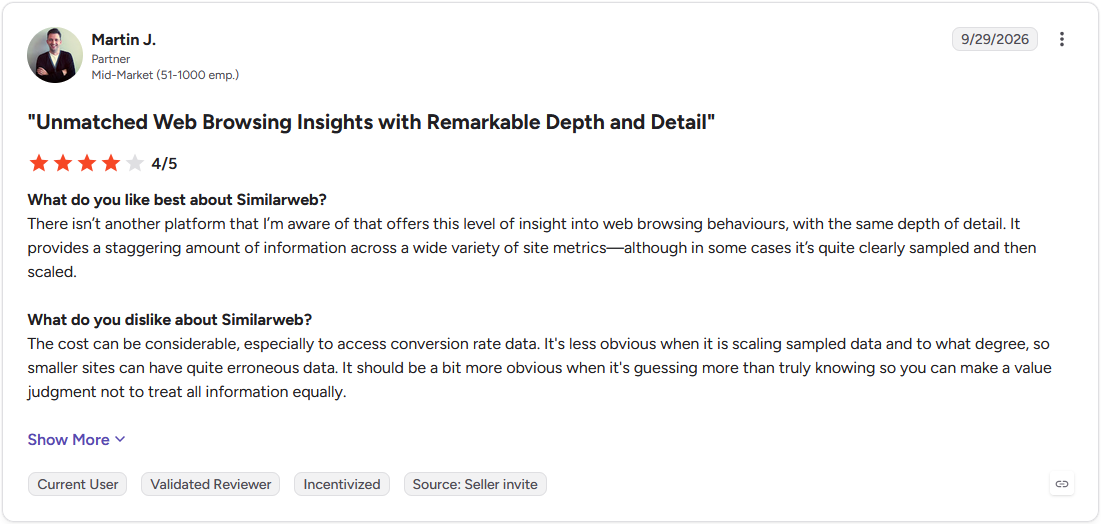
Pro: "There isn't another platform that I'm aware of that offers this level of insight into web browsing behaviours, with the same depth of detail." (Martin J., G2)
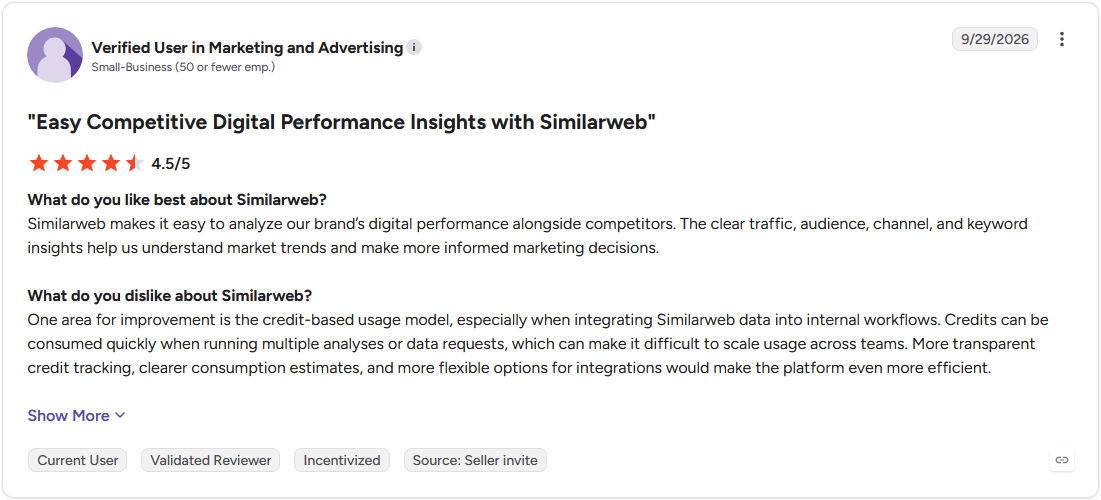
Con: "Credits can be consumed quickly when running multiple analyses or data requests, which can make it difficult to scale usage across teams." (Verified User in Marketing and Advertising, G2)
Pricing
Similarweb starts at $125 per month.
Bottom line
Similarweb tracks referral traffic from AI chatbots, so you can see which AI channels send visitors. If you need keyword-level detail on what competitors rank for, Semrush would be a closer match.
Web and product analytics
9. Mixpanel: Best for funnel drop-off analysis
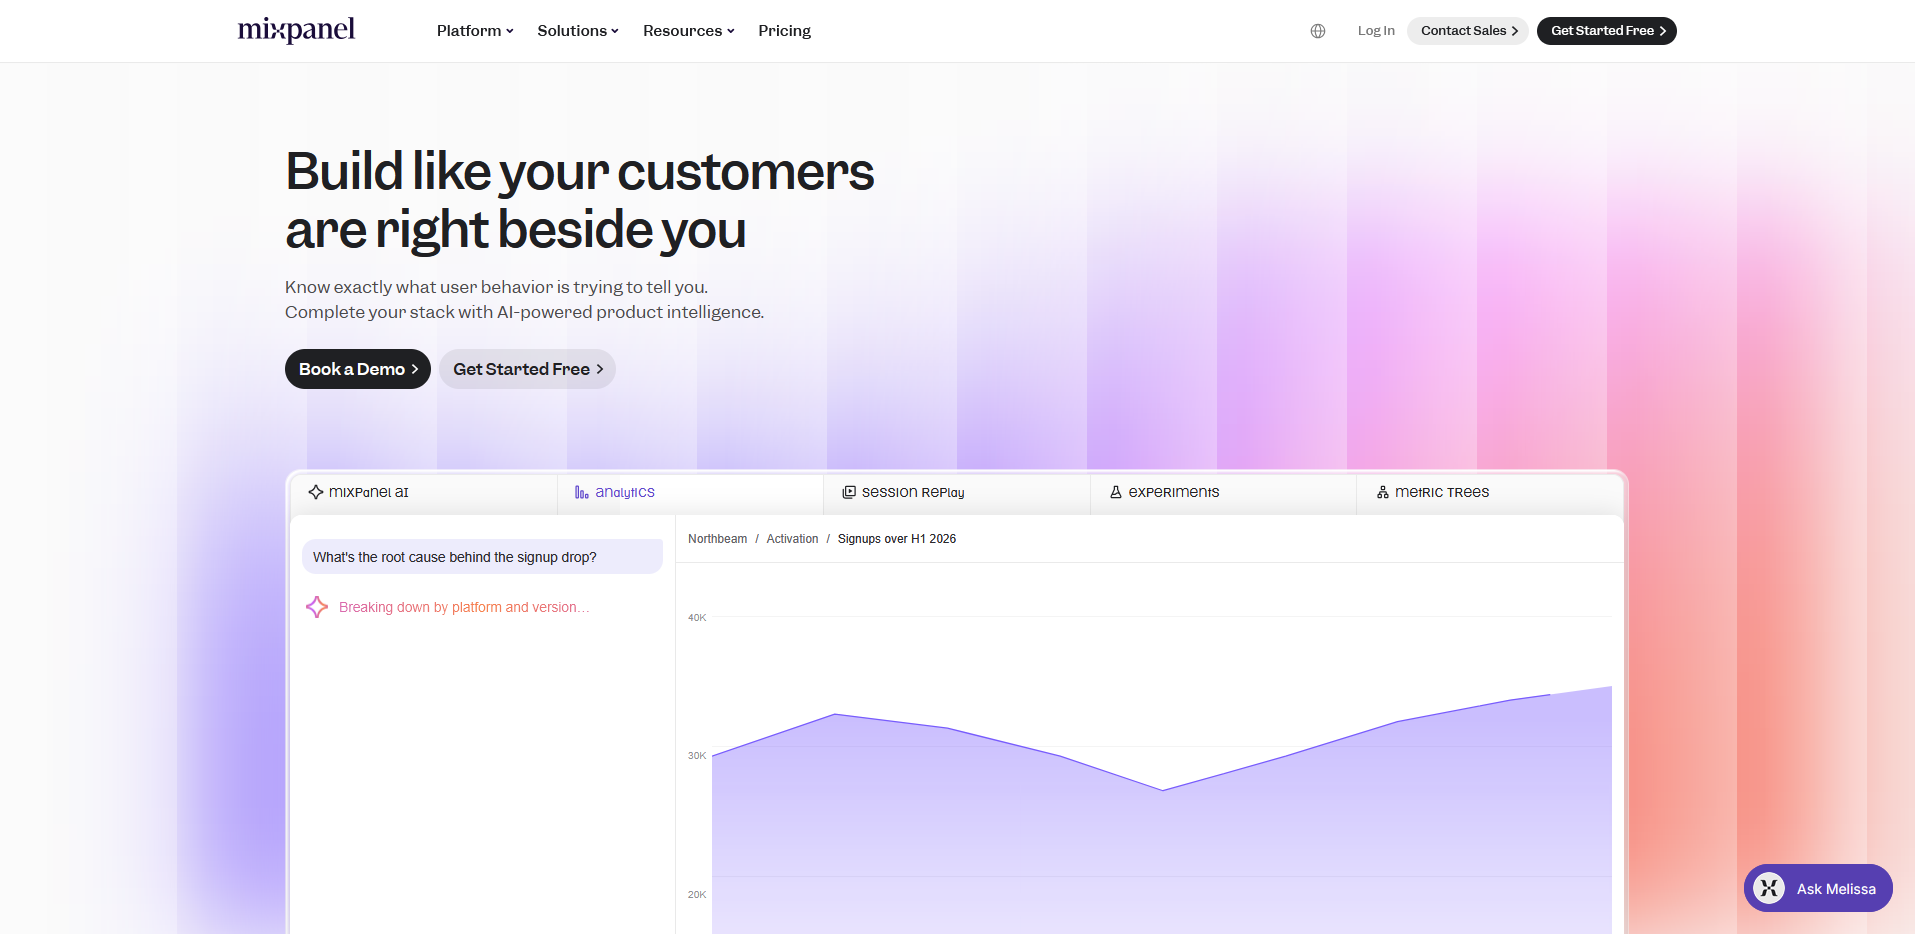
- What it does: Mixpanel is a product analytics platform where you track user events across a site or app and turn them into funnels, retention curves, and behavioral cohorts.
- Best for: Growth and marketing teams that want to see where users leave between the ad click and the conversion
I loaded a sample product funnel into Mixpanel to see where users stalled between the ad click and the conversion. The drop-off report pointed to the one step where most visitors left, and I could split it by campaign to see which sources sent visitors who came back or went on to convert.
The report was only as good as my setup, because the funnel worked after I decided which events to track and named them consistently.
Key features
- Funnels and retention: See where users drop off and how many return over time.
- Behavioral cohorts: Group users by what they did and compare how each group converts.
- Mixpanel Agent: Ask questions in natural language and get a report built from your event data.
Pros and cons
| ✅ Pros | ❌ Cons |
| Funnel steps can be filtered by device, channel, or campaign, so one broken step is easy to isolate | Marketers who only report on campaign-level results may use little of what it offers |
| Cohorts can compare campaigns by what users do after the click, such as returning in week two | Ad spend and revenue data from other platforms may need to be imported before ROI questions can be answered |
| Retention curves show whether users come back after converting, which extends analysis past the first purchase |
What users say
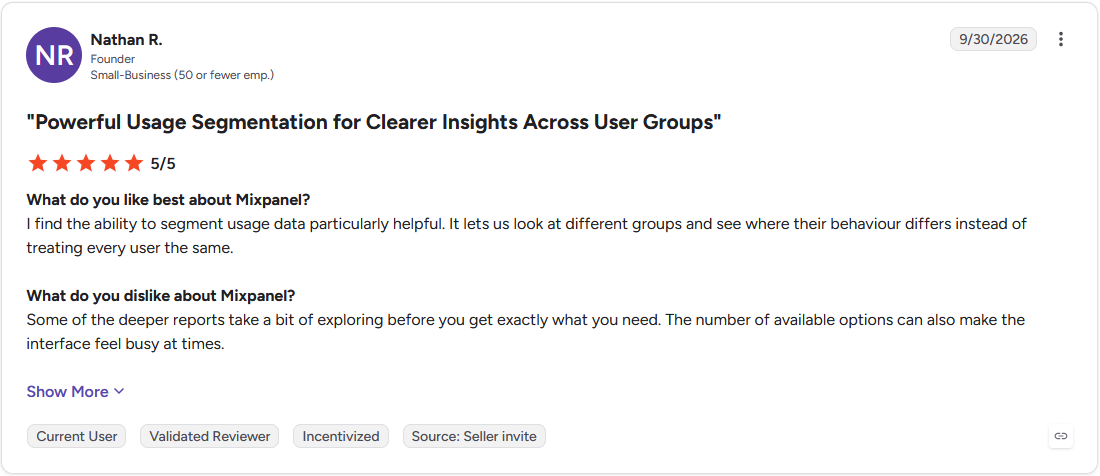
Pro: "I find the ability to segment usage data particularly helpful." (Nathan R., G2)
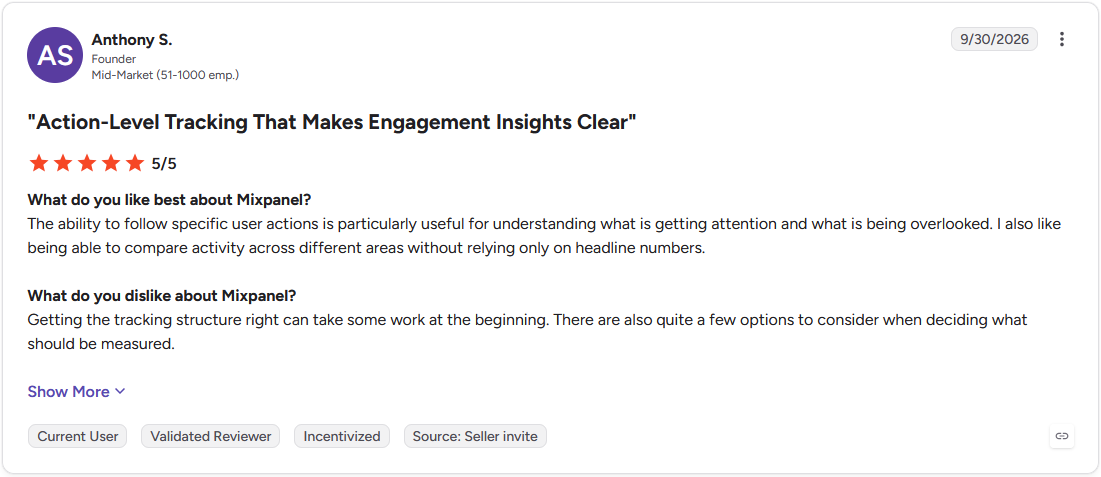
Con: "Getting the tracking structure right can take some work at the beginning." (Anthony S., G2)
Pricing
Mixpanel offers custom pricing.
Bottom line
Mixpanel lets you pin saved reports to a board so your whole team can follow the same funnel. If session replay and behavioral data are your main need, Fullstory is built around both.
10. Fullstory: Best for seeing why visitors leave
- What it does: Fullstory is a digital experience analytics platform where you watch recorded user sessions and measure behavior with heatmaps and funnels.
- Best for: Marketing and conversion teams diagnosing why visitors drop off a page or funnel
I went through a Fullstory demo to see how session replays explain a drop-off after a funnel report shows where people left. In the sample sessions, I watched one visitor tap a form field that wouldn't take input and another miss a button that sat below the fold on mobile.
The demo data was tidy, so I expect a busy site to take more patience, since I'd have to filter through plenty of unrelated recordings to find the useful ones.
Key features
- Session replay: Watch recorded user sessions to see where visitors hesitate, click repeatedly, or leave.
- Heatmaps and click maps: View where attention and clicks land on a page.
- AI session summaries: Read a written recap of session trends without opening every recording.
Pros and cons
| ✅ Pros | ❌ Cons |
| Repeated clicks on one element can point to a frustrating spot that a funnel chart never shows | Setup and tagging take upfront work before the reports become reliable |
| A replay can be shared with a developer so they see exactly what the visitor did | Teams that only need conversion numbers may use little of the replay depth |
| Heatmaps sit beside replays, so a click pattern can be checked against real sessions |
What users say
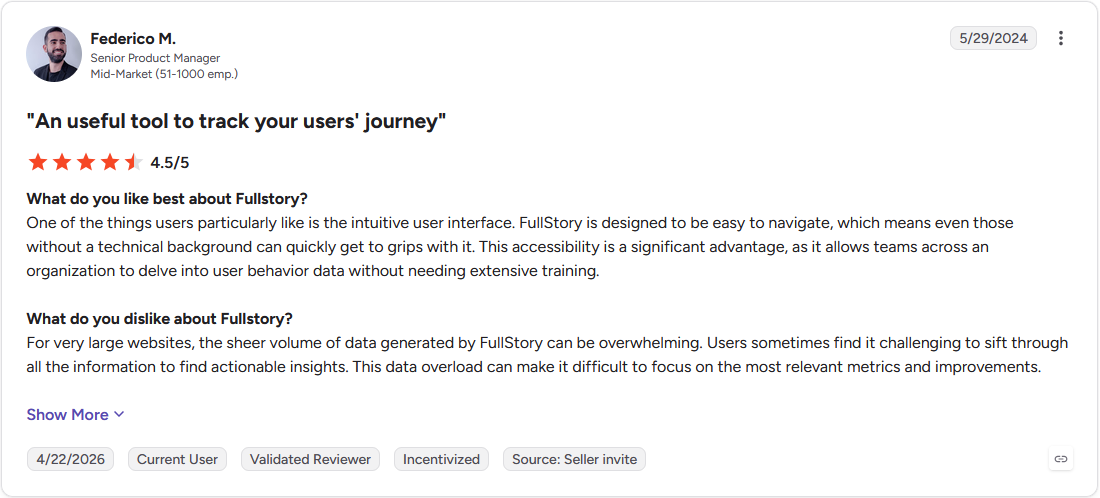
Pro: "FullStory is designed to be easy to navigate, which means even those without a technical background can quickly get to grips with it." (Federico M., G2)
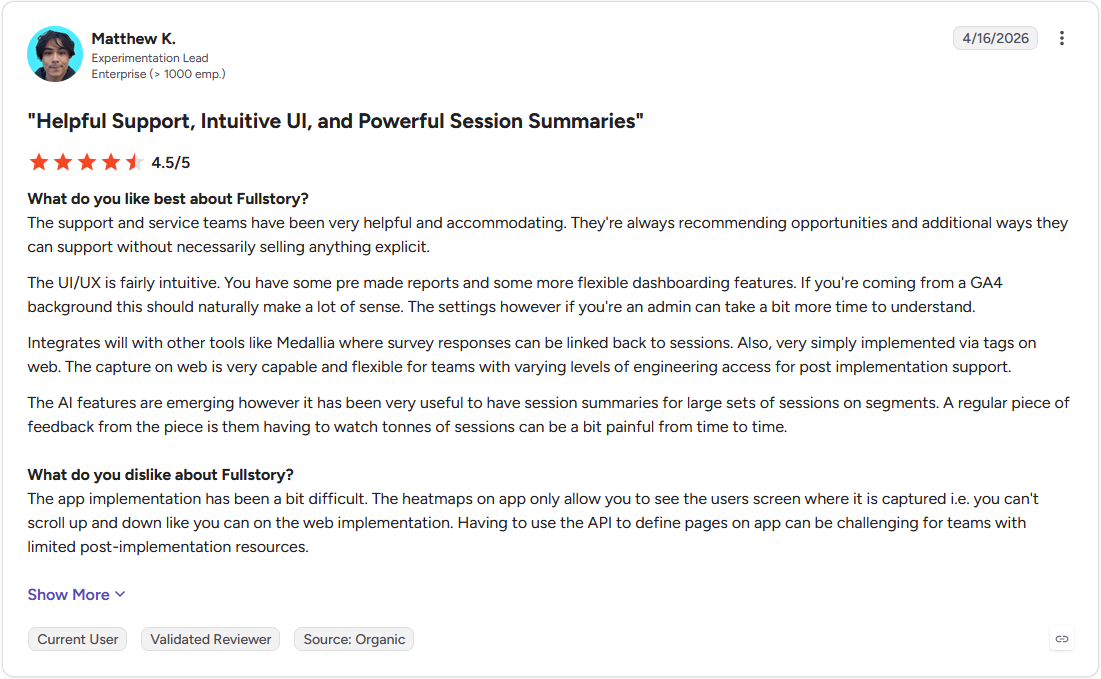
Con: "The app implementation has been a bit difficult. ... Having to use the API to define pages on app can be challenging for teams with limited post-implementation resources." (Matthew K., G2)
Pricing
Fullstory offers custom pricing.
Bottom line
Fullstory lets you search sessions by behavior, such as repeated clicks on a single element. If you only need the numbers without the video, Mixpanel could cover the analytics side.
CRM and predictive analytics
11. HubSpot Marketing Hub: Best for campaign reporting inside a CRM
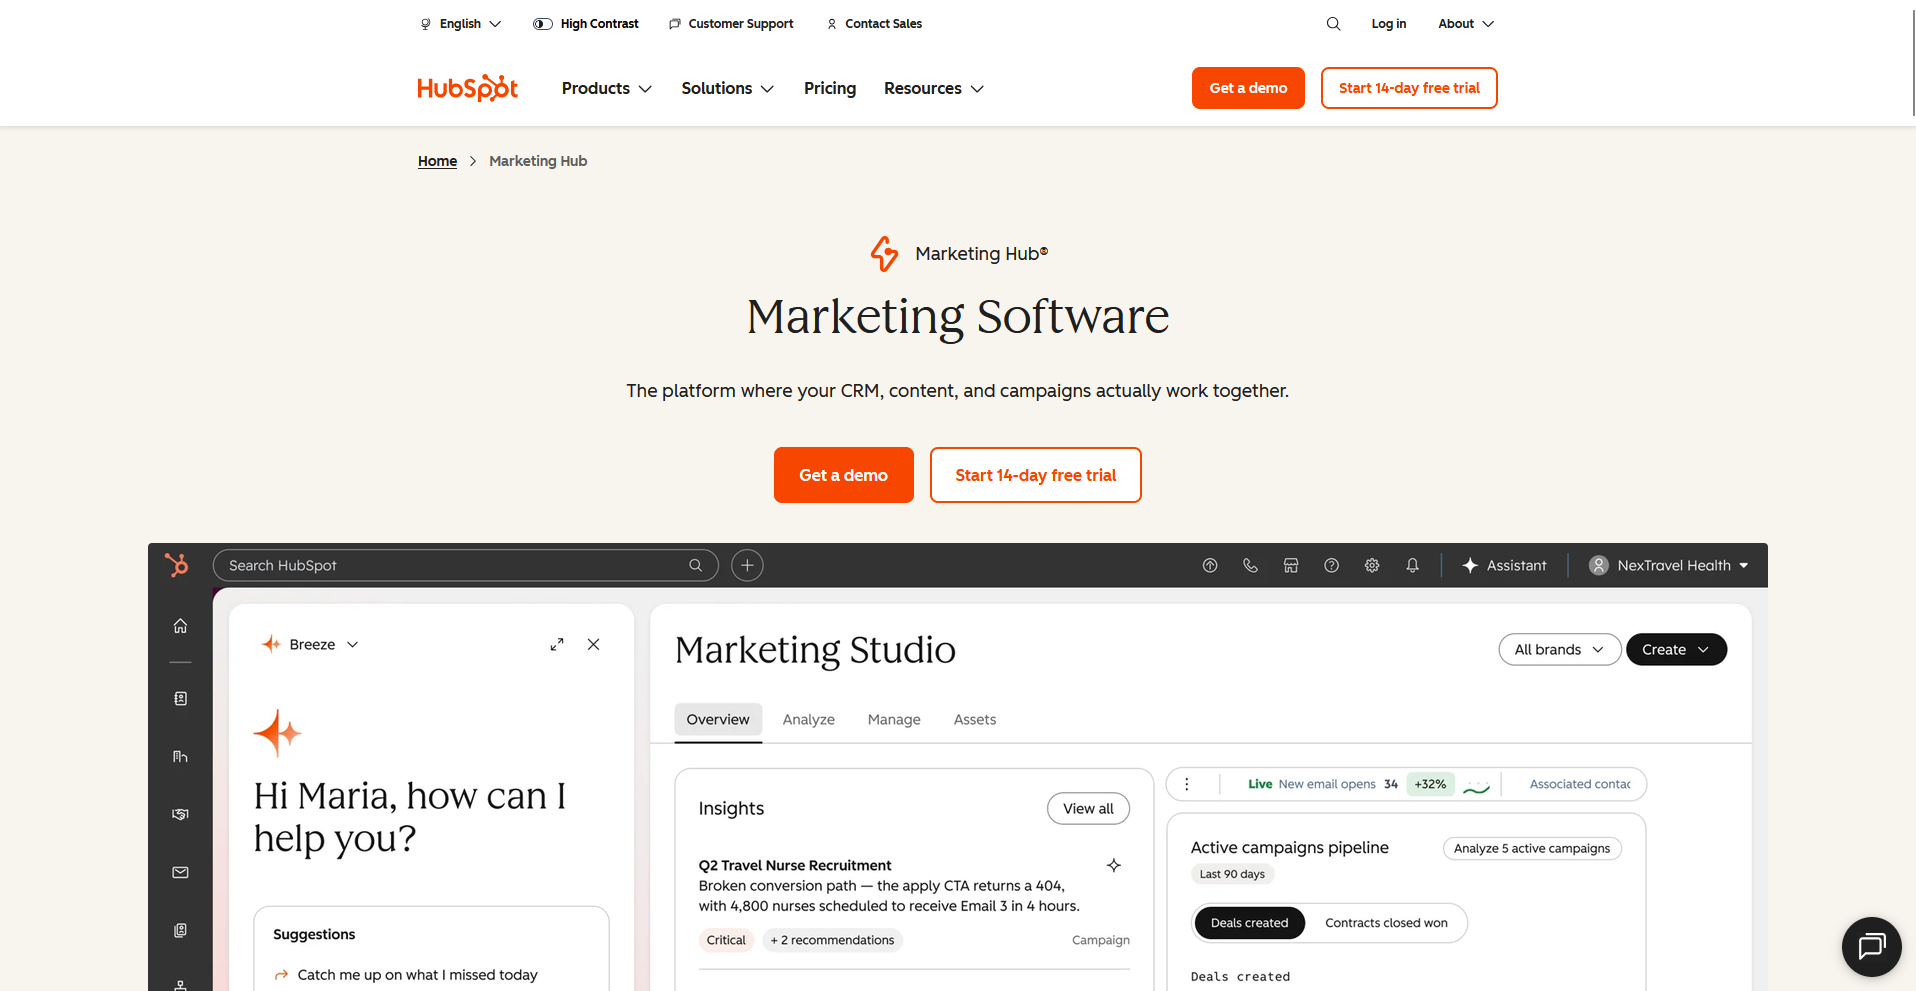
- What it does: HubSpot Marketing Hub is a marketing automation and analytics platform where you run campaigns, report on results, and tie them to CRM contacts.
- Best for: Marketers who want campaign analytics in the same place as their contact data
HubSpot Marketing Hub sits on top of a CRM, so I tested it by running campaign reports on a live marketing database to see whether results traced back to real contacts. Each campaign linked to the leads it brought in, and I could follow a contact from first click through the sales pipeline.
The AI lead scoring I was curious about needs Marketing Hub Enterprise, so it stayed out of reach on a lower plan.
Key features
- Campaign analytics: Report on campaign results alongside the contacts and deals they influenced.
- Customer journey analytics: Map the path from first touch to closed deal.
- Predictive lead scoring: Rank contacts by how likely they are to convert, available on Marketing Hub Enterprise.
Pros and cons
| ✅ Pros | ❌ Cons |
| Campaign results link to individual contacts, so you can see exactly which leads a campaign produced | Predictive lead scoring with AI requires Marketing Hub Enterprise |
| Many integrations let campaign data reach the tools your team already uses | Full value shows up once your team works inside the HubSpot ecosystem |
| The interface is approachable for teams new to CRM reporting |
What users say
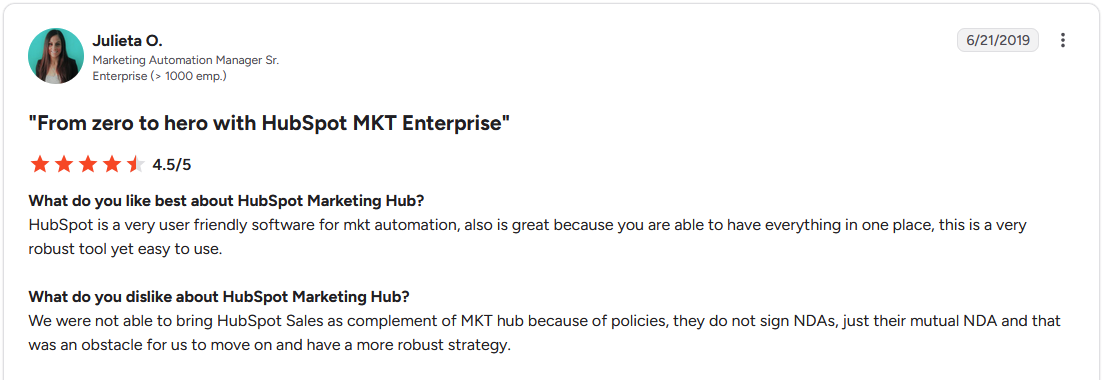
Pro: "HubSpot is a very user friendly software for mkt automation, also is great because you are able to have everything in one place, this is a very robust tool yet easy to use." (Julieta O., G2)
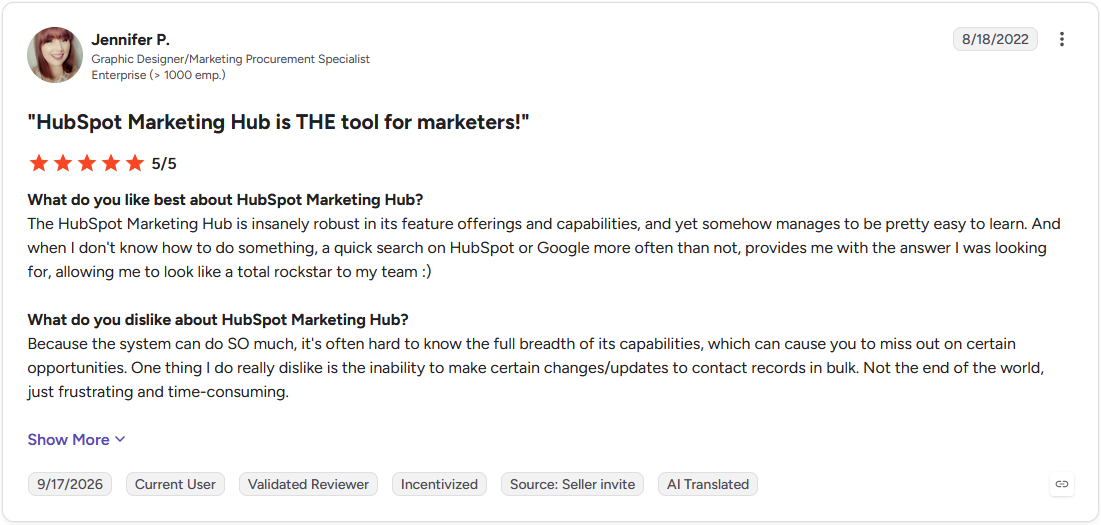
Con: "One thing I do really dislike is the inability to make certain changes/updates to contact records in bulk." (Jennifer P., G2)
Pricing
HubSpot Marketing Hub starts at $7 per user per month.
Bottom line
HubSpot connects with a long list of other apps, so campaign data can reach the tools your team already uses. If you need churn and lifetime value predictions across a large customer base, Optimove could be worth checking out.
12. Optimove: Best for churn and lifetime value forecasting
- What it does: Optimove is a customer marketing platform where you use predictive models to forecast churn and lifetime value and group customers into segments for campaigns.
- Best for: Mid-size to large brands with big customer databases that want to spot churn risk before customers leave
To see how Optimove turns customer data into predictions, I went through its documentation and a product walkthrough. The walkthrough showed a customer model built from first-party data, on-site activity, and past campaign responses, then used to score each customer's churn risk and expected lifetime value.
Those scores only carry weight with a large base of customer records, so a small team with limited data would likely get little from them.
Key features
- Predictive customer modeling: Score customers on churn risk, lifetime value, and likelihood to convert.
- Customer segmentation: Group customers into micro-segments based on behavior and predicted value.
- Campaign orchestration: Build multichannel campaigns for each segment from the same platform.
Pros and cons
| ✅ Pros | ❌ Cons |
| Each model is built from the brand's own customer data, so scores reflect that business's customers | Predictions need a large volume of customer data before they become useful |
| Segments and predictions live in the same platform, so a churn-risk group can go straight into a campaign | The platform leans toward campaign orchestration, so marketers who only want analysis may use few of its other tools |
| Lifecycle programs such as welcome, win-back, and re-engagement can be built around predicted behavior |
What users say
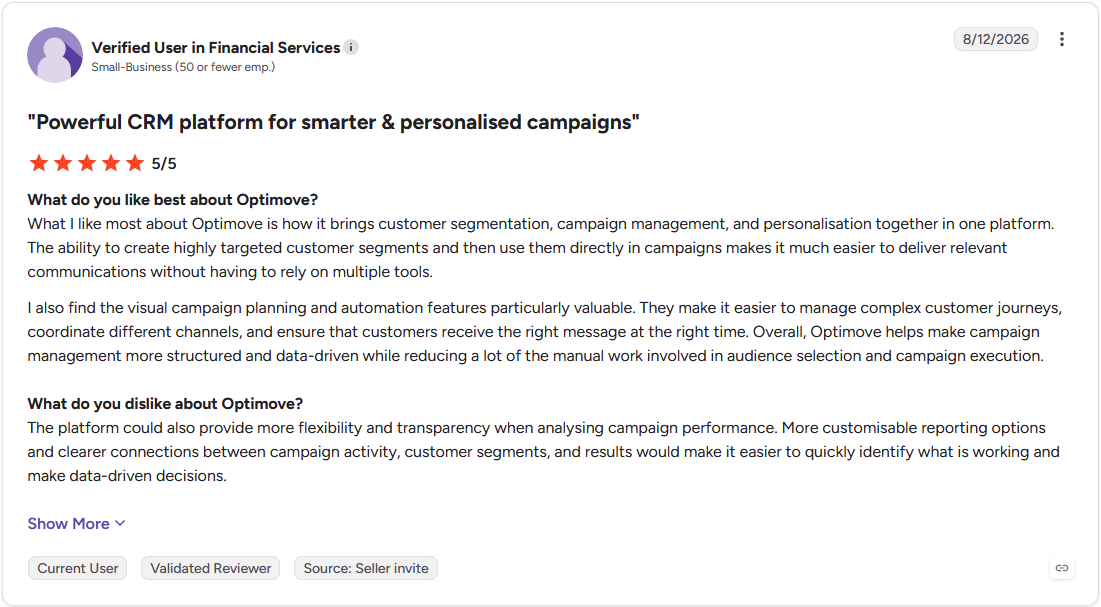
Pro: "The ability to create highly targeted customer segments and then use them directly in campaigns makes it much easier to deliver relevant communications without having to rely on multiple tools." (Verified User in Financial Services, G2)
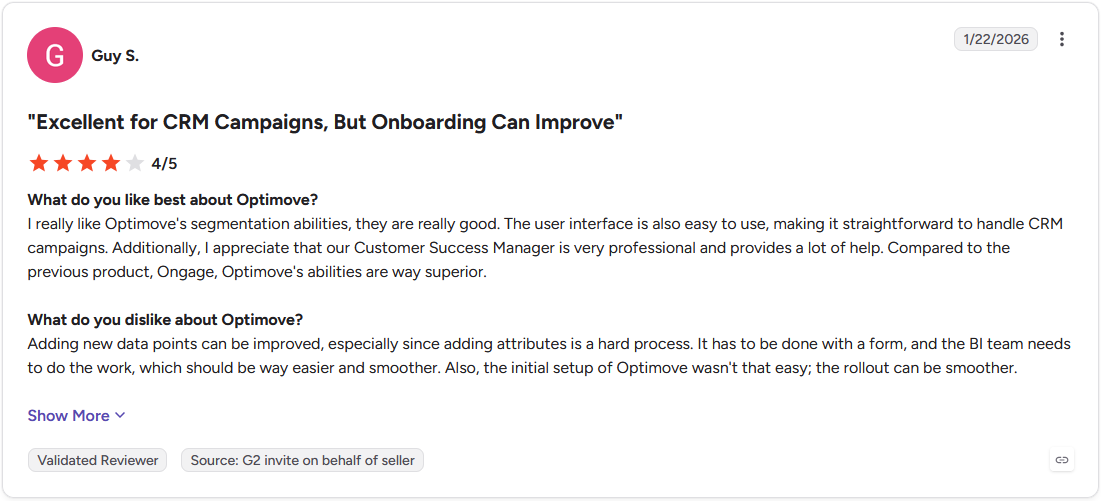
Con: "Adding new data points can be improved, especially since adding attributes is a hard process. It has to be done with a form, and the BI team needs to do the work, which should be way easier and smoother." (Guy S., G2)
Pricing
Optimove offers custom pricing.
Bottom line
Optimove offers an AI Decisioning Studio, launched at Optimove Connect 2026, where you can review active campaign agents and their results. If your team needs campaign reporting tied to contact records at a smaller scale, HubSpot Marketing Hub is worth checking instead.
AI search visibility
13. Otterly AI: Best for brand mentions in AI answers
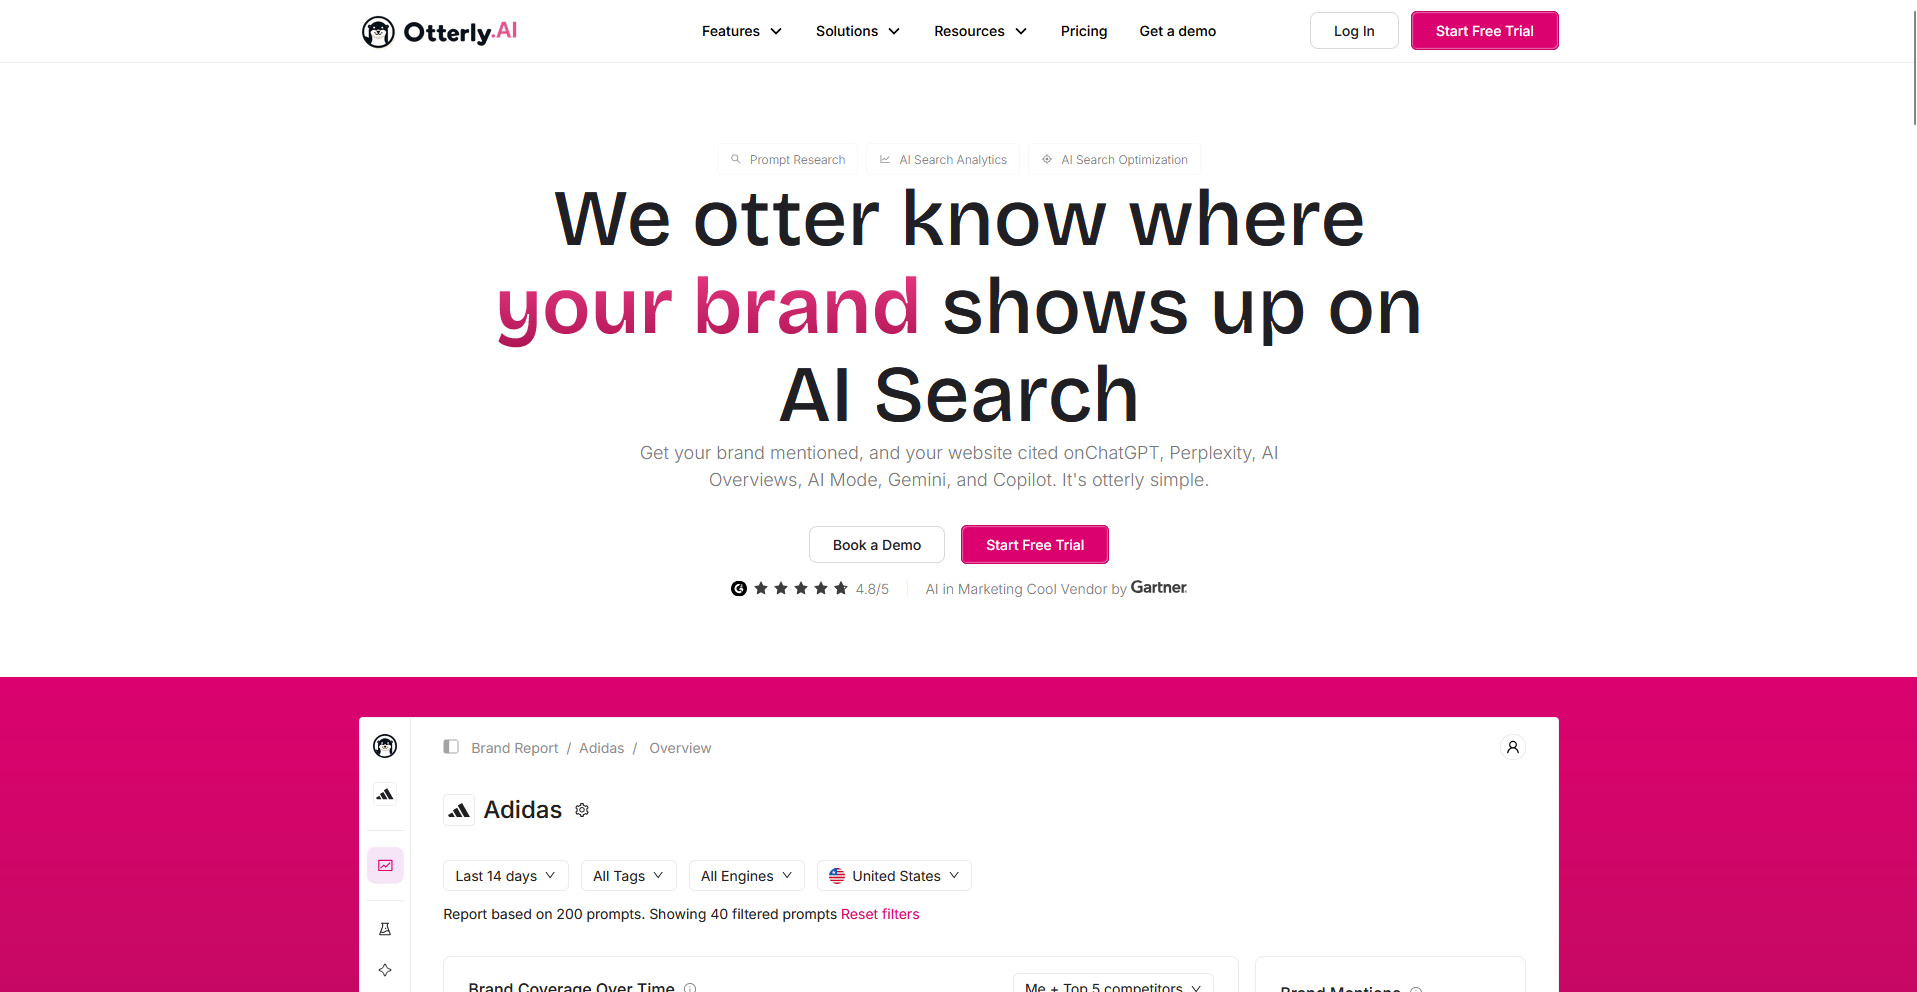
- What it does: Otterly AI is an AI search monitoring platform where you track how often your brand appears in answers from ChatGPT, Google AI Overviews, Perplexity, and Microsoft Copilot.
- Best for: Marketers who want to measure how often AI engines mention and cite their brand
Otterly AI is built around tracking brand mentions in AI answers, so I tested it by setting up a handful of prompts for a sample brand to see which engines named it and which named a competitor.
The citation list showed the pages each answer pulled from, so I knew which content to strengthen. Results shifted between checks, so I treated one day's report as a snapshot and watched the trend over a week.
Key features
- Multi-engine tracking: Monitor brand mentions across ChatGPT, Google AI Overviews, Perplexity, and Microsoft Copilot.
- Citation analysis: See which websites and pages AI answers cite for each prompt.
- GEO audits: Check how well your pages are set up to be cited by AI engines.
Pros and cons
| ✅ Pros | ❌ Cons |
| Visibility metrics such as share of voice let you compare your brand against competitors over time | It is a single-purpose tool, so it adds another subscription alongside your SEO suite |
| A prompt research tool suggests the questions your audience may be asking AI engines | Tracking covers only the prompts you set up, so mentions for questions you didn't think of go unseen |
| Citation data points to specific pages, so content teams get a concrete list of what to strengthen |
What users say
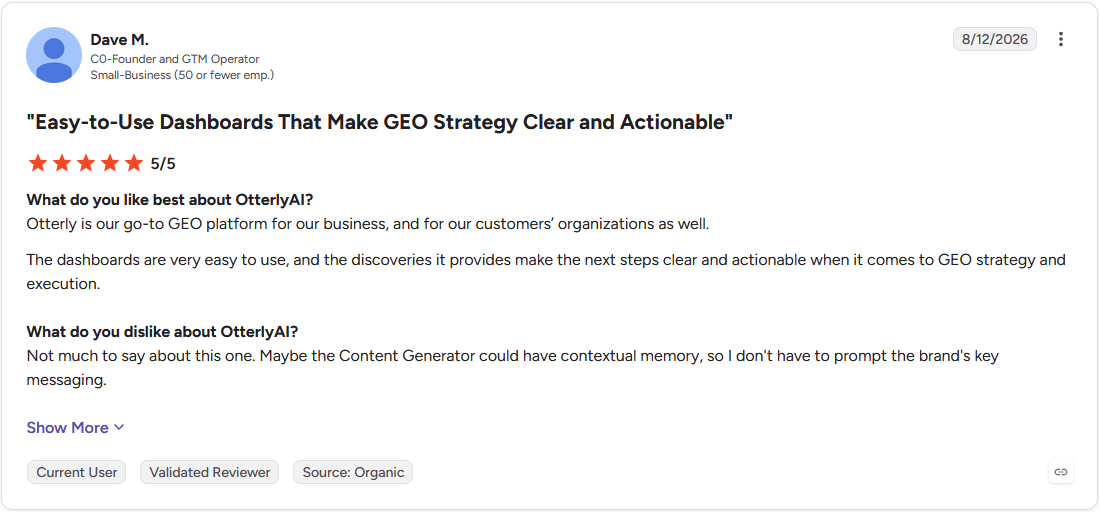
Pro: "The dashboards are very easy to use, and the discoveries it provides make the next steps clear and actionable when it comes to GEO strategy and execution." (Dave M., G2)
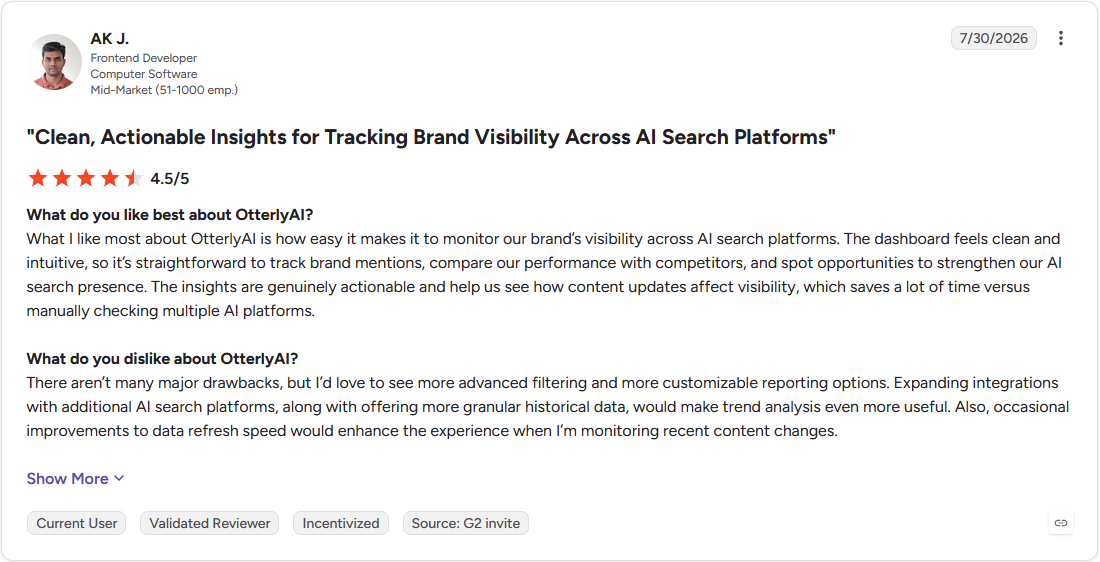
Con: "I'd love to see more advanced filtering and more customizable reporting options." (AK J., G2)
Pricing
Otterly AI starts at $25 per month.
Bottom line
Otterly AI offers workspaces for managing several brands or clients under one subscription. If you want AI visibility tracking alongside keyword research in one account, Semrush could be worth a look.
General AI assistants for data
14. ChatGPT: Best for one-off questions on uploaded exports
- What it does: ChatGPT is a general-purpose AI assistant where you upload files and ask questions to get summaries, charts, and data analysis.
- Best for: Marketers who want a quick read on a single campaign export without setting up a dedicated tool
I've used ChatGPT for quick campaign checks for years, so when an ad export lands in my inbox, I often drop the CSV into a chat and ask what changed. I usually get a summary, a chart, and a few flagged anomalies back, and follow-up questions pick up where the last answer ended.
The weekly report is where it gets repetitive, since I upload a new file each time, and I'd need to set up a saved project to avoid re-explaining my setup.
Key features
- File-based analysis: Upload a spreadsheet and ask questions about it directly.
- Chart generation: Request quick data visualizations built from your data.
- Deep research: Gather broader context on a market or competitor in the same conversation.
Pros and cons
| ✅ Pros | ❌ Cons |
| A campaign export can go in as it came from the ad platform, with no reformatting first | ChatGPT doesn't connect directly to ad platforms, so you still need to export your campaign data and bring it in each time |
| Follow-up questions refine a chart or summary without starting over | File size and usage limits on lower plans can slow work on bigger datasets |
| Written summaries turn a spreadsheet into something a teammate can read quickly |
What users say
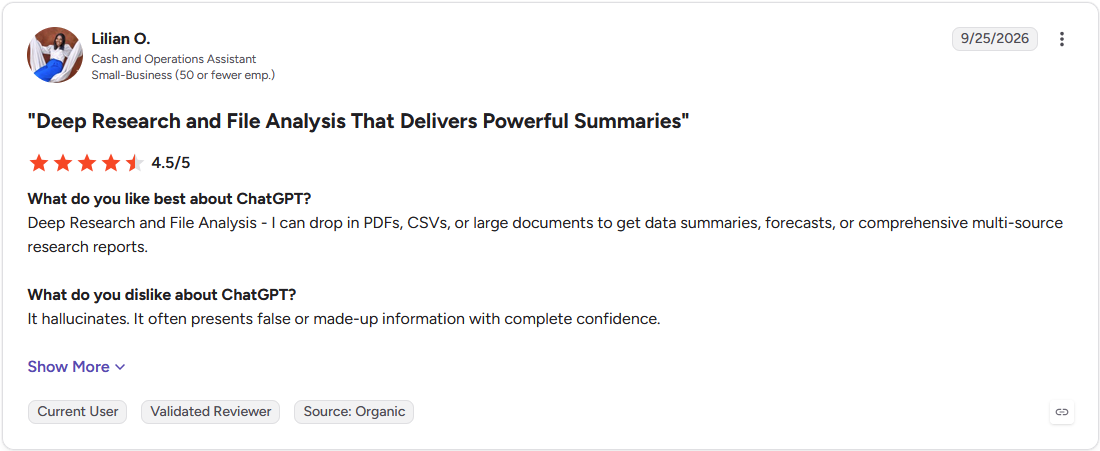
Pro: "Deep Research and File Analysis - I can drop in PDFs, CSVs, or large documents to get data summaries, forecasts, or comprehensive multi-source research reports." (Lilian O., G2)
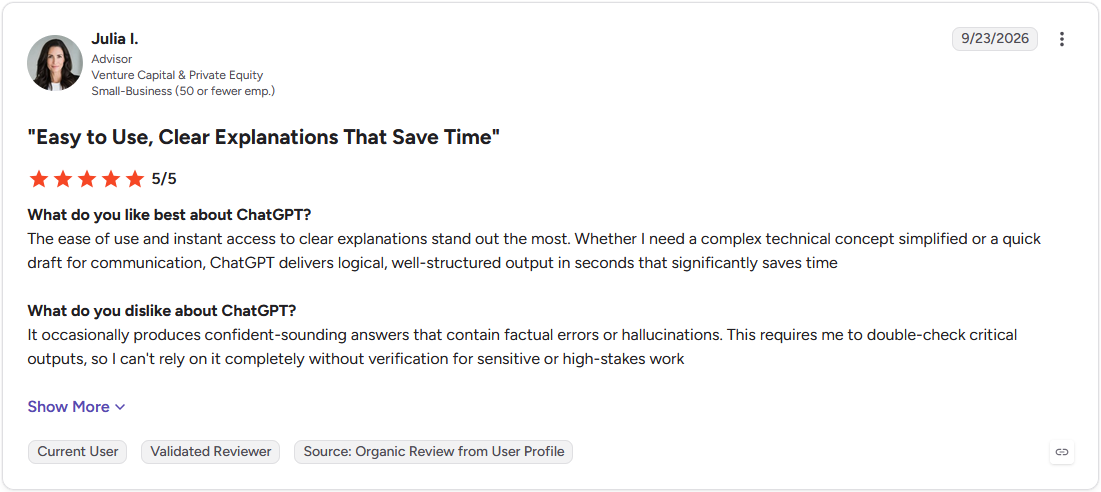
Con: "It occasionally produces confident-sounding answers that contain factual errors or hallucinations. This requires me to double-check critical outputs, so I can't rely on it completely without verification for sensitive or high-stakes work." (Julia I., G2)
Pricing
ChatGPT starts at $8 per month, billed monthly.
Bottom line
ChatGPT can run code on an uploaded file to calculate figures before it writes the summary. If you analyze the same data every week, Julius might save you from re-uploading the file each time.
15. Claude: Best for explained reasoning on uploaded datasets

- What it does: Claude is a general-purpose AI assistant where you upload files and get reasoned analysis, calculations run in code, and small interactive outputs.
- Best for: Marketers who want the logic behind an analysis spelled out before they act on it
I use Claude regularly when I want to understand a campaign export before I report on it, so I'll often ask it to explain how it reached each number. It usually lays out its steps in order, which lets me check where a figure came from, and it can build a small interactive view of the results when I ask.
The downside is usage limits, since long sessions with large files can hit them and I end up splitting the work across shorter chats.
Key features
- Reasoned analysis: Work through a dataset with step-by-step explanations of each calculation.
- Large context window: Analyze big files or several files in one conversation.
- Code execution and Artifacts: Run calculations on uploaded data and build small interactive outputs.
Pros and cons
| ✅ Pros | ❌ Cons |
| Step-by-step explanations let you check a figure before it goes into a report | It works as an assistant, so scheduled weekly dashboards call for a separate reporting tool |
| Several exports can go into one conversation, so related campaigns can be compared together | Heavy use of large files can reach usage limits on lower plans |
| A small interactive view can turn a spreadsheet into something a stakeholder can click through |
What users say
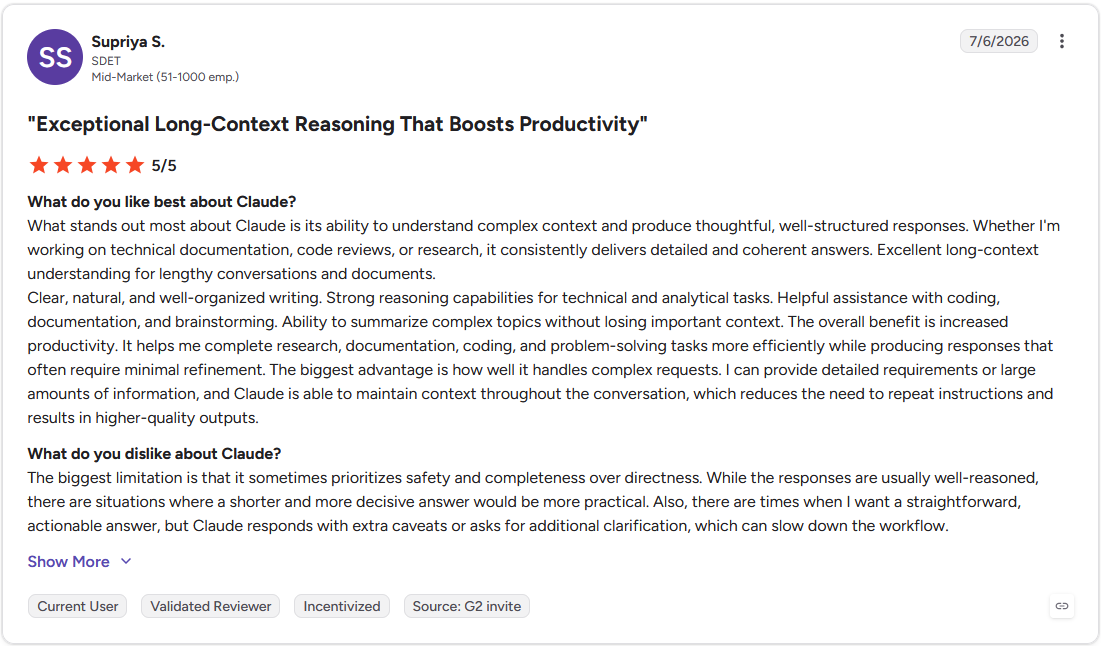
Pro: "I can provide detailed requirements or large amounts of information, and Claude is able to maintain context throughout the conversation, which reduces the need to repeat instructions and results in higher-quality outputs." (Supriya S., G2)
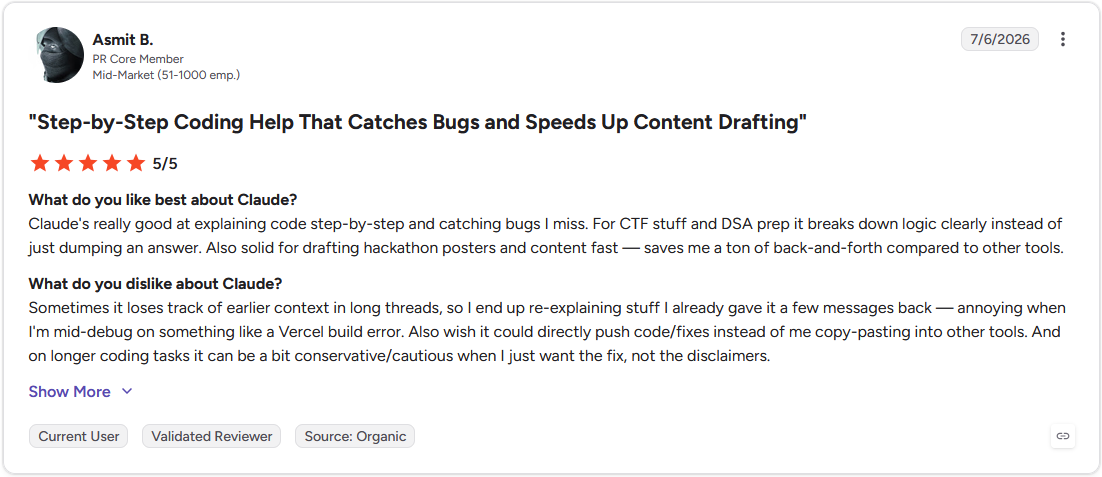
Con: "Sometimes it loses track of earlier context in long threads, so I end up re-explaining stuff I already gave it a few messages back." (Asmit B., G2)
Pricing
Claude starts at $17 per month.
Bottom line
Claude has Projects that keep uploaded files and standing instructions in one place, so repeat analyses start with context already loaded. If you want connected KPI dashboards that update on their own, Databox might serve you better.
Which AI tool is best for analyzing marketing data?
The right pick depends on the data you start with and the question you need answered, whether that's competitor rankings, visitor behavior, customer predictions, or a weekly client report.
Choose Julius if you:
- Want to ask questions of your marketing data in plain English and get charts back
- Start with a question and no file, and want Julius to search public data for you
- Need to turn a finished analysis into a report or presentation for stakeholders
Choose Whatagraph if you:
- Combine ad, social, and analytics data into one client report each week
- Want written summaries of performance changes as a starting point for your commentary
- Are comfortable adding campaign context to an AI summary before it reaches a client
Choose AgencyAnalytics if you:
- Manage a long roster of small clients that each need a separate branded dashboard
- Report on PPC, SEO, and social results in the same client view
- Want to track a client's brand visibility in AI answers through an add-on
Choose Adverity if you:
- Pull data from ad platforms, analytics tools, and CRMs and need it cleaned before any report
- Have a data team that can handle an enterprise-scale setup
- Want one standardized layer that feeds whichever dashboard tool you use afterward
Choose Databox if you:
- Lead a small team that wants KPI views without a long setup
- Want to ask an AI analyst how performance looks and get a dashboard with the answer
- Need shared metric definitions so everyone reads the same numbers
Choose Klipfolio if you:
- Want to define your own metrics, including scripted calculations
- Need a dashboard layout arranged around one stakeholder's questions
- Are comfortable writing formulas to define each metric before the first chart appears
Choose Semrush if you:
- Need to see which keywords your competitors rank for that you don't
- Want rank tracking by region and device in the same account as site audits
- Plan to check whether AI engines mention your brand alongside your keyword research
Choose Similarweb if you:
- Are sizing up a market and need traffic estimates for competitors you can't measure directly
- Want to see which channels send visitors to rivals and where audiences overlap
- Need to see which AI chatbots send referral traffic to a site
Choose Mixpanel if you:
- Need to find the funnel step that loses the most visitors
- Want to compare campaigns by what users do after the click
- Are ready to decide which events to track and name them consistently
Choose Fullstory if you:
- Already know where visitors drop off and need to see why
- Want to hand a developer a replay of what a visitor actually did
- Need written summaries of session trends across many recordings
Choose HubSpot Marketing Hub if you:
- Want campaign results tied to individual contacts and deals
- Already store your contacts in HubSpot and want reporting beside them
- Need to map a contact's path from first touch to closed deal
Choose Optimove if you:
- Manage a large customer database and want churn risk scores
- Need lifetime value predictions that feed straight into customer segments
- Build win-back and re-engagement programs around predicted behavior
Choose Otterly AI if you:
- Need to know whether ChatGPT, Google AI Overviews, and Perplexity mention your brand
- Want a list of the pages AI answers cite so you know which content to strengthen
- Track brand visibility across several AI engines for your own brand and competitors
Choose ChatGPT if you:
- Have one campaign export and want a quick read today
- Want follow-up questions that refine a chart or summary in the same chat
- Analyze data occasionally, so uploading a fresh file each time is a minor step
Choose Claude if you:
- Want each calculation explained so you can check a figure before reporting it
- Compare several related exports in one conversation
- Want a small interactive view of your results to share with a stakeholder
Skip this category entirely if:
- You track a handful of metrics for one small campaign that a spreadsheet already covers
- You need campaign execution, such as writing copy or building ads, since these tools focus on analysis
- You check results once a quarter, when a manual export and a pivot table take less time than learning a new tool
Start your marketing analysis with a question
The best AI-powered tools for marketing analysis each cover a different job, from competitor research and product behavior to CRM predictions and AI search visibility. If your question comes before your dataset, Julius gives you a way to start anyway. You describe what you want to know, and Julius helps you find the data, analyze it, and share the result.
Here’s how Julius can help:
- Start from a question: Ask about a market, a competitor, or a channel, and Julius can search the web for public data and compile it into a dataset you can analyze before you upload anything.
- Plain-English charts and reports: Type a question like which channel brought in the cheapest conversions last quarter, and Julius returns a chart or table you can turn into a report with the AI Report Generator or a deck with the AI Presentation Maker.
- Learning over time: As you query a connected database, the Learning Sub Agent picks up how it's organized, including table relationships and column meanings, so answers may get faster and more precise.
Whether you bring your own data or start with a question, you can try Julius for free today.
Frequently asked questions
Which AI tool is best for analyzing marketing data?
Some of the best AI tools for analyzing marketing data include Semrush for competitor and keyword analysis, Mixpanel for funnel behavior, HubSpot Marketing Hub for campaign reporting tied to contacts, and Julius for asking questions of your data in plain English. Your choice depends on the analysis job you need to run.
How is AI used in marketing analytics?
AI is used in marketing analytics to spot patterns in campaign data, flag unusual changes in spend or traffic, predict which leads may convert, and answer questions in plain English that once needed an analyst.
How do AI-powered marketing analysis tools compare to AI marketing automation tools?
AI-powered marketing analysis tools find insights in your campaign data, while AI marketing automation tools act on that data by running campaigns or adjusting budgets. The two work together because analysis shows you what's happening and automation handles the repetitive execution.
Do AI-powered marketing analysis tools count as product analytics tools?
Yes, tools like Mixpanel and Fullstory overlap with product analytics tools because they track how users interact with your site or app. That overlap lets you connect marketing performance to product engagement and spot where conversion paths break.
How do AI-powered marketing analysis tools use predictive analysis?
AI-powered marketing analysis tools use predictive analysis to forecast results from past campaign data. They can estimate which leads may convert, predict customer churn, or project revenue trends, so you can plan budgets around likely outcomes before results arrive.