

The best BI tools with strong analytics capabilities let you connect your data, ask business questions, and get clear visual output without building a pipeline first. I tested dozens of platforms to find the 11 worth your time in 2026.
11 Best BI tools with strong analytics capabilities: Quick comparison
| 💻 Tool | 🎯 Best for | 🔥 Starting price (billed annually) | ⚡ Strengths |
|---|---|---|---|
| Julius | Business users who want AI-driven analysis without writing code | $16/month | Natural language queries, data connectors, financial data search, scheduled reports, repeatable notebooks |
| Power BI | Teams already using Microsoft 365 | $14/user/month | Microsoft ecosystem integration, interactive dashboards, broad connector library |
| Tableau | Teams that need advanced data visualization | $15/user/month; A Creator license is also required at $75/user/month | Visual analytics depth, large community, flexible chart builder |
| Looker | Data teams that need governed, consistent metrics | Custom pricing | LookML modeling, Google Cloud integration, embedded analytics |
| ThoughtSpot | Business users who prefer search-based analytics | $25/user/month | AI-powered search, conversational queries, self-service insights |
| Sisense | Teams building analytics into their own products | $399/month, billed monthly | Embedded analytics, API flexibility, multi-source data blending |
| Domo | Executives who need live business dashboards | Usage-based pricing | Real-time data, prebuilt connectors, mobile-friendly dashboards |
| Qlik Sense | Analysts who need associative data exploration | $300/month, includes 10 users | Associative engine, data storytelling, strong governance tools |
| Sigma | Spreadsheet users moving into cloud analytics | Custom pricing | Spreadsheet-style interface, live cloud data, collaborative workbooks |
| Yellowfin | Teams that want automated insight delivery | Custom pricing | Automated narratives, collaborative dashboards, story-based reporting |
| Oracle Analytics | Enterprise teams in the Oracle ecosystem | $16/user/month, billed monthly (Cloud) | Oracle data integration, machine learning features, enterprise scalability |
How I researched and tested these BI tools
I put all 11 tools through the same core workflows, covering everything from connecting data sources and running queries to building dashboards and exporting results. Some tools I tested directly with sample datasets and mock business scenarios. For others, I worked through documentation, walkthroughs, and demo environments to get a clear picture of how they perform in practice.
Here's what I focused on:
Query accessibility: Whether you can ask business questions and get useful answers without needing SQL knowledge, a data team, or a lengthy setup process.
Analytics depth: How well each tool handles filtering, trend analysis, and cross-source comparisons without requiring heavy configuration.
Ease of connection: How straightforward it is to connect your data sources and start getting output.
Visualization quality: Whether the charts and dashboards are clear, flexible, and useful enough to share with stakeholders or present in a meeting.
What separated the stronger tools from the rest was whether a business user could get meaningful output without leaning on a data analyst for every step.
1. Julius: Best for business users who want AI-driven analysis without writing code
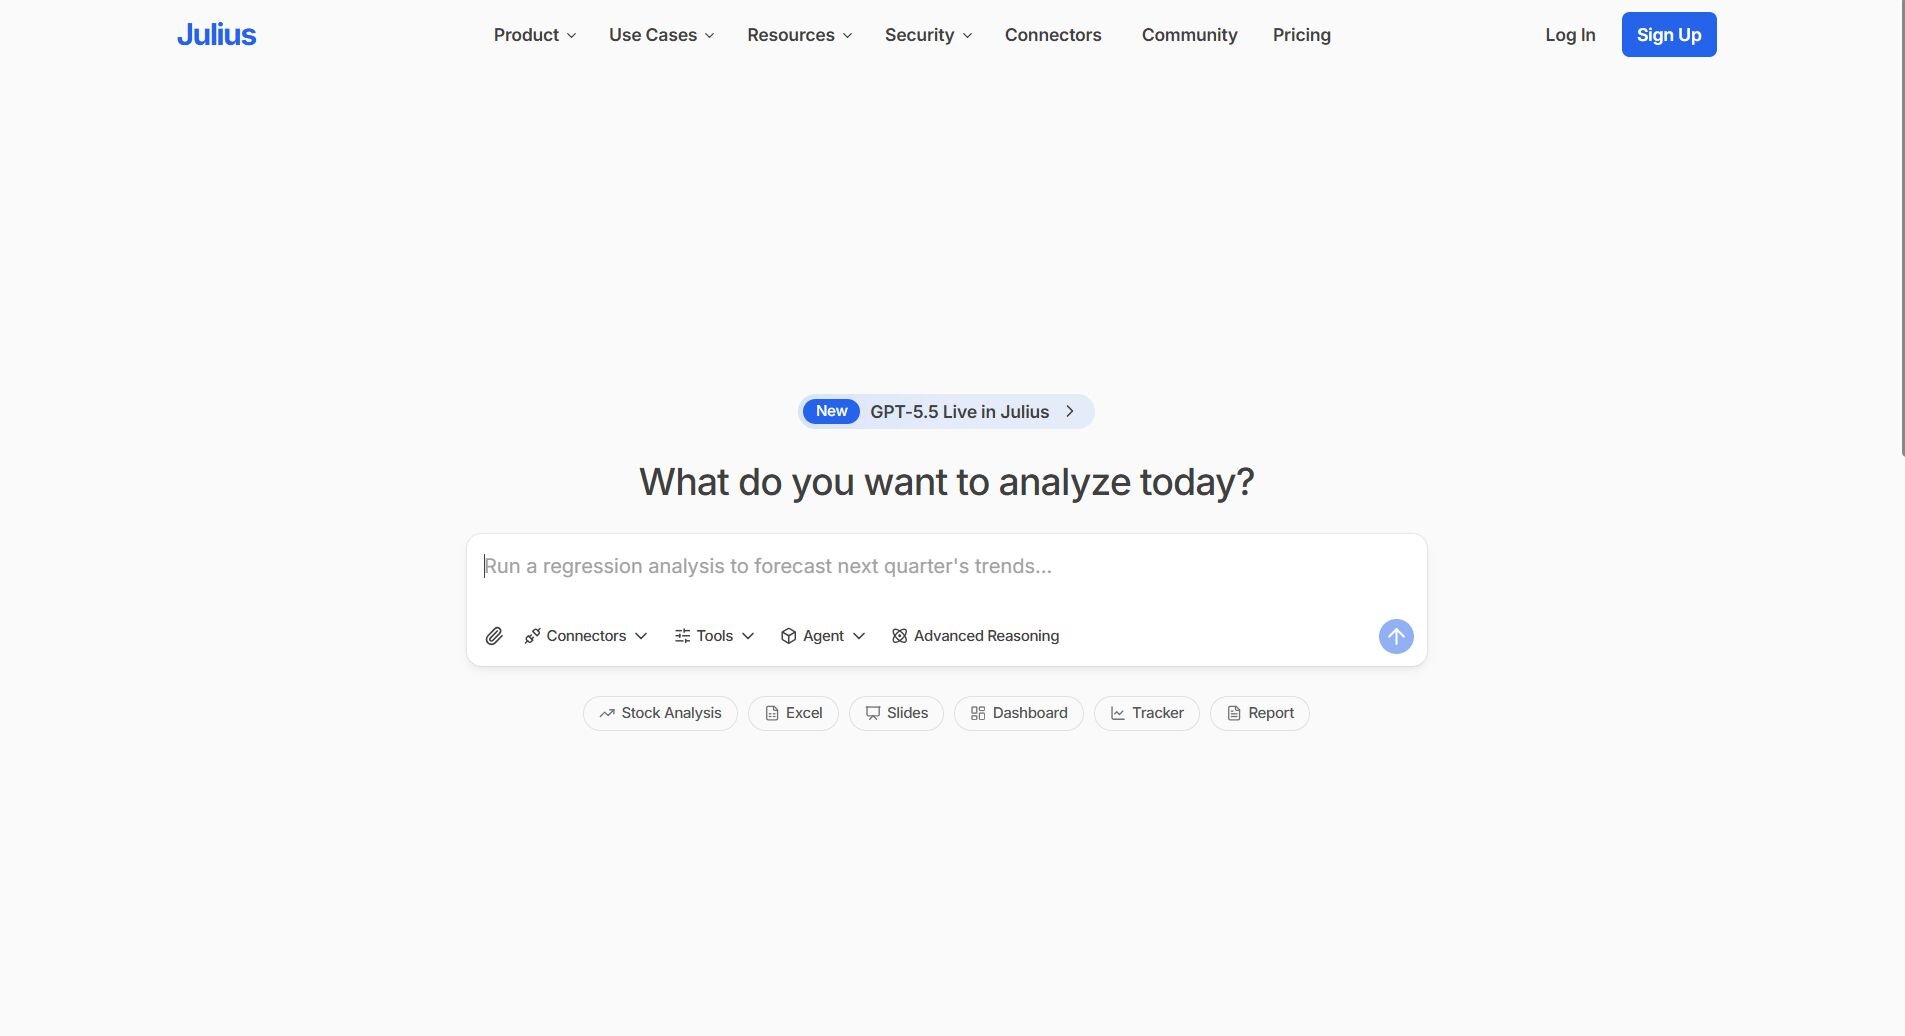
What it does: Julius is an AI-powered data analysis platform that lets you ask questions about your data in plain English and get charts, tables, and summaries back without writing code.
Best for: Business teams that want to connect live data sources, run repeatable analysis workflows, and get answers from their data without relying on a data analyst for every request.
We designed Julius for teams that want to move from a question to an answer without waiting on a data team. You can connect sources like Postgres, Snowflake, and BigQuery, ask in plain English, and get charts without writing code. Julius can also search for public data or pull company financials through the Financial Datasets integration, so you can start your analysis without a file ready.
Key features
Natural language queries: Ask questions about your data the way you'd ask a colleague and get a chart, table, or breakdown back without writing SQL or Python, so you can explore your data without technical help.
Data connectors: Connect to Postgres, Snowflake, BigQuery, Google Ads, and other sources so your analysis draws from live data rather than outdated exports.
Financial data search: Pull financial statements, price history, and key metrics for over 17,000 companies through the Financial Datasets integration, so you can research and compare peers without uploading a file.
Repeatable Notebooks: Save multi-step analysis workflows, schedule them, and get results delivered to email or Slack without rebuilding the report each time.
Scheduled report delivery: Send charts and summaries to Slack or email on a set schedule, so your team stays updated without logging in each time.
Pros and cons
| ✅ Pros | ❌ Cons |
|---|---|
| Ask questions in plain English and get charts or breakdowns back without writing SQL or building a dashboard first | Results can vary when column labels are abstract or data is sparse, so some queries may need rephrasing before you get a usable output |
| Financial Datasets integration gives you access to company-level financial data for over 17,000 companies without uploading files | Connected data sources require an active integration, so setup is needed before live data analysis can begin |
| Repeatable Notebooks let you schedule and deliver recurring reports without rebuilding them each time |
What users say
Pro: “After asking for a revenue trend chart, it prompted me with options like 'Compare by product category?' or 'Break down by region?' These suggestions saved me time and surfaced insights I might not have thought to ask for myself. It felt more like a collaborative process than a one-way query system.” - Fritz,fritz.ai (independent Julius review)
Con: “Misunderstands when column labels are too abstract … May hallucinate summary stats if data is too sparse or inconsistent … Doesn’t handle advanced statistical models.” - Fritz,fritz.ai (independent Julius review)
Pricing
| 💻 Pricing plans | 💰 Price billed annually | 💰 Price billed monthly |
|---|---|---|
| Free | $0 | $0 |
| Pro | $16/month | $20/month |
| Business | $33/month | $40/month |
| Growth | $375/month | $450/month |
Bottom line
Julius can reduce the back-and-forth between business questions and data answers, whether you're querying connected sources or searching for public and financial data directly in the platform. If your team already works inside Microsoft 365 and wants reporting built into that ecosystem, Power BI might be a better fit.
2. Power BI: Best for teams already using Microsoft 365
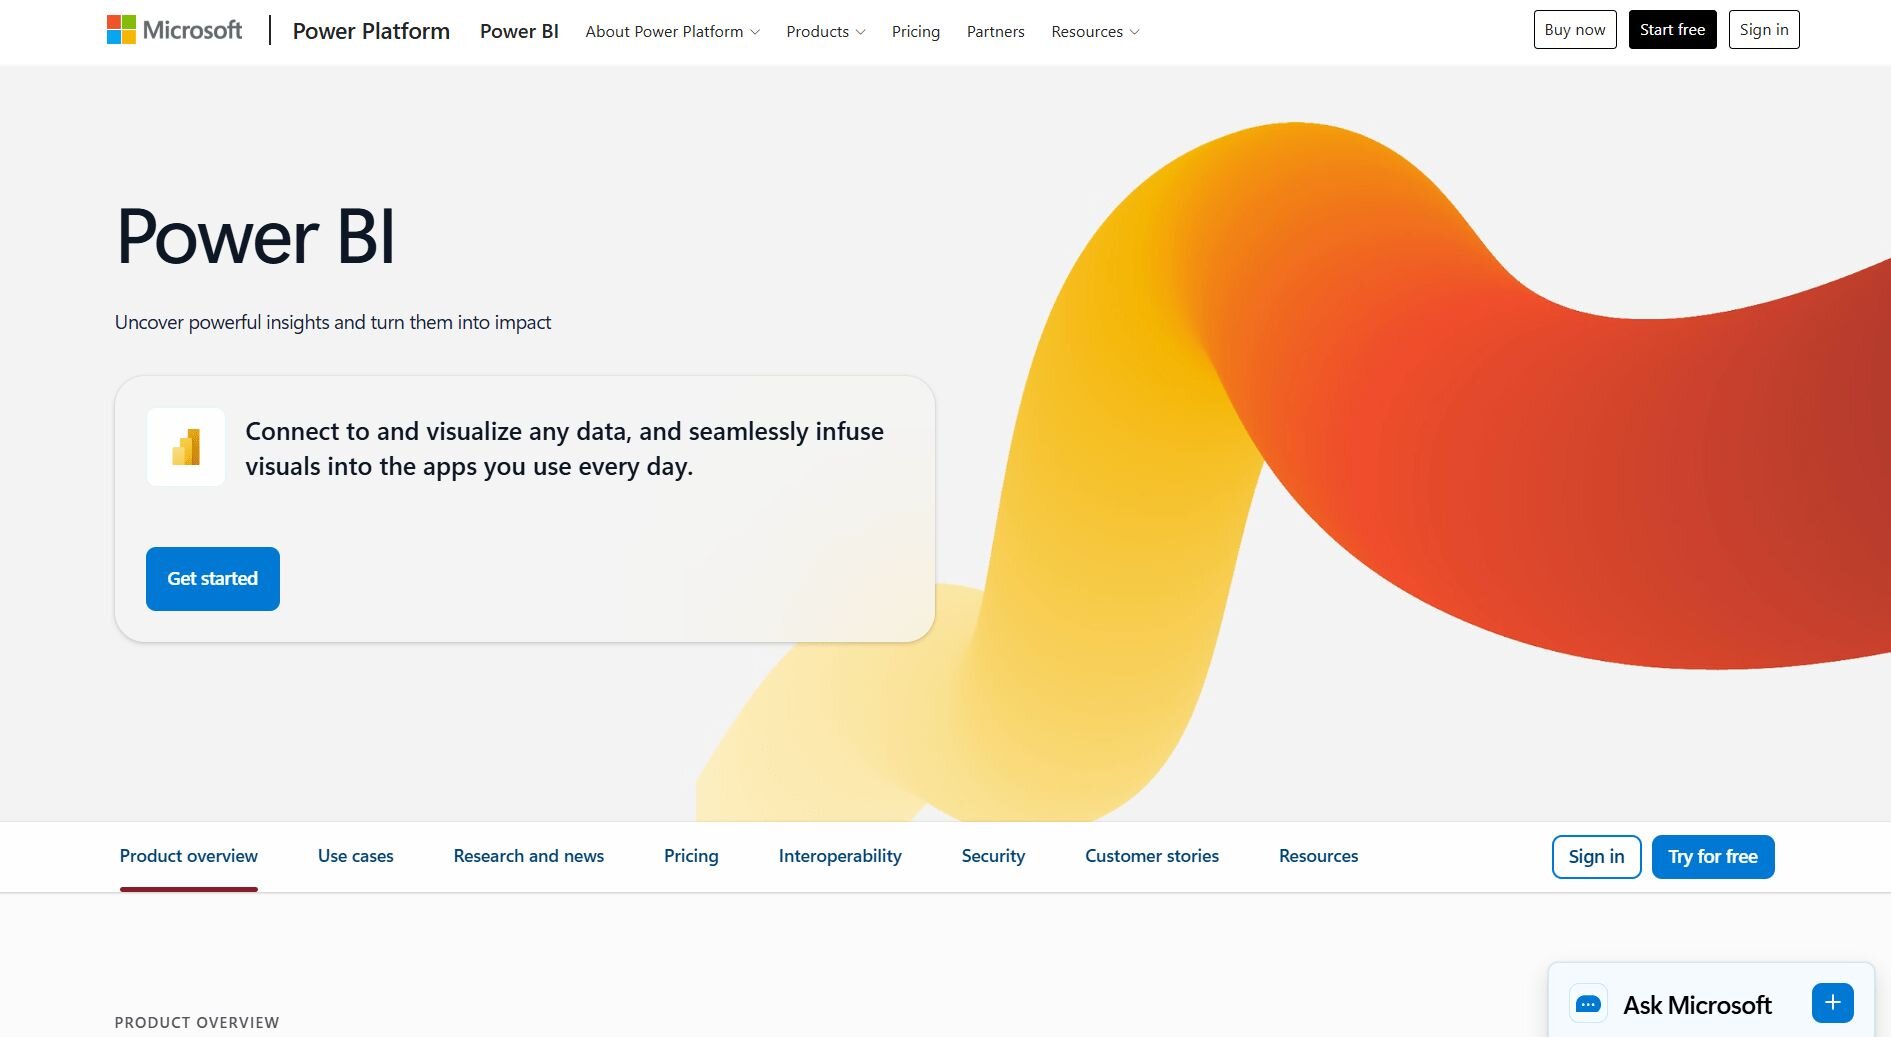
What it does: Power BI is a business intelligence platform that lets you build interactive dashboards and reports by connecting to data sources across the Microsoft ecosystem and beyond.
Best for: Teams that want to build structured, recurring reports and dashboards using data already sitting in Microsoft tools like Excel, Azure, or SharePoint.
I connected Power BI to a mock sales dataset in Excel and SharePoint to test how well it fits a Microsoft 365 workflow. Building dashboards was straightforward once the data model was in place. However, non-technical users may hit a learning curve writing DAX measures and understanding how filter context works before they can get meaningful output.
Key features
Data modeling: Define relationships between tables and build calculated columns using DAX formulas.
Power Query: Clean, reshape, and transform data from multiple sources before loading it into a report.
Interactive dashboards: Build reports with filters, slicers, and drill-through pages that update when the underlying data refreshes.
Pros and cons
| ✅ Pros | ❌ Cons |
|---|---|
| Connects directly to Microsoft 365 tools like Excel, SharePoint, and Azure without extra configuration | DAX formulas can take time to learn, and complex data models may require technical support to set up |
| Lets you build detailed, filterable dashboards that refresh automatically from connected data sources | Report layout and visual customization options can feel restrictive compared to dedicated visualization tools |
| Strong data modeling capabilities let you define relationships and calculated metrics across multiple tables |
What users say
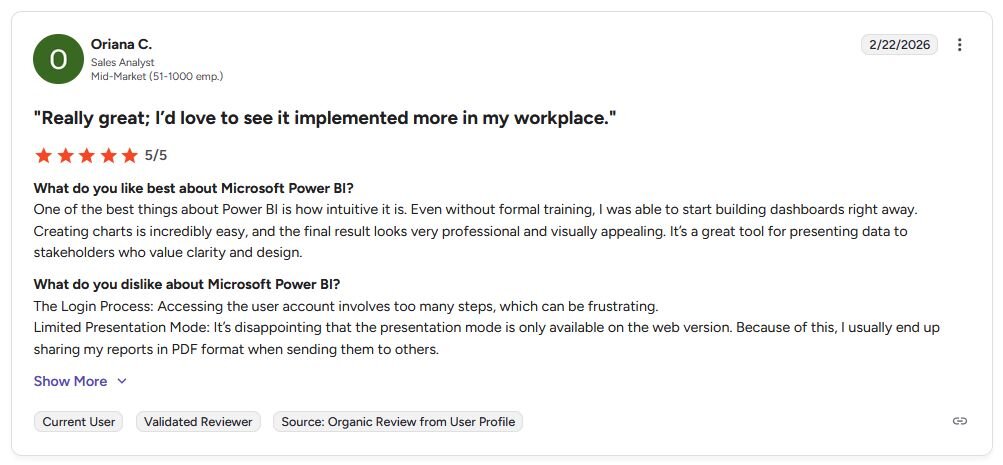
Pro: “One of the best things about Power BI is how intuitive it is. Even without formal training, I was able to start building dashboards right away.” - Oriana C., G2
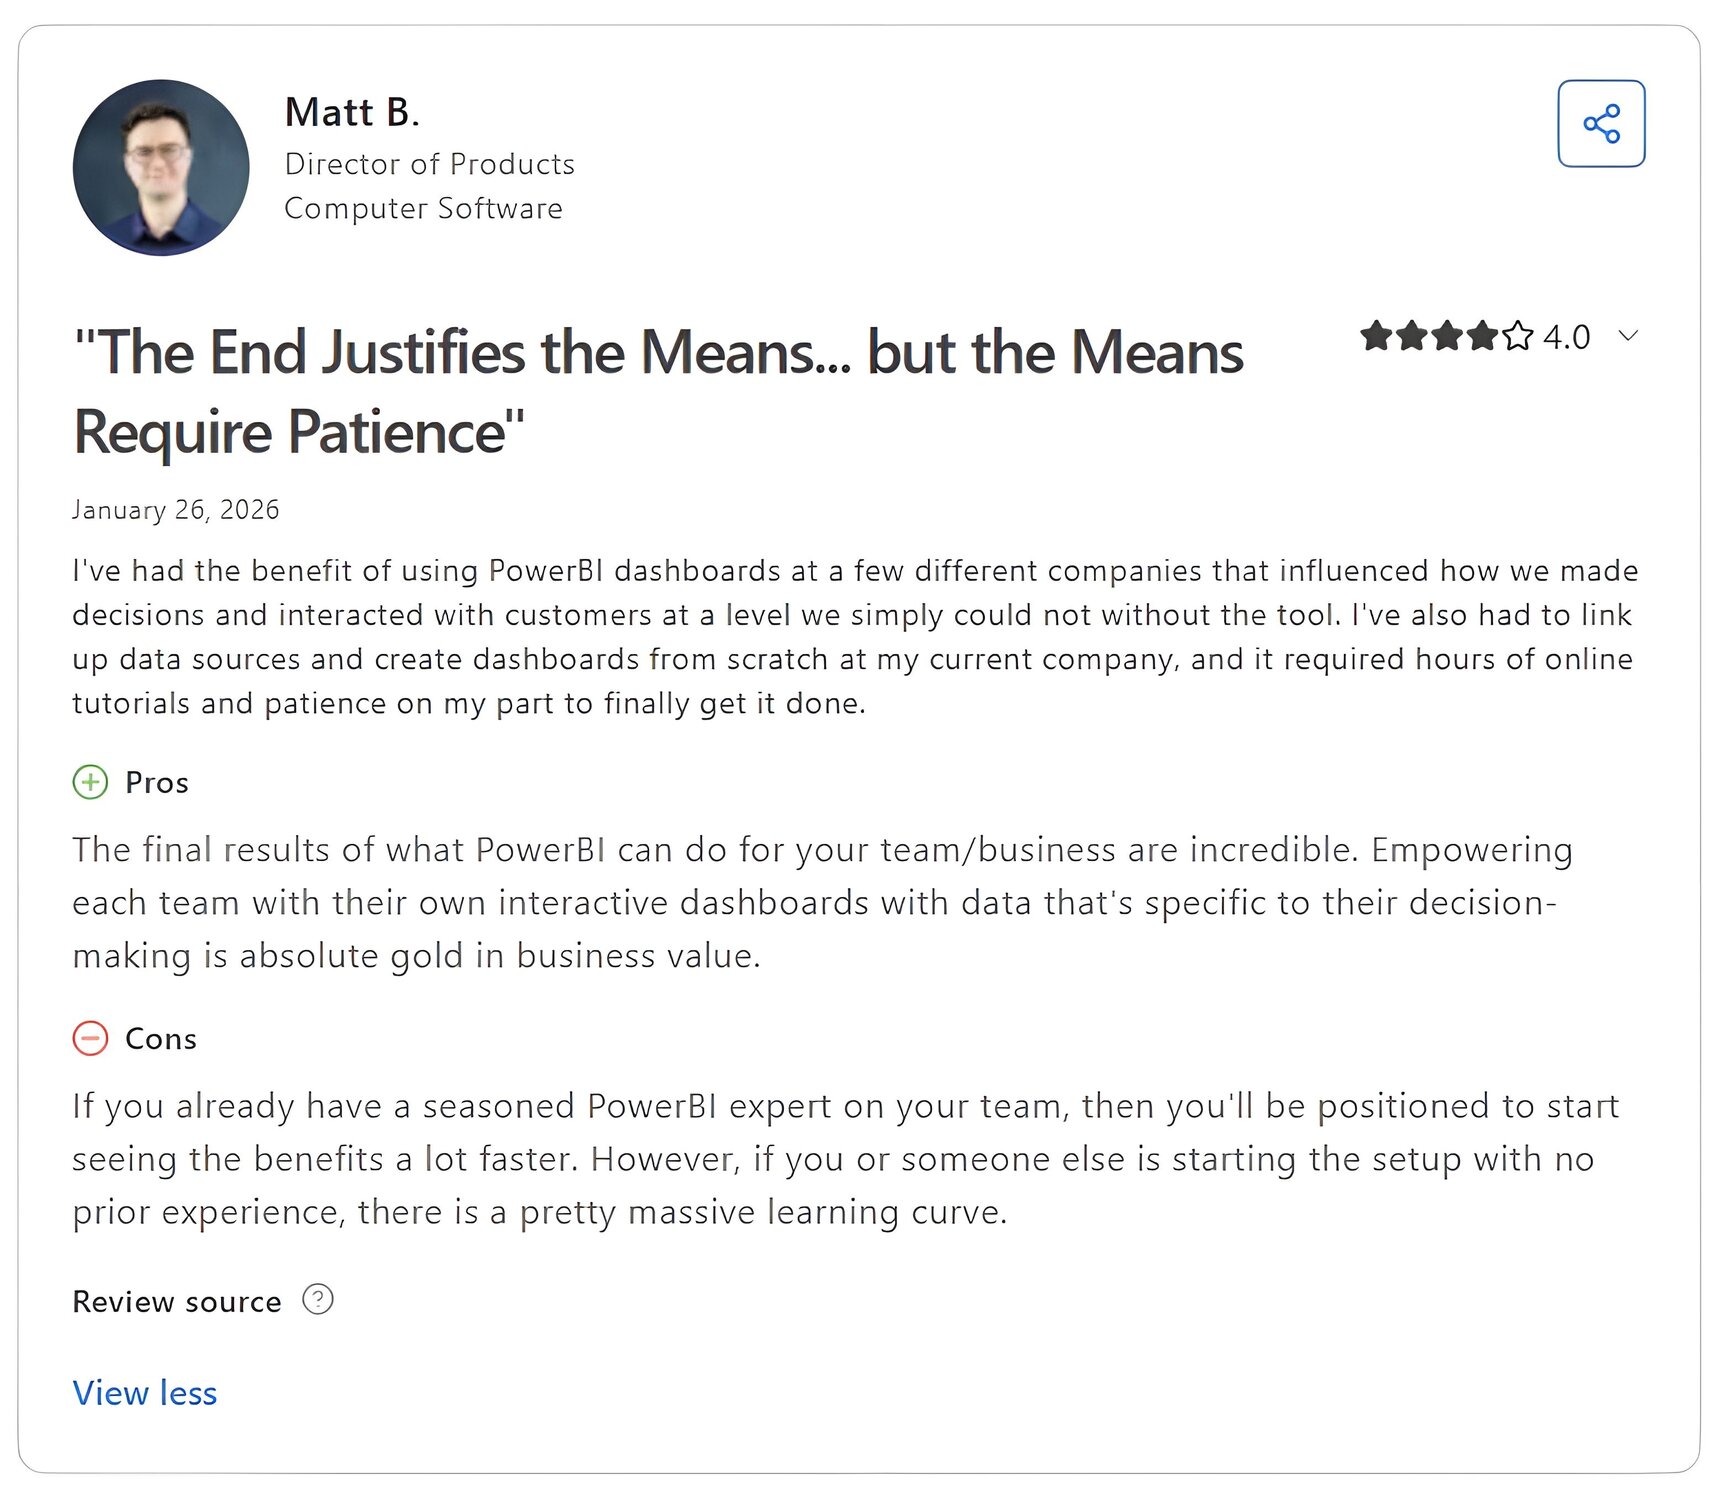
Con: “If you already have a seasoned [Power BI] expert on your team, then you’ll be positioned to start seeing the benefits a lot faster. However, if you or someone else is starting the setup with no prior experience, there is a pretty massive learning curve.” - Matt B., Capterra
Pricing
Power BI starts at $14 per user per month.
Bottom line
Power BI's report-sharing and permissions layer integrates directly with Microsoft 365 user management, so access control requires no separate setup. If you need advanced visual customization and work with complex, multi-source datasets outside the Microsoft ecosystem, Tableau might be a better fit.
3. Tableau: Best for teams that need advanced data visualization

What it does: Tableau is a data visualization and analytics platform that lets you build highly customizable charts, dashboards, and reports from a wide range of data sources.
Best for: Teams that need rich, presentation-ready visualizations and work with complex or multi-source datasets that require deep formatting control.
I built a multi-source dashboard in Tableau using a CSV file and a live database connection to test how far the visualization options go. The chart library is wide, with formatting control covering everything from axis labels to custom color palettes. Users without prior experience will likely spend time getting comfortable with calculated fields and level of detail (LOD) expressions before they can build confidently.
Key features
Drag-and-drop chart builder: Select fields and drag them onto a canvas to build charts, with automatic chart type suggestions based on the data selected.
Live and extract connections: Connect directly to a live data source or pull an extract for faster in-tool performance.
Calculated fields: Write custom calculations using Tableau's formula language to create new metrics directly within a report.
Pros and cons
| ✅ Pros | ❌ Cons |
|---|---|
| Wide chart library with deep formatting control for building presentation-ready visuals | Steeper learning curve than most BI tools on this list, especially for users with no prior experience |
| Supports live and extracted data connections across a broad range of sources | Requires a separate Creator license on top of the base price to access full authoring capabilities |
| Large user community with extensive documentation, forums, and shared workbooks |
What users say
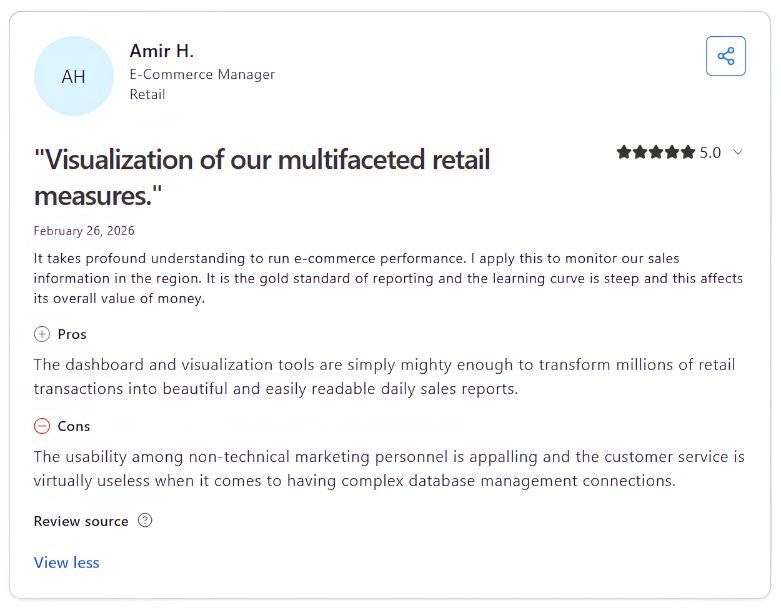
Pro: “The dashboard and visualization tools are simply mighty enough to transform millions of retail transactions into beautiful and easily readable daily sales reports.” - Amir H., Capterra
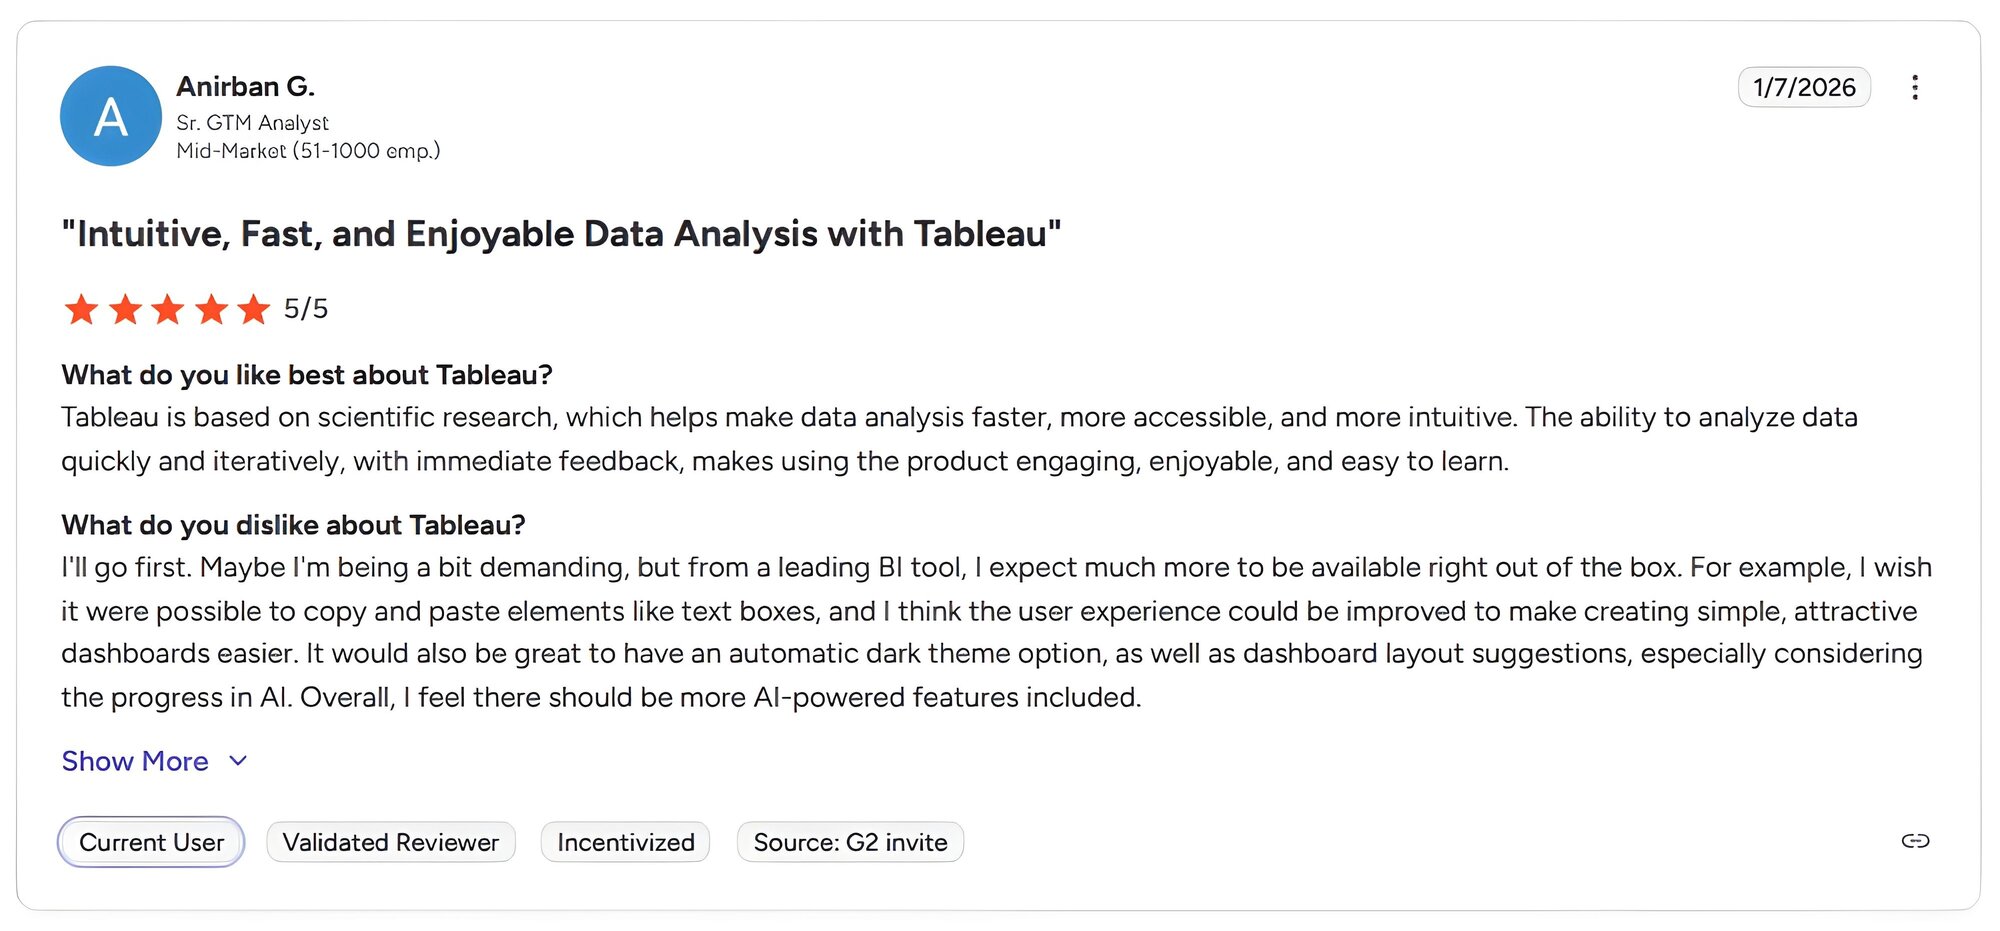
Con: “I wish it were possible to copy and paste elements like text boxes, and I think the user experience could be improved to make creating simple, attractive dashboards easier. … Overall, I feel there should be more AI-powered features included.” - Anirban G., G2
Pricing
Tableau starts at $15 per user per month, and a Creator license is also required at $75 per user per month.
Bottom line
Tableau has a large active user community with shared workbooks and forums that can help shorten the learning curve. If you need governed metrics and a consistent data definition layer across multiple teams, Looker might be a better fit.
4. Looker: Best for data teams that need governed, consistent metrics
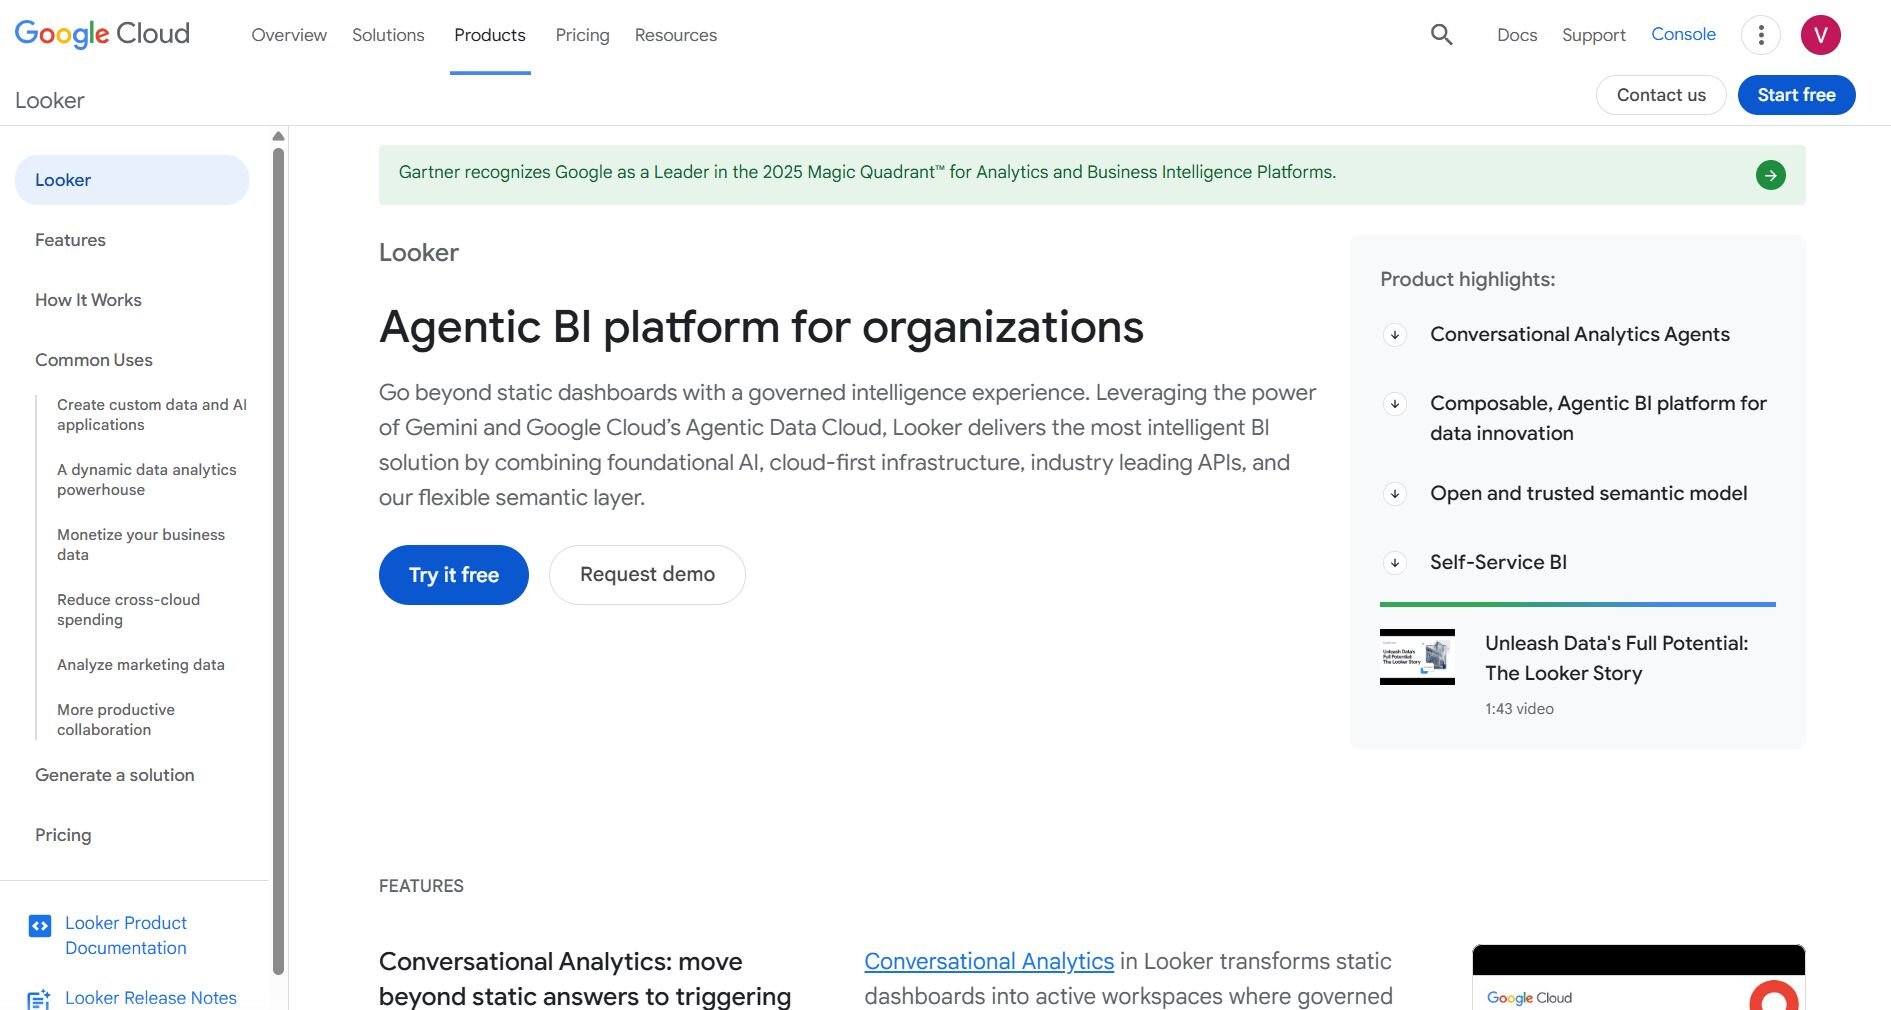
What it does: Looker is a cloud-based BI platform that lets you define business metrics and data relationships in a centralized modeling layer, then explore and report on that data across your organization.
Best for: Data teams that need a single source of truth for metrics and want business users to explore data within governed boundaries.
I set up a Looker environment with a BigQuery connection to test how it handles metric consistency across a multi-team reporting setup. The LookML modeling layer gives you precise control over how data gets defined and presented, but the initial setup requires technical investment. Many teams will likely need a data engineer involved to get the model off the ground.
Key features
LookML modeling: Define metric definitions, table relationships, and business logic in a version-controlled modeling layer.
Live warehouse connections: Query Snowflake, BigQuery, Redshift, and other cloud warehouses directly without extracting data.
Embedded analytics: Embed Looker dashboards and reports into internal tools and applications via API.
Pros and cons
| ✅ Pros | ❌ Cons |
|---|---|
| LookML modeling layer lets you define metrics once and reuse them consistently across all dashboards and reports | Initial setup requires LookML knowledge, so a data engineer or analyst is typically needed before business users can get started |
| Connects directly to cloud data warehouses without duplicating or extracting data | Formatting and visualization options are more limited than dedicated visualization tools |
| Tight Google Cloud and BigQuery integration makes it a natural fit for teams already in that ecosystem |
What users say
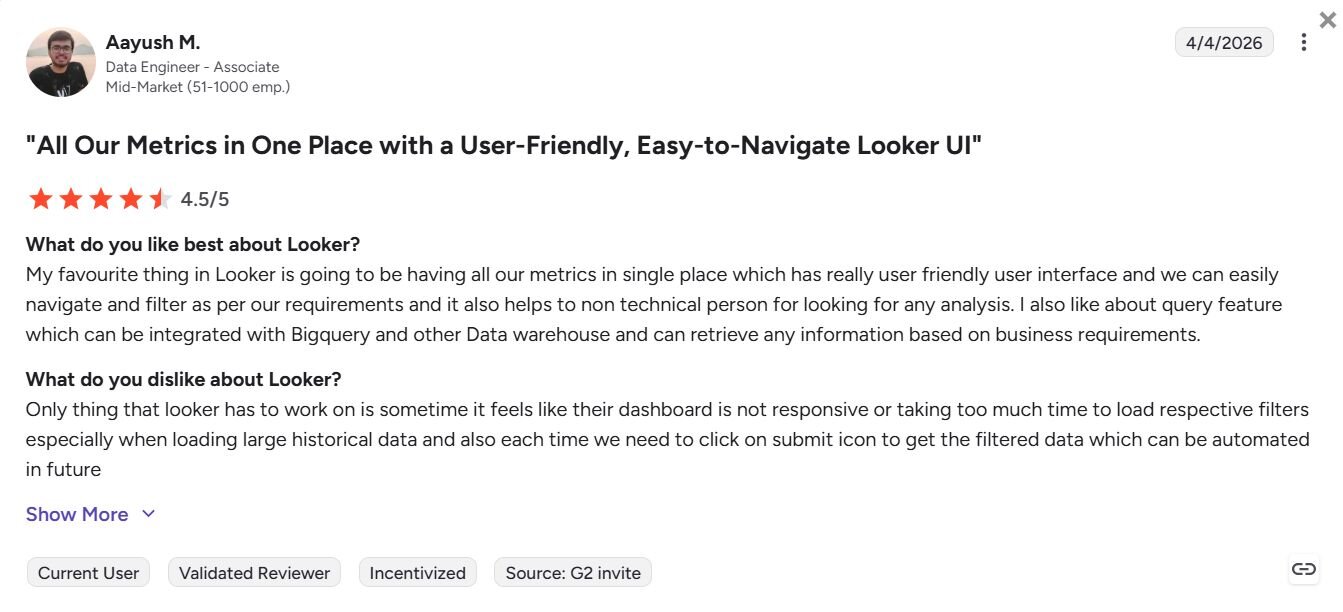
Pro: "My favourite thing in Looker is going to be having all our metrics in [a] single place…we can easily navigate and filter as per our requirements…" - Aayush M., G2
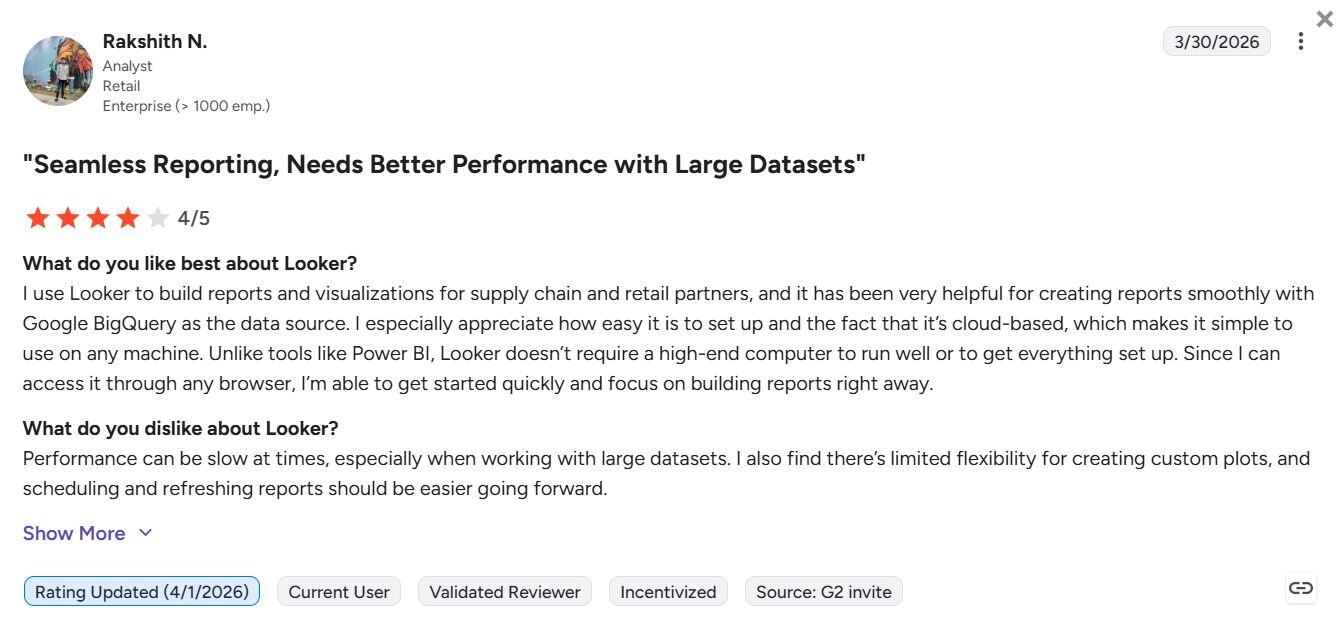
Con: "Performance can be slow at times, especially when working with large datasets. I also find there's limited flexibility for creating custom plots, and scheduling and refreshing reports should be easier going forward." - Rakshith N., G2
Pricing
Looker offers custom pricing.
Bottom line
Looker's governance model means metric definitions stay consistent even as more teams and dashboards get added over time. If you want business users to find answers through search-based queries without relying on a pre-built dashboard, ThoughtSpot might be a better fit.
5. ThoughtSpot: Best for business users who prefer search-based analytics
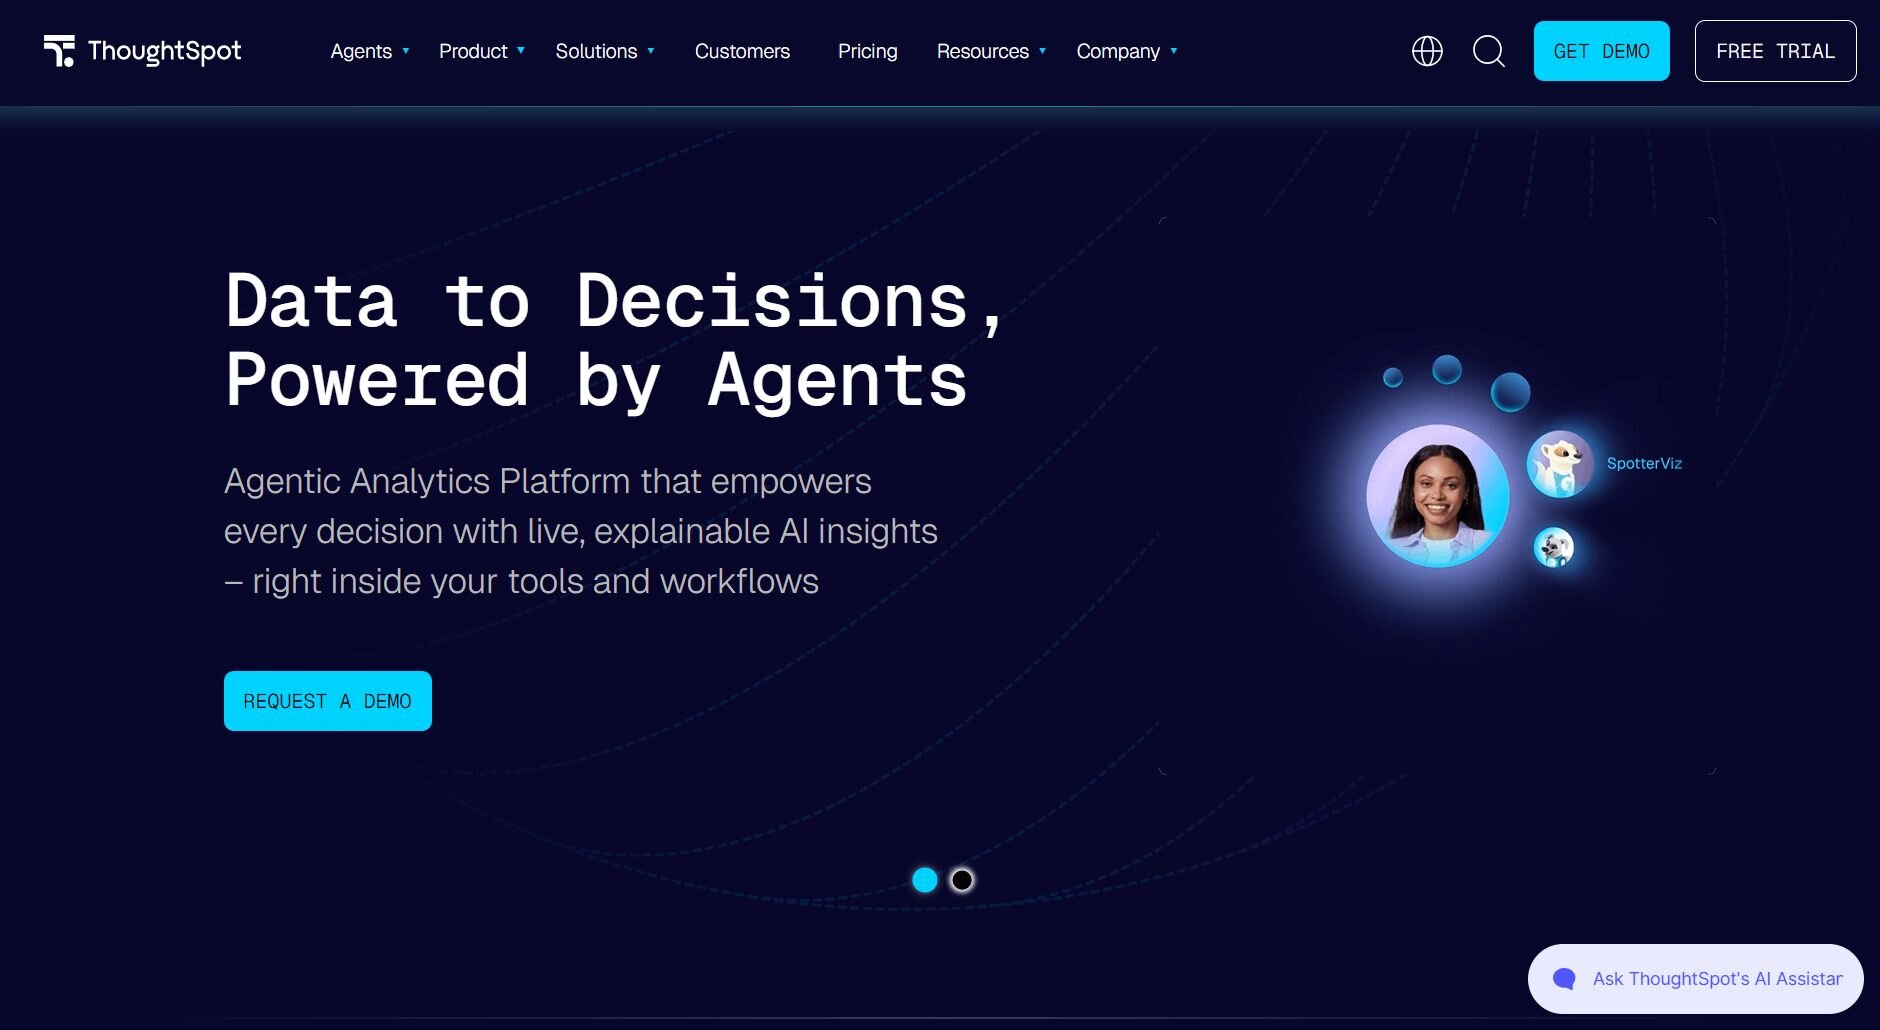
What it does: ThoughtSpot is an analytics platform that lets you search for data insights by typing questions in plain English, then returns charts and summaries based on your connected data sources.
Best for: Business users who want to find answers from their data by typing questions rather than building reports or navigating a dashboard.
I tested ThoughtSpot by running plain-English search queries against a sample dataset to see how well it translates business questions into usable output. The search-based approach works well for straightforward questions, but queries involving multi-step comparisons or nested filters can return results that need some interpretation before you can act on them.
Key features
Search-based analytics: Type a question in plain English and return a chart or summary from your connected data source.
SpotIQ: Run an automated analysis in the background that surfaces anomalies, trends, and correlations across your dataset.
Liveboards: Build interactive dashboards that update in real time as the underlying data changes.
Pros and cons
| ✅ Pros | ❌ Cons |
|---|---|
| Search-based interface lets business users find answers without building reports or writing queries | Outputs can require user interpretation before they're ready to act on, especially for complex questions |
| AI-assisted follow-up suggestions can surface related insights during an active analysis session | Formula syntax doesn't follow SQL or Excel conventions, so building custom calculations takes adjustment |
| Self-service model reduces dependency on a data team for routine analytical questions |
What user say
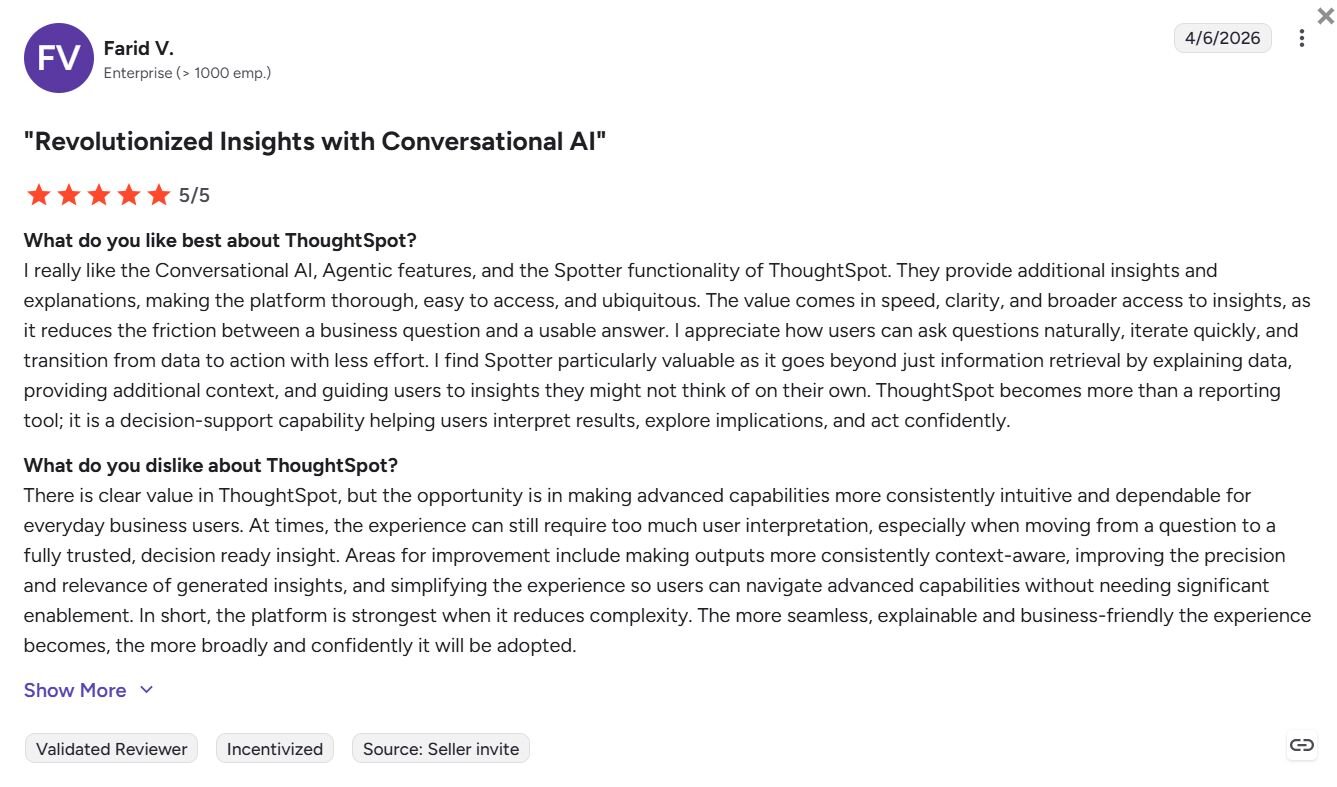
Pro: "I really like the Conversational AI, Agentic features, and the Spotter functionality of ThoughtSpot. They provide additional insights and explanations, making the platform thorough, easy to access, and ubiquitous. The value comes in speed, clarity, and broader access to insights, as it reduces the friction between a business question and a usable answer." - Farid V., G2
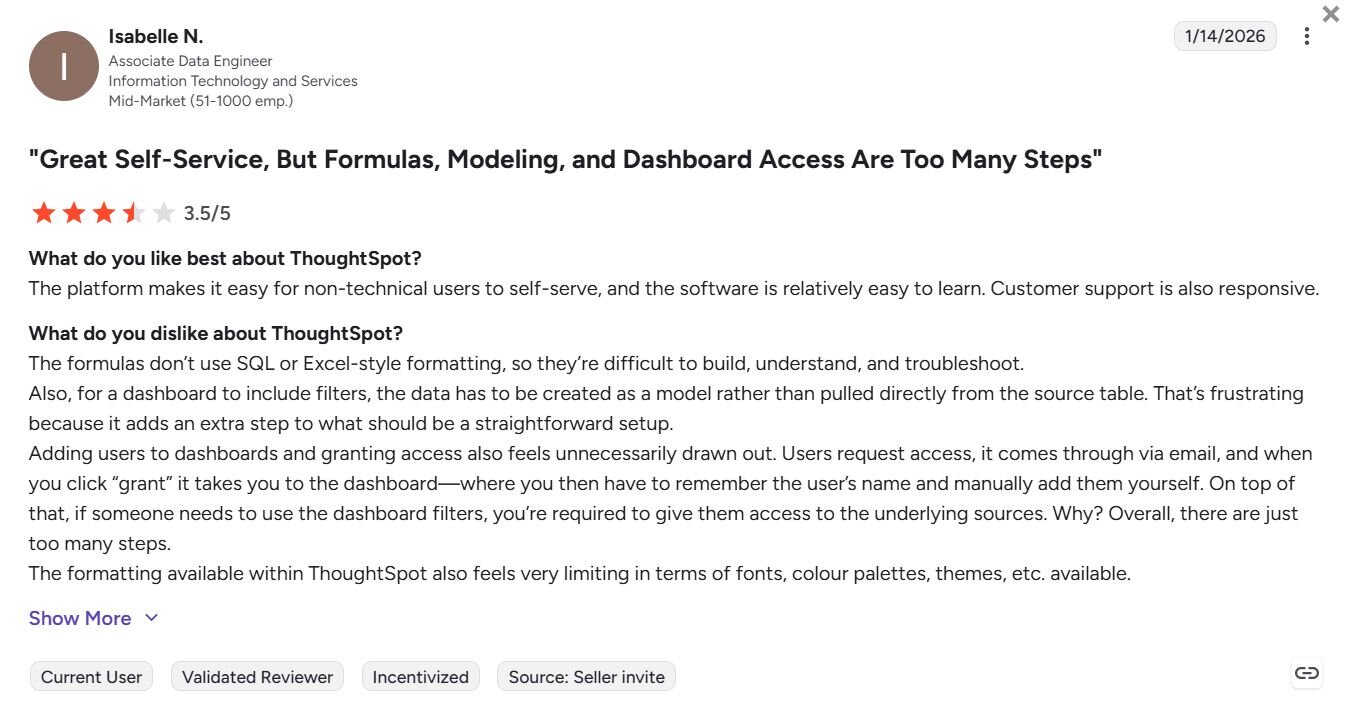
Con: "The formulas don't use SQL or Excel-style formatting, so they're difficult to build, understand, and troubleshoot. Also, for a dashboard to include filters, the data has to be created as a model rather than pulled directly from the source table. That's frustrating because it adds an extra step to what should be a straightforward setup." - Isabelle N., G2
Pricing
ThoughtSpot starts at $25 per user per month.
Bottom line
ThoughtSpot's Spotter feature can add context to a result by explaining the reasoning behind it and suggesting follow-up questions. If you want to query live data and search for public or financial datasets without uploading a file first, Julius might be a better fit.
Special mentions
The tools below didn't make the full review cut, but they're worth knowing about if none of the 5 above quite fit your workflow. They cover a range of team sizes, use cases, and analytics approaches, from embedded analytics to executive dashboards to associative data exploration.
Here are 6 more BI tools worth a look:
Sisense: Sisense is a BI platform built around embedded analytics, meaning you can build dashboards directly into your own applications. I found it handles complex, multi-source data models well, but dashboard customization can feel limited when you need custom widgets or layout control without writing code.
Domo: Domo is a cloud-based BI platform with a strong focus on live data and executive dashboards. It connects to hundreds of data sources out of the box, and the mobile app lets you view and interact with dashboards on the go without losing layout quality. The feature set is wide, which can make it harder to find what you need when you're just getting started.
Qlik Sense: Qlik Sense is a self-service analytics platform built around an associative data model, so you can explore connections across your data that a traditional query might miss. The data storytelling features are useful for presenting findings to stakeholders, but the interface does take some time to get comfortable with before you can move quickly.
Sigma: is a cloud analytics platform that lets you explore live data in a spreadsheet-style interface, making it a natural fit for teams already working in Excel or Google Sheets. Visualization options are limited to Sigma's built-in chart types, and anything beyond those requires developer work with custom plugins.
Yellowfin: Yellowfin is a BI platform with a strong focus on automated narratives and collaborative dashboards, so reports can be delivered with written context rather than just charts. It works well for teams that want insight delivery built into their workflow, but the breadth of configuration options can slow down initial setup.
Oracle Analytics: Oracle Analytics is an enterprise BI platform with built-in machine learning features and deep integration with Oracle data sources. I found it performs well for large-scale reporting within the Oracle ecosystem, but teams without existing Oracle infrastructure may find it harder to get full value from the platform.
Which BI tool should you choose?
The best BI tool depends on what your team needs to analyze, how technical your users are, and how much setup you can realistically commit to.
Choose Julius if you:
Want to ask business questions in plain English and get charts or analysis without writing code
Need to connect live data sources like Postgres, Snowflake, or BigQuery and run repeatable reports
Want to search for public or financial data directly inside the platform without uploading a file first
Choose Power BI if you:
Already use Microsoft 365 and want your reporting to stay within the same ecosystem
Need strong data modeling capabilities alongside dashboard building
Have at least one team member comfortable working with DAX formulas and data structure
Choose Tableau if you:
Need highly customizable visualizations with deep formatting control for executive-level reporting
Work with complex datasets and need a wide range of chart types to present findings
Have the time to invest in a platform with a steeper learning curve
Choose Looker if you:
Need a single source of truth for metrics across multiple teams or departments
Work heavily within the Google Cloud ecosystem and want tight BigQuery integration
Have a data team that can manage LookML modeling to govern how data gets defined
Choose ThoughtSpot if you:
Want business users to find answers by typing questions rather than building reports
Need a self-service analytics layer that doesn't require SQL knowledge to use day to day
Require an AI-assisted experience that can surface insights from search queries
Final verdict
The best BI tools with strong analytics capabilities range from AI-first platforms to more technical warehouse and visualization tools. Power BI and Tableau work well for teams that need rich visual reporting, and Looker suits teams that want governed metrics across departments. But if your priority is getting to answers fast without a data background, Julius is the place to start.
Here’s how Julius helps:
Data search: Type your question, and Julius can search for relevant public data or pull live financial market data for over 17,000 companies through its Financial Datasets integration, so you can start your analysis before you have a dataset ready.
Direct connections: Link databases like PostgreSQL, Snowflake, and BigQuery, or integrate with Google Ads and other business tools. You can also upload CSV or Excel files. Your analysis can reflect live data, so you’re less likely to rely on outdated spreadsheets.
Repeatable Notebooks: Save an analysis as a notebook and run it again with fresh data whenever you need. You can also schedule notebooks to send updated results to email or Slack.
Smarter over time: Julius includes a Learning Sub Agent, an AI that adapts to your database structure over time. It learns table relationships and column meanings as you work with your data, which can help improve result accuracy.
Quick single-metric checks: Ask for an average, spread, or distribution, and Julius shows you the numbers with an easy-to-read chart.
Built-in visualization: Get histograms, box plots, and bar charts on the spot instead of jumping into another tool to build them.
One-click sharing: Turn an analysis into a PDF report you can share without extra formatting.
For business teams that want to get answers from data without writing code or waiting on a data team, Julius is worth trying. You can bring your own data or start with a question and have Julius find and compile the data you need.
Frequently asked questions
What is the best BI tool for non-technical users?
Julius, ThoughtSpot, and Power BI are among the strongest options for non-technical users because they let you ask questions in plain English or use drag-and-drop interfaces without writing code. Julius and ThoughtSpot are the more accessible starting points, while Power BI has a steeper learning curve but works well if your team already uses Microsoft 365.
What is the difference between a BI tool and a data analytics tool?
A BI tool focuses on reporting, dashboards, and tracking business metrics over time, while a data analytics tool is typically built for deeper, more exploratory analysis, like running statistical models or testing hypotheses. Many platforms now handle both.
Do I need a data analyst to use a BI tool?
No, many modern BI tools are built so business users can get answers without relying on a data analyst. Tools like Julius and ThoughtSpot let you ask questions in natural language and get visual outputs without SQL or coding knowledge. That said, more technical platforms like Looker work best when a data team has set up the underlying data model first.