

Big data visualization tools turn large datasets into charts a whole team can read, whether that's a campaign report or a weekly sales summary.
I've used stand-alone software, cloud platforms, and code libraries, and each type handles growing data differently. This list covers 12 tools for 2026 across all three.
12 best big data visualization tools: TL;DR
- Julius: Best for business teams and marketers who want charts from connected databases and uploaded files without writing SQL
- Tableau: Best for analysts and enterprise reporting teams that build interactive dashboards for executive and cross-department reviews
- Microsoft Power BI: Best for teams on Microsoft 365 and Azure that want dashboards connected to Excel and other Microsoft tools
- Looker Studio (formerly Google Data Studio): Best for marketers who report on campaign results, website traffic, and ad spend from Google Analytics, Google Ads, and BigQuery
- Qlik Sense: Best for analysts who explore data across many tables and want every click to filter the related values
- D3.js: Best for developers and data journalists who build custom, animated web visuals with full control over every element
- Google Charts: Best for web developers who embed lightweight, responsive charts in sites and apps with a few lines of JavaScript
- Plotly: Best for data scientists and developers who build interactive charts and apps in Python, R, or JavaScript
- Highcharts: Best for development teams that build customer-facing dashboards and data-rich apps with polished, interactive charts
- Chart.js: Best for front-end developers who add common chart types like bar, line, and pie to web apps with an open-source library
- Zoho Analytics: Best for small and mid-sized businesses that report on sales and marketing data from Zoho CRM and other business apps
- FusionCharts: Best for development teams that need a large catalog of chart, gauge, and map types in one commercial JavaScript library
How I researched and tested these big data visualization tools
I read documentation and user reviews for every tool on this list. Then I built sample reports with mock data, using dashboards for the platforms and coded charts for the libraries. I noted how long each build took and whether performance dropped as the data grew.
Here's what I considered:
- Data connections: How many of my sources (databases, warehouses, spreadsheets, and ad platforms) each tool connected to, and how long setup took. For the libraries, I looked at how easily they pulled in data through code.
- Performance on bigger datasets: How each tool loaded, filtered, and refreshed the larger sample file, and the point where charts slowed down.
- Chart quality and interactivity: Whether the default charts were ready for a client report, and how well filters, drill-downs, and hover details worked.
- Learning curve: How much SQL, code, or training a business user needs before the first useful chart.
- Sharing and cost: How easily I could share a finished report with people outside the tool, and what the free or entry option covers.
💡Tip: If you need to analyze your data before you chart it, our guide to big data analytics tools covers 7 platforms built for large datasets.
Types of big data visualization tools
The 12 tools on this list fall into 3 types, and each suits a different kind of team:
Stand-alone software
Tableau, Power BI, and Qlik Sense are full analytics products with their own desktop or server apps, and all 3 also offer cloud versions.
They give you dashboards, data connectors, and a mostly drag-and-drop builder, so analysts and business teams can report with little code.
Cloud platforms
Julius, Looker Studio, and Zoho Analytics run in your browser and connect to your data sources without a desktop install. Setup is lighter, and sharing happens through a link or a shared workspace.
Looker Studio connects natively to Google Analytics, Google Ads, and BigQuery.
Code libraries
D3.js, Google Charts, Plotly, Highcharts, Chart.js, and FusionCharts are added to a website or notebook with code.
Developers use them to build custom visuals for websites and product dashboards. They give you control over how each chart looks, and someone on the team needs to be comfortable with code.
12 best big data visualization tools: quick comparison
| 💻 Tool | 🎯 Best for | 🆓 Free option | 🔥 Starting price (billed annually) | ⚡ Strengths |
| Julius | AI-generated charts from connected databases | Yes | $16/month | Chart generation from typed questions, automatic chart type selection, and connections to databases and ad platforms |
| Tableau | Executive dashboards | Yes, public dashboards only | $75/month for a Creator license | Drag-and-drop canvas, calculated fields, and AI-surfaced insights |
| Microsoft Power BI | Microsoft 365 workplaces | Yes, desktop app only | $14/user/month | Direct Excel and Azure connections, natural-language visual creation, and shareable reports |
| Looker Studio (formerly Google Data Studio) | Campaign and traffic reporting | Yes | Free, Pro plan $9/user/project/month | Native Google Analytics, Google Ads, and BigQuery connections, free access, and shareable live report links |
| Qlik Sense | Open-ended data exploration | Trial only | $300/month, includes 10 users | Associative filtering, natural-language questions, and self-service chart building |
| D3.js | Custom, animated web visuals | Yes | Free (open-source) | Full control over every visual element, direct data binding, and custom animations |
| Google Charts | Quick embedded site charts | Yes | Free | Lightweight loading, common chart types, and cross-browser support |
| Plotly | Interactive charts in data science code | Yes | $290/creator seat/year | Python, R, and JavaScript libraries, interactive 3D and statistical charts, and Dash app publishing |
| Highcharts | Customer-facing dashboards | Yes, non-commercial use only | $366/seat/year | Boost module for large point counts, built-in chart export, and responsive layouts |
| Chart.js | Common charts in web apps | Yes | Free (open source) | Quick setup, eight core chart types, and responsive canvas rendering |
| Zoho Analytics | Small teams using Zoho apps | Yes | $24/month (Cloud) | Zoho CRM and app connectors with prebuilt reports, data blending, and drag-and-drop dashboards |
| FusionCharts | Charts, gauges, and maps in web apps | Trial only | $1,899 per year for five developers | 95+ chart types, 1,400+ maps, framework wrappers, and export to images and PDF |
*Pricing correct as of October 2026. Confirm with vendor.
1. Julius: Best for AI-generated charts from connected databases

- Type: Cloud platform
- What it does: Julius is a cloud-based AI data analysis platform that turns a typed question into a chart, table, or report from connected databases, uploaded files, and public or financial datasets found through data search.
- Best for: Marketers, sales analysts, and operations teams who report from a connected database and want charts without waiting on an analyst.
We built Julius so people who work with numbers can get answers without writing SQL. You connect a database like Postgres, Snowflake, or BigQuery, ask a question such as "show monthly revenue by region," and get a chart with the query already written.
Julius picks up your table relationships and business context as you use it, so answers get faster and more precise over time.
Early answers on a new connection are worth checking against a number you already trust.
Key features
- Natural language queries: Type a question in plain English and return a chart, table, or summary.
- Connected data sources: On a paid plan, link databases such as Postgres, Snowflake, and BigQuery, or upload a file.
- Chart types: Build line, bar, scatter, heatmap, and geographic map charts, among others.
Pros and cons
| ✅ Pros | ❌ Cons |
| Queries run until complete, and the results can be exported for use elsewhere | Direct connections cover a set list of sources, so data stored elsewhere has to be uploaded as a file |
| Teammates who share a connection speed up how quickly Julius picks up the database structure | Early answers on a new database connection need a sanity check against a number you already trust, until Julius learns your table relationships |
| SOC 2 Type 2 certified, a common requirement for teams that have to pass a security review |
What users say

Pro: “If you spend more than 2 hours a week working with data, Julius AI will save you time. Start with the free plan. You’ll know within a week if it fits your workflow. For most non-technical users, it’s a no-brainer.” (Fahim Joharder, Fahim AI independent Julius review)

Con: “Not gonna lie, the first time I uploaded a messy CSV with empty values, the results were off. AI can help identify outliers and handle empty values. But you still need to clean your raw data first.” (Fahim Joharder, Fahim AI independent Julius review)
Pricing
Julius starts at $16 per month.
Bottom line
Julius suits teams that report from a connected database and want to check the code behind each answer. Tableau could be worth a look if executive reviews call for polished dashboards with fixed layouts.
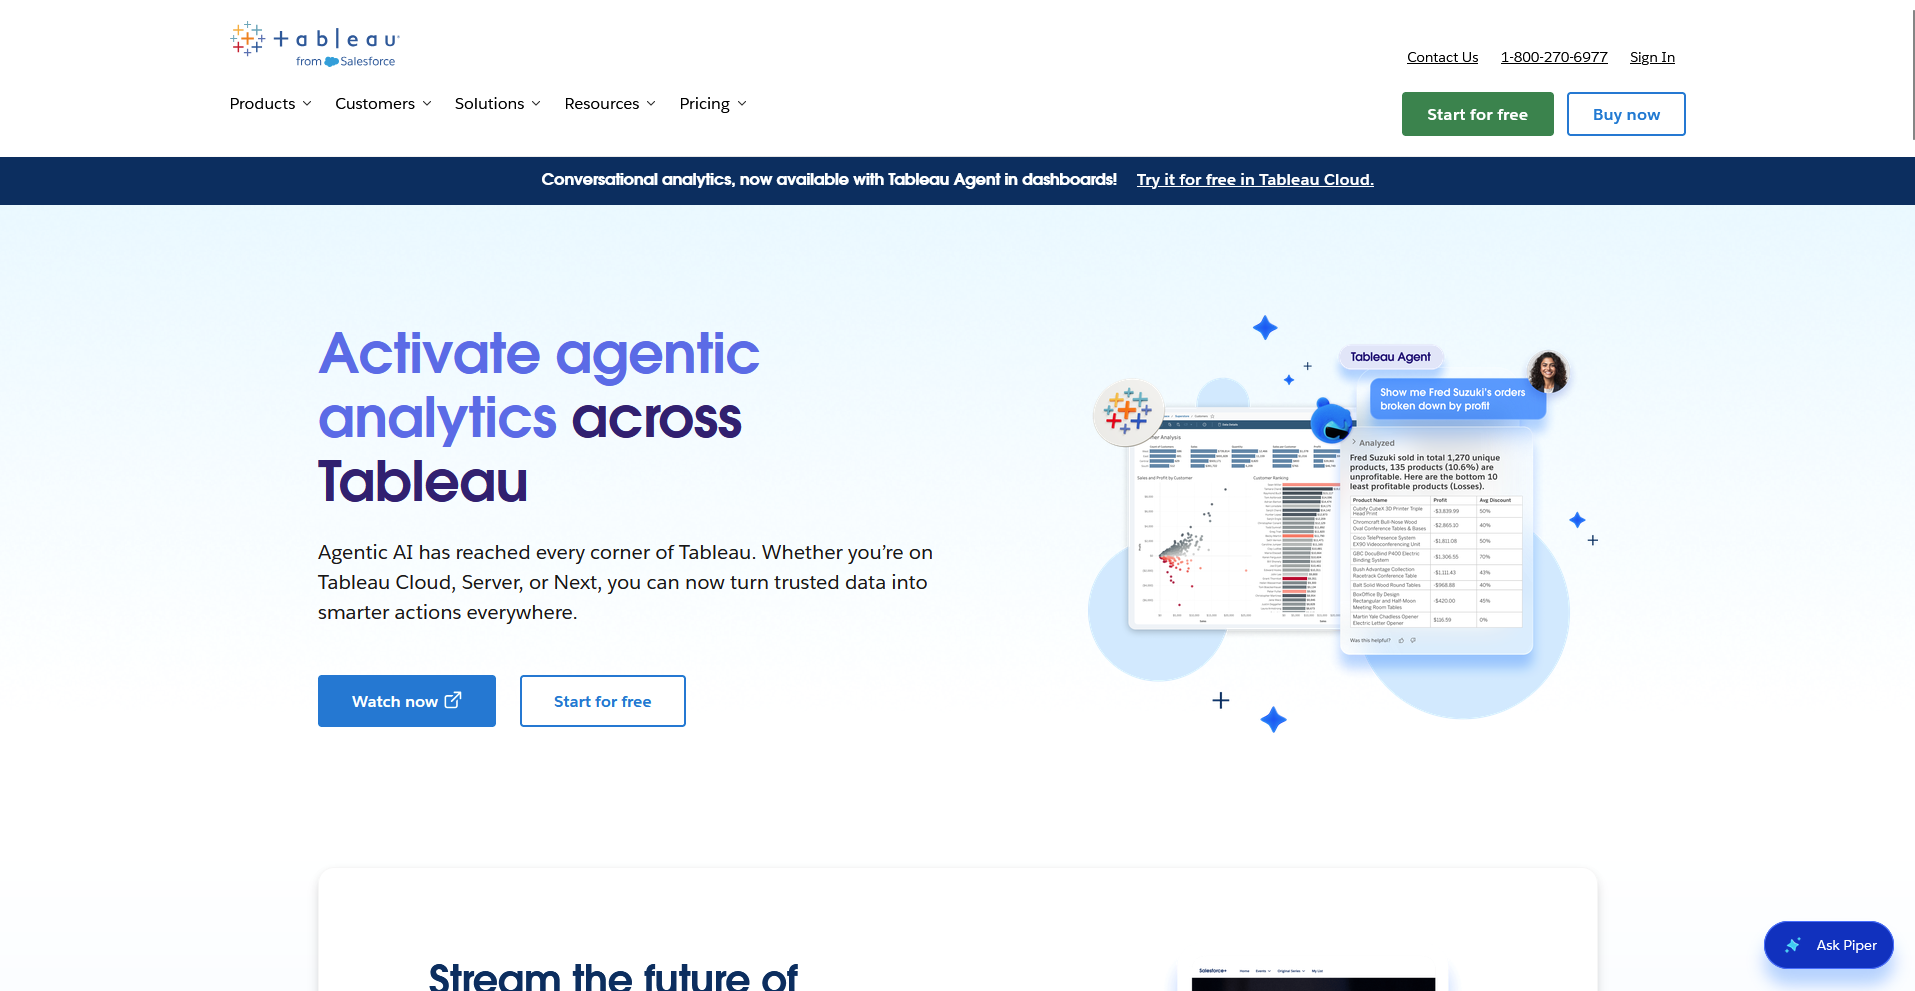
2. Tableau: Best for executive dashboards
- Type: Stand-alone software
- What it does: Tableau is a stand-alone data visualization platform that connects to databases, warehouses, and files and builds interactive dashboards on a drag-and-drop canvas.
- Best for: Analysts who build polished dashboards for leadership reviews and board updates.
Tableau is built around a drag-and-drop canvas, so I tested it by building a sales dashboard from sample data to see how far I could get without code.
I added a calculated field for profit margin and applied one filter that updated every chart on the page. The layout looked ready for a leadership review, although learning how Tableau separates dimensions from measures slowed my first build.
Key features
- Drag-and-drop canvas: Drop fields onto a canvas to build charts and dashboards.
- Calculated fields: Create custom metrics, such as profit margin, with formulas applied to your data.
- AI-surfaced insights: Spot trends and outliers in your data with AI-generated summaries in Tableau Pulse, available in Tableau Cloud.
Pros and cons
| ✅ Pros | ❌ Cons |
| Connects to sources ranging from spreadsheets to cloud data warehouses | An analyst usually has to set up data connections and calculations before other people can use a dashboard |
| Tableau Public offers a free way to publish dashboards online | Tableau Public dashboards are visible to anyone online, so the free version doesn't suit private company data |
| A large user community shares tutorials and sample dashboards through Tableau Public |
What users say
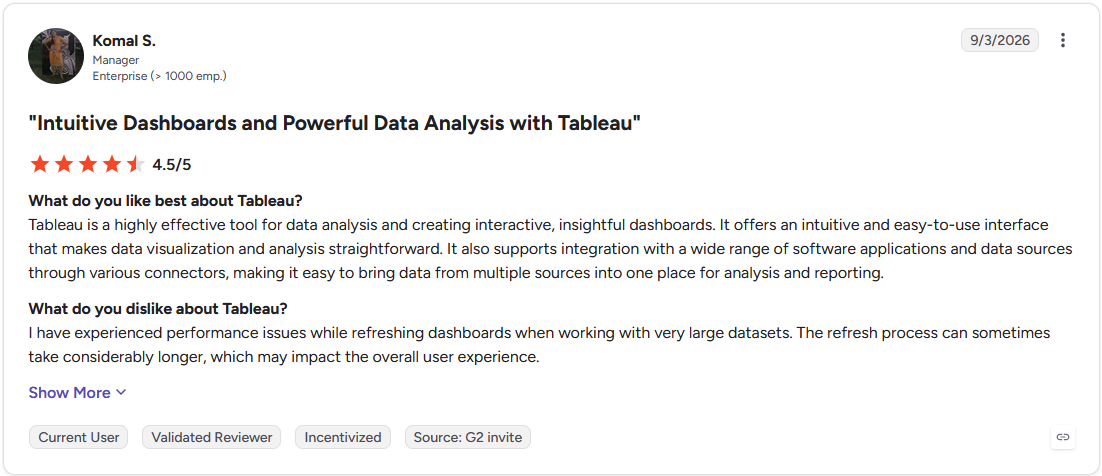
Pro: "Tableau is a highly effective tool for data analysis and creating interactive, insightful dashboards. It offers an intuitive and easy-to-use interface that makes data visualization and analysis straightforward." (Komal S., G2)
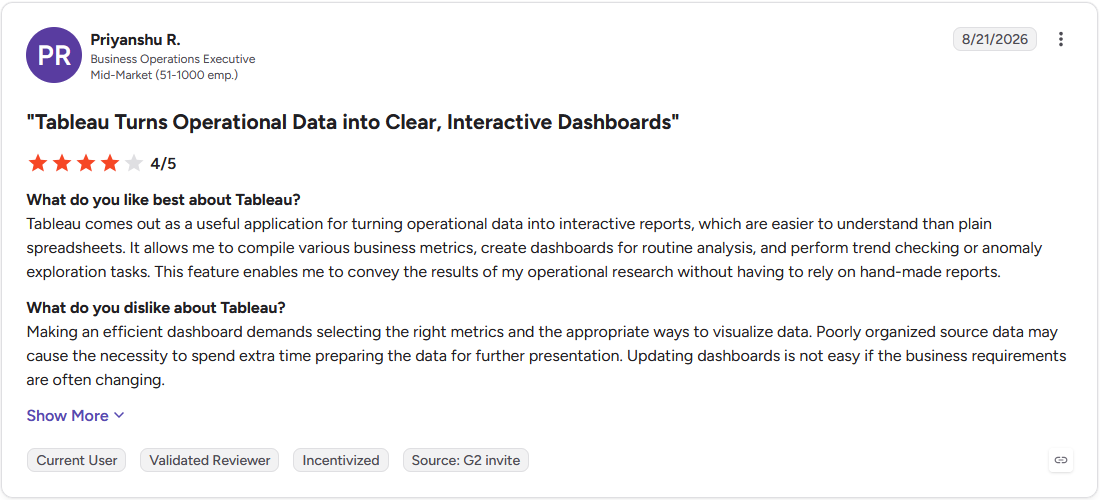
Con: "Making an efficient dashboard demands selecting the right metrics and the appropriate ways to visualize data. Poorly organized source data may cause the necessity to spend extra time preparing the data for further presentation. Updating dashboards is not easy if the business requirements are often changing." (Priyanshu R., G2)
Pricing
Tableau starts at $75 per month for a Creator license.
Bottom line
A published Tableau dashboard can refresh on a schedule, so a weekly leadership report doesn't need rebuilding each time. If your team already works in Microsoft 365, Power BI is worth checking out.
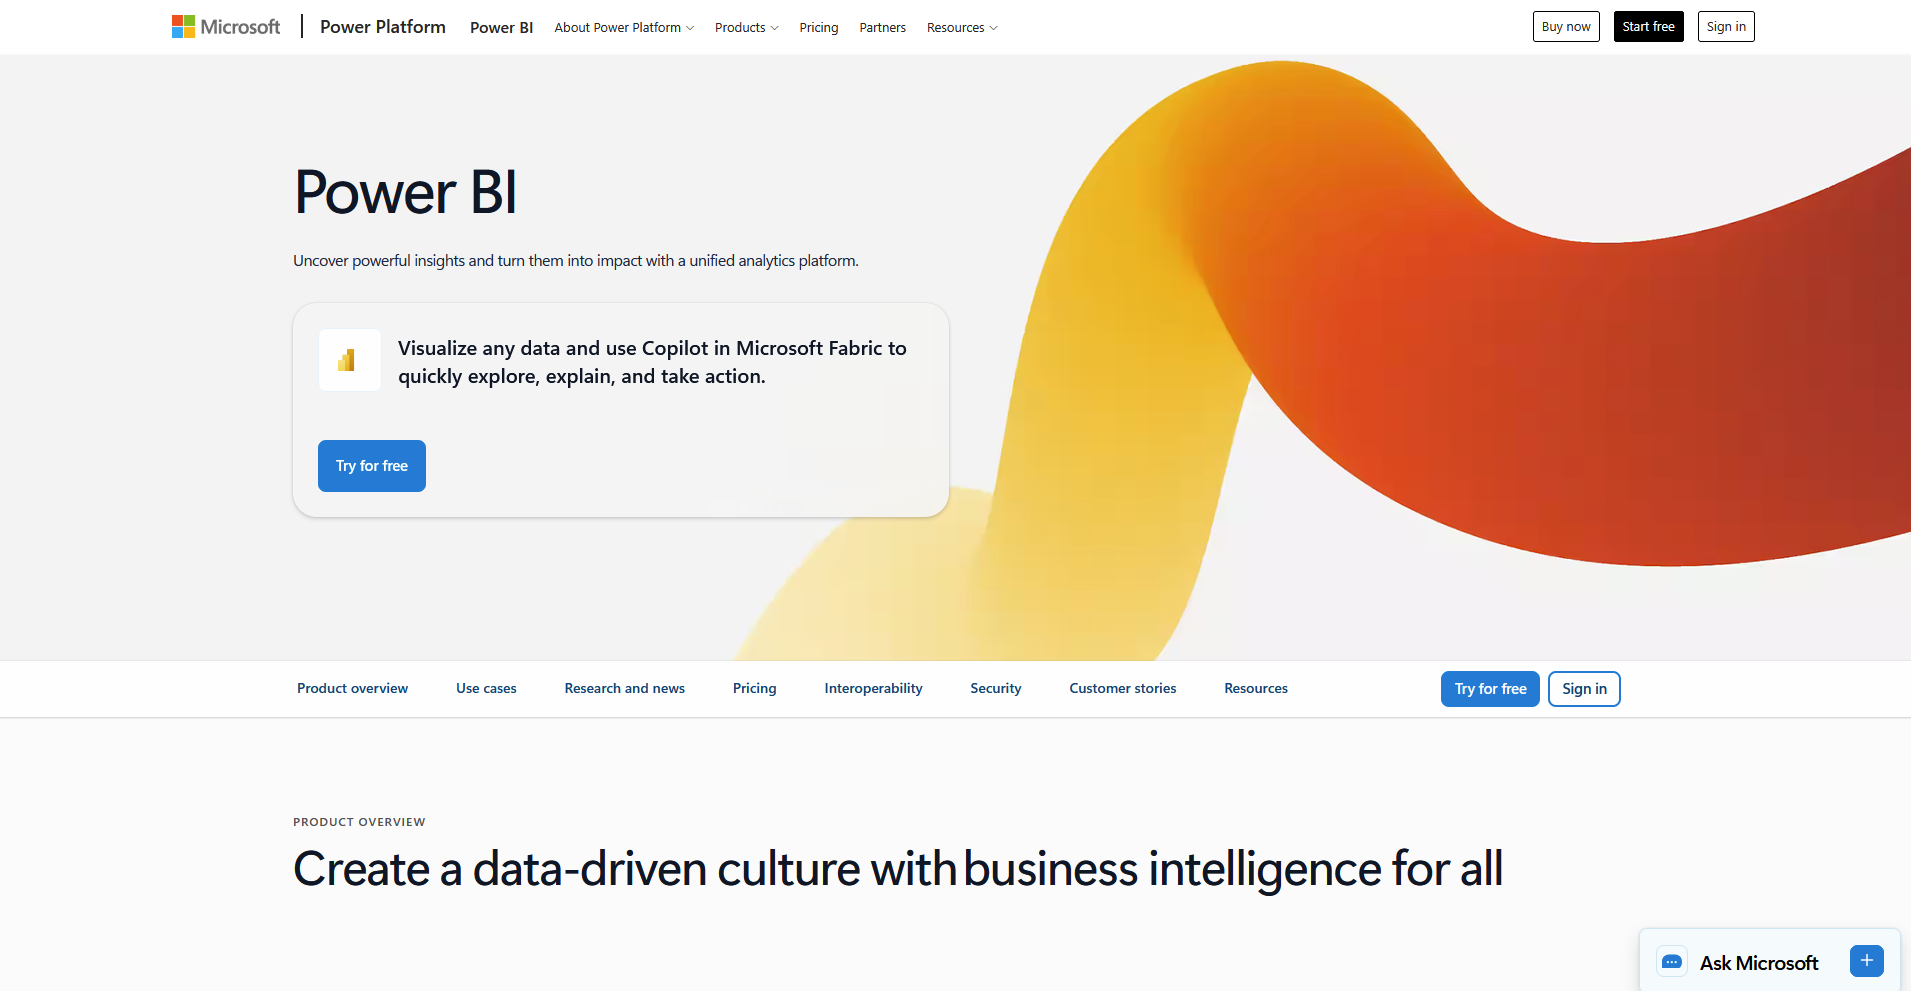
3. Microsoft Power BI: Best for Microsoft 365 workplaces
- Type: Stand-alone software
- What it does: Microsoft Power BI is a stand-alone business intelligence platform that connects to Excel, Azure, and other sources to build interactive reports and dashboards.
- Best for: Teams that keep their data in Excel, SharePoint, or Azure and want reports built on those same sources.
To see how Power BI handles Microsoft data, I imported an Excel workbook of sample sales figures and built a report with a bar chart, a map, and a date slicer. The import took only a few clicks, and the report updated when I edited the workbook and refreshed it.
Writing custom measures in DAX, Power BI's formula language, took me longer to pick up than the drag-and-drop part.
Key features
- Excel and Azure connections: Connect directly to Excel workbooks, Azure data services, and SQL databases.
- Copilot: Ask questions in plain English and generate visuals from your data. It needs a paid Fabric or Premium capacity.
- Report sharing: Publish reports to the Power BI service so colleagues can open them in a browser or the mobile app.
Pros and cons
| ✅ Pros | ❌ Cons |
| A free desktop app lets you build and test reports before anyone buys a license | Power BI Desktop runs only on Windows, so Mac users have to build reports in a browser or a virtual machine |
| DirectQuery mode reads from Azure and SQL sources in place, so a report doesn't need a full copy of the data | Microsoft is retiring Power BI's built-in real-time streaming on October 31, 2027, and points users to Microsoft Fabric's Real-Time Intelligence for live dashboards |
| The ribbon-style interface looks familiar to people who already use Excel |
What users say
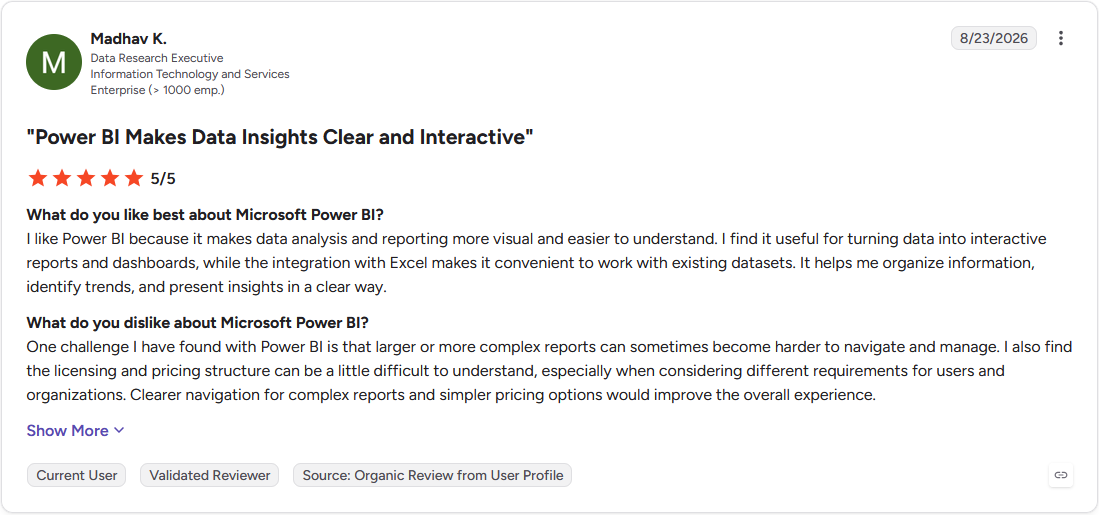
Pro: "I like Power BI because it makes data analysis and reporting more visual and easier to understand. I find it useful for turning data into interactive reports and dashboards, while the integration with Excel makes it convenient to work with existing datasets." (Madhav K., G2)
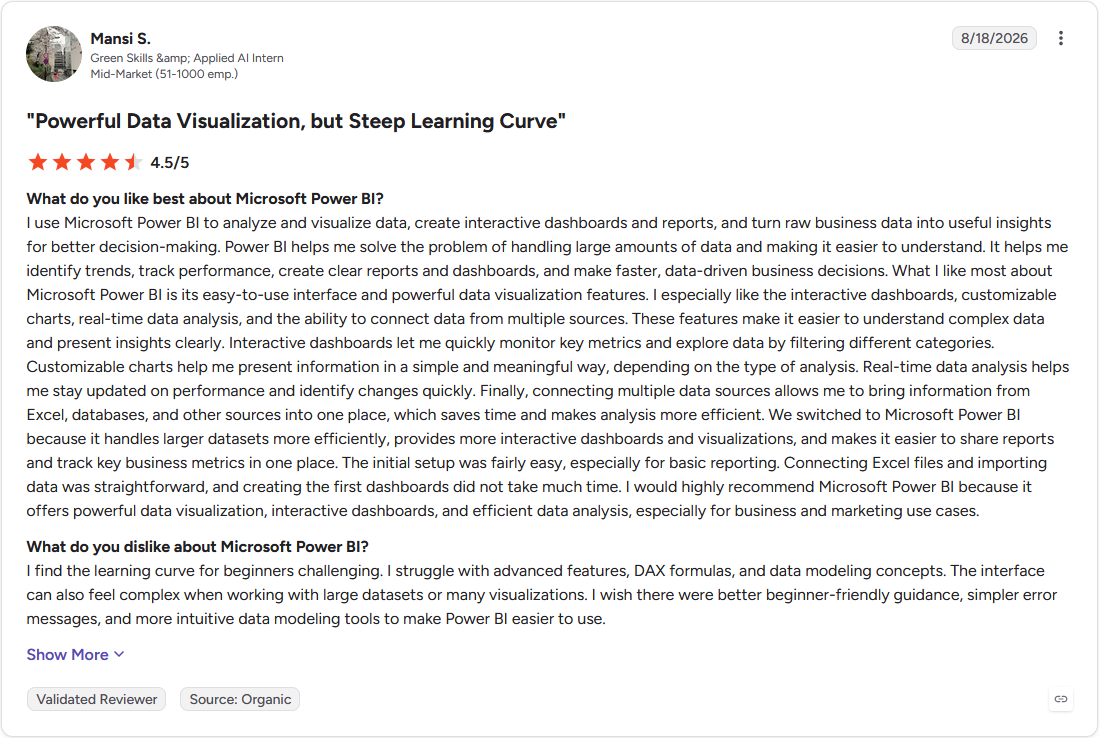
Con: "I find the learning curve for beginners challenging. I struggle with advanced features, DAX formulas, and data modeling concepts. The interface can also feel complex when working with large datasets or many visualizations." (Mansi S., G2)
Pricing
Power BI starts at $14 per user per month.
Bottom line
Power BI is a good pick for teams already on Microsoft 365, because sharing runs through accounts they already have. Looker Studio might be a better fit if your reports pull mostly from Google Analytics and Google Ads.
4. Looker Studio (formerly Google Data Studio): Best for campaign and traffic reporting
- Type: Cloud platform
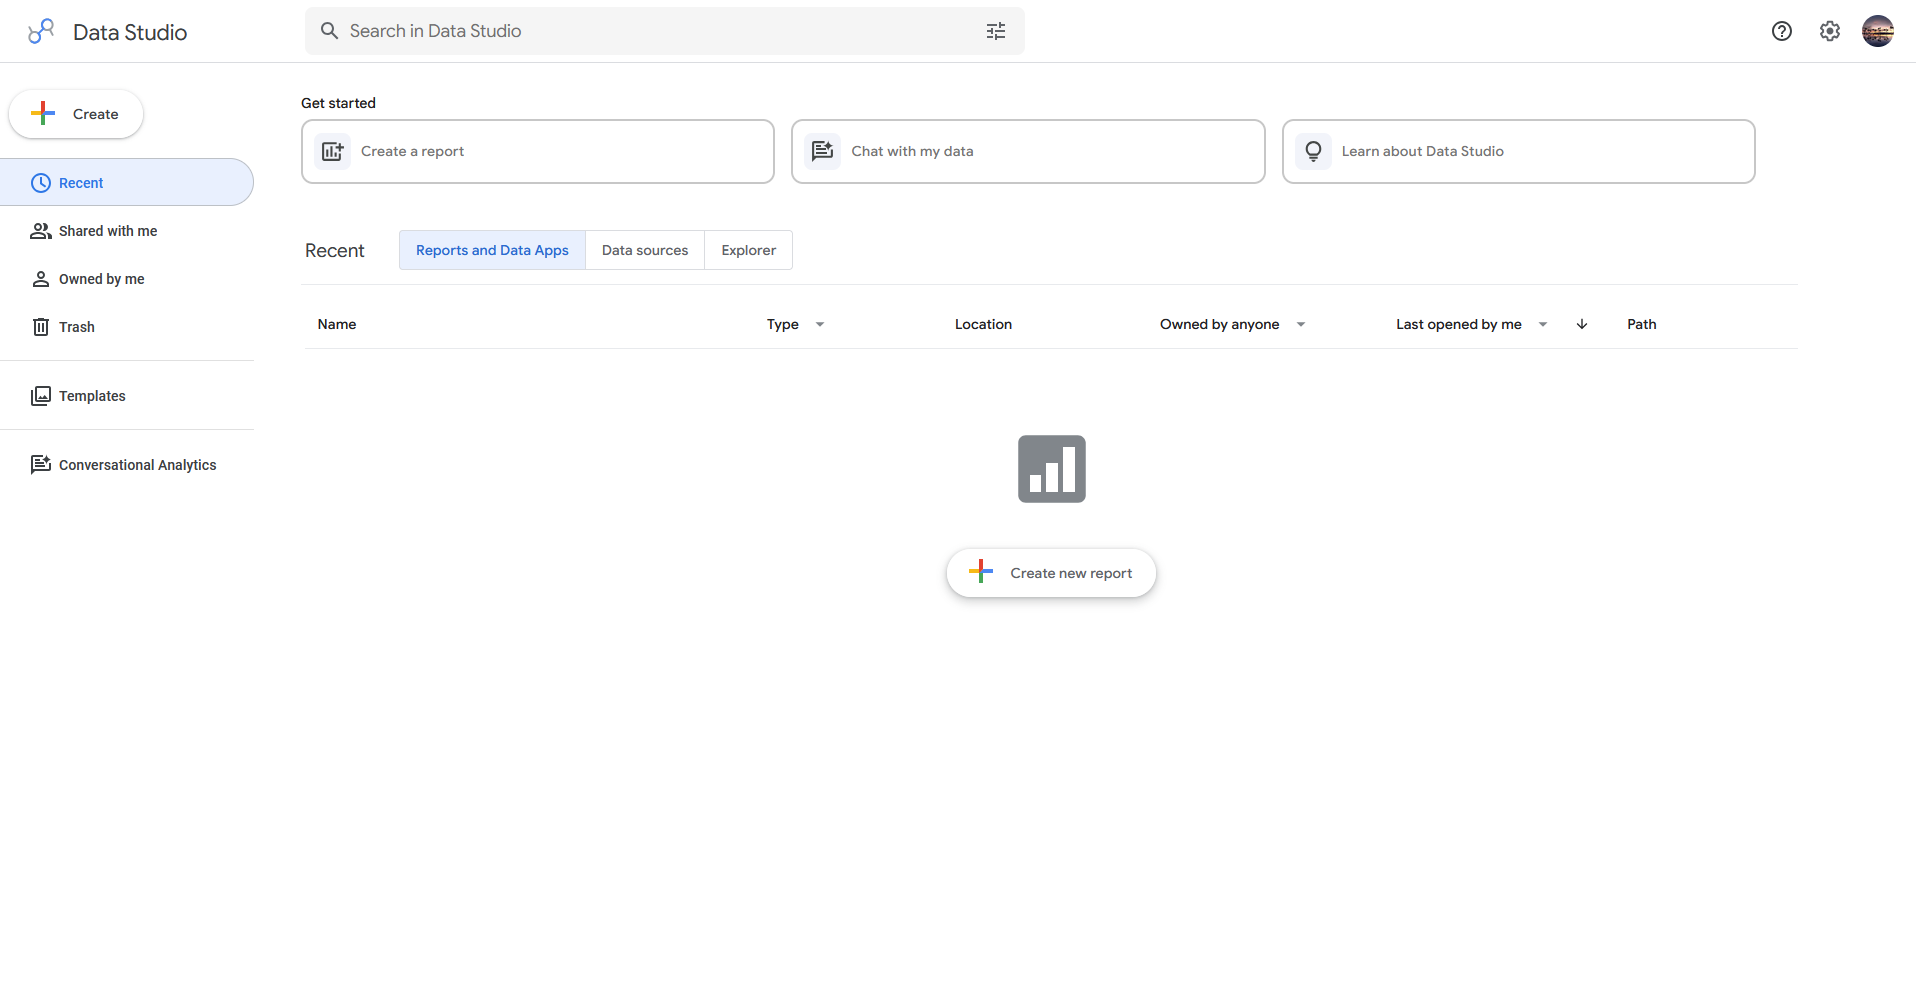
- What it does: Looker Studio (formerly Google Data Studio) is a cloud-based reporting platform from Google that turns data from Google products and other sources into interactive dashboards.
- Best for: Marketers who build weekly performance reports from Google Analytics, Google Ads, and BigQuery data.
I tested Looker Studio by connecting it to a Google Analytics demo account to see how quickly a marketer could go from raw traffic data to a shareable report. I built a time-series chart, a channel breakdown, and a date filter, and every chart updated when I changed the date range.
The Google connection took a few clicks, but data from outside Google needed a partner connector that I had to set up first.
Key features
- Google connectors: Connect natively to Google Analytics, Google Ads, and BigQuery.
- Sharing controls: Share a report through a link and set who can view or edit it.
- Data blending: Combine data from multiple sources in a single chart.
Pros and cons
| ✅ Pros | ❌ Cons |
| The free version covers building and sharing reports, so a small team can start without buying a license | Charts built on large tables can load slowly unless you summarize the data first |
| A template gallery gives marketers a starting layout for traffic and ad reports | Looker Studio offers limited tools for cleaning data, so messy source data has to be fixed before it reaches the report |
| Several people can edit the same report at the same time, as in Google Docs |
What users say
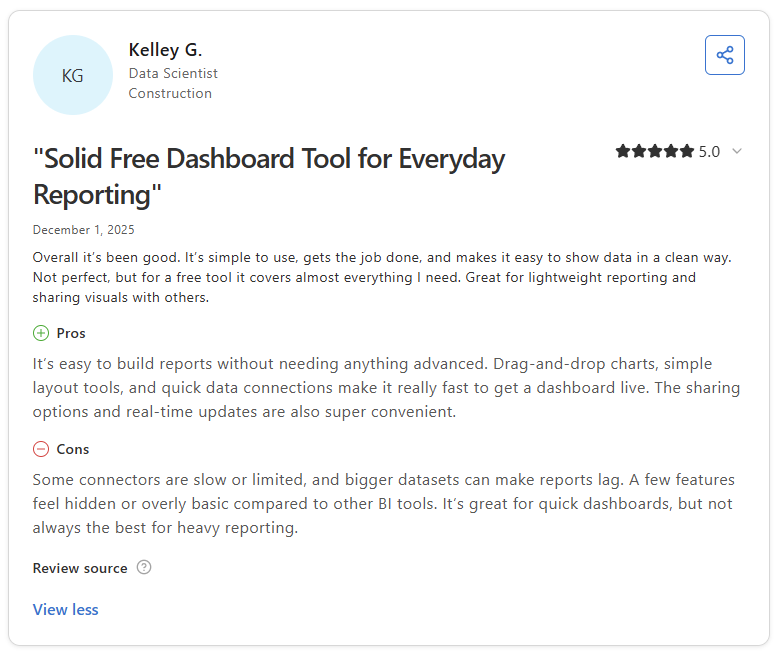
Pro: “It’s easy to build reports without needing anything advanced. Drag-and-drop charts, simple layout tools, and quick data connections make it really fast to get a dashboard live.” (Kelley G., Capterra)
Con: “Looker Studio can feel limited when it comes to more advanced data modeling and complex calculations. Performance may slow down with larger datasets, and some connectors can be unreliable or end up requiring workarounds.” (Candy N., G2)
Pricing
Looker Studio is free, and the Pro plan starts at $9 per user per project per month.
Bottom line
Looker Studio is a good first reporting tool for marketers whose numbers already sit in Google Sheets. Qlik Sense may suit you better if you need to explore data across many tables.
5. Qlik Sense: Best for open-ended data exploration
- Type: Stand-alone software
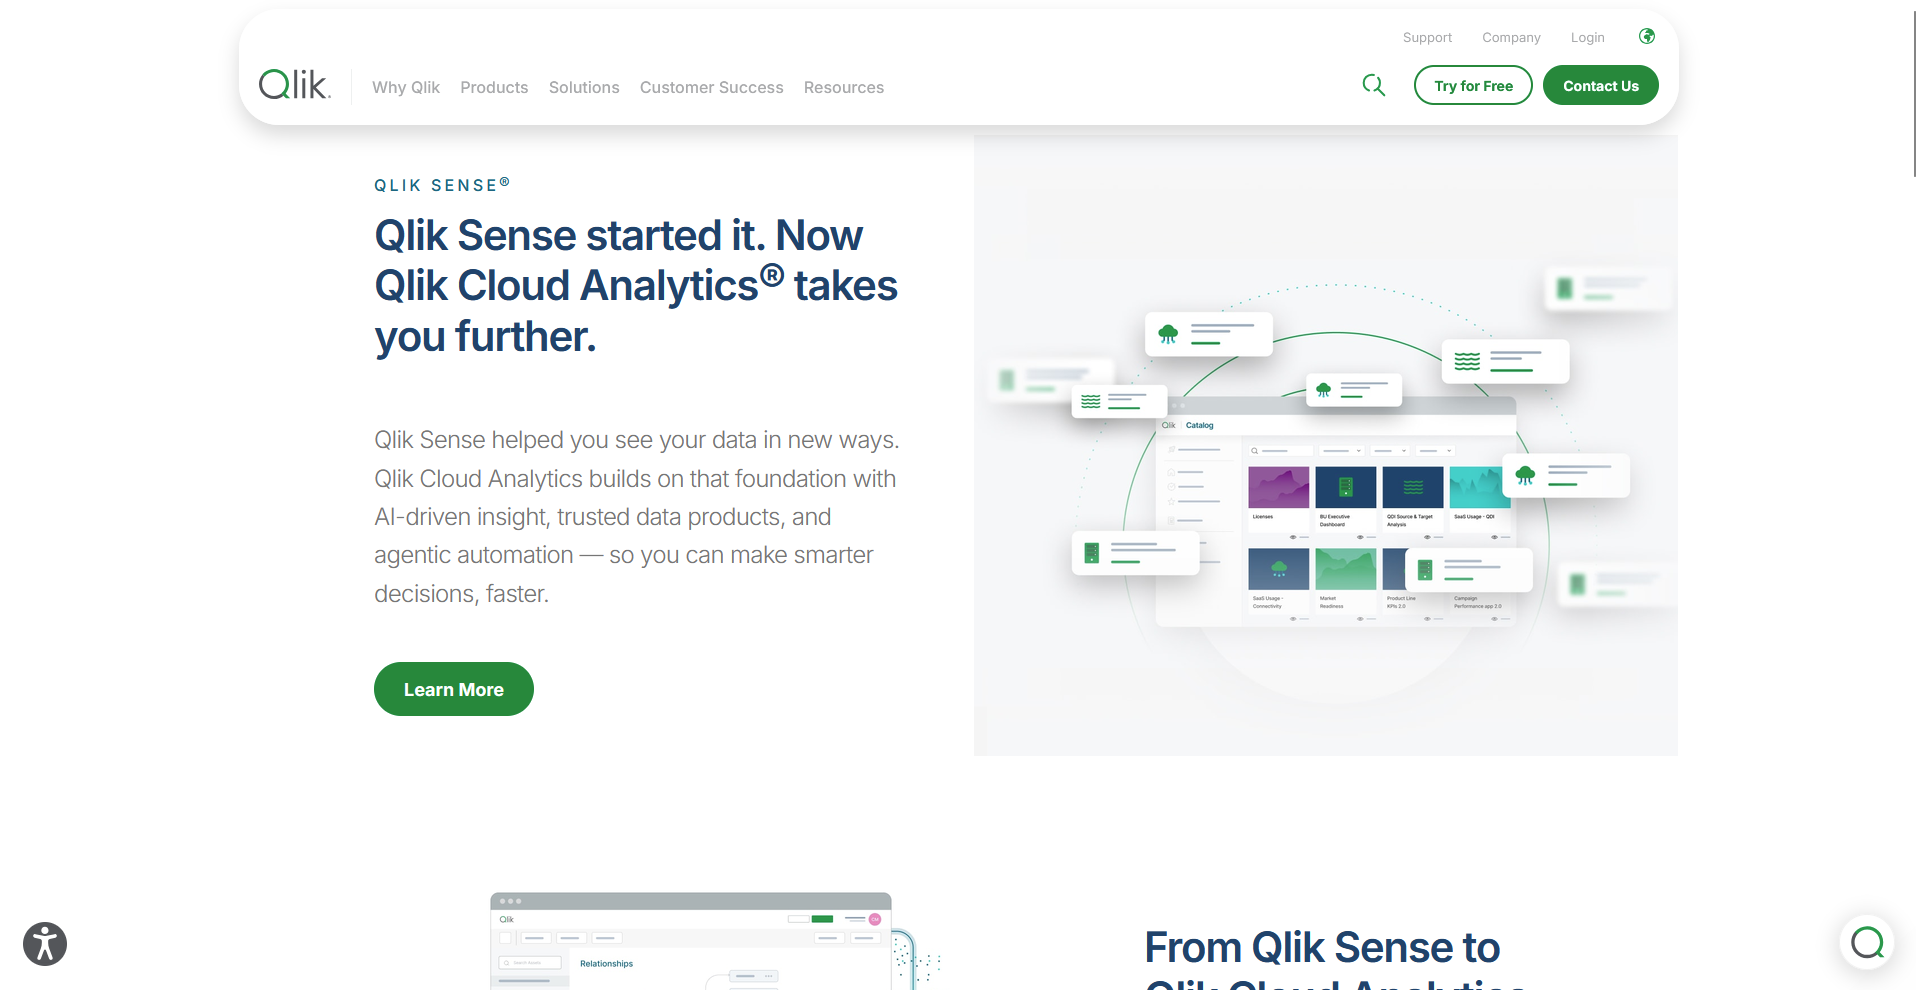
- What it does: Qlik Sense is a stand-alone analytics platform that uses an associative engine to link related data across tables and build interactive dashboards.
- Best for: Analysts who work across many related tables and want to click one value to see everything connected to it.
Qlik Sense links every field through an associative engine, so I tested it by loading sample sales data split into customer, product, and order tables, then clicking one region.
The value I clicked turned green, related values stayed white, and unrelated ones turned gray, so I could see connections I hadn't filtered for. Loading and linking the tables took me longer than building the charts did.
Key features
- Associative engine: Click any value to highlight related data across tables and gray out the rest.
- Insight Advisor: Search in natural language or chat to generate charts and analyses.
- Self-service chart building: Build charts from fields on a sheet with a drag-and-drop editor.
Pros and cons
| ✅ Pros | ❌ Cons |
| Business logic rules let admins define terms like revenue so Insight Advisor reads questions the same way each time | Tables link through fields that share the same name, so mismatched source data needs cleanup before the associations work |
| Design and formatting controls give dashboards a custom look | Custom formulas use Qlik's own expression syntax, so teams used to Excel or SQL need time to learn it |
| Advanced analytics integration connects to third-party data science and machine learning platforms |
What users say
Pro: “It helps to consolidate data from all kinds of data sources with short loading time and allow interactions with 3rd party software to automate repetitive operations.” (Verified User in Wholesale, G2)
Con: “Sometimes there are loading issues, especially when business intelligence is running updates. It can be an issue, usually on Mondays, from morning into late afternoon, when all my data is pulling in at once. I feel like at times additional resources could be allocated.” (Terrance M., G2)
Pricing
Qlik Sense starts at $300 per month and includes 10 users.
Bottom line
Qlik Sense pays off for analysts who spend their time exploring connected tables, as long as they plan the data setup first. Zoho Analytics could fit better if your team wants a quicker start and already uses Zoho apps.
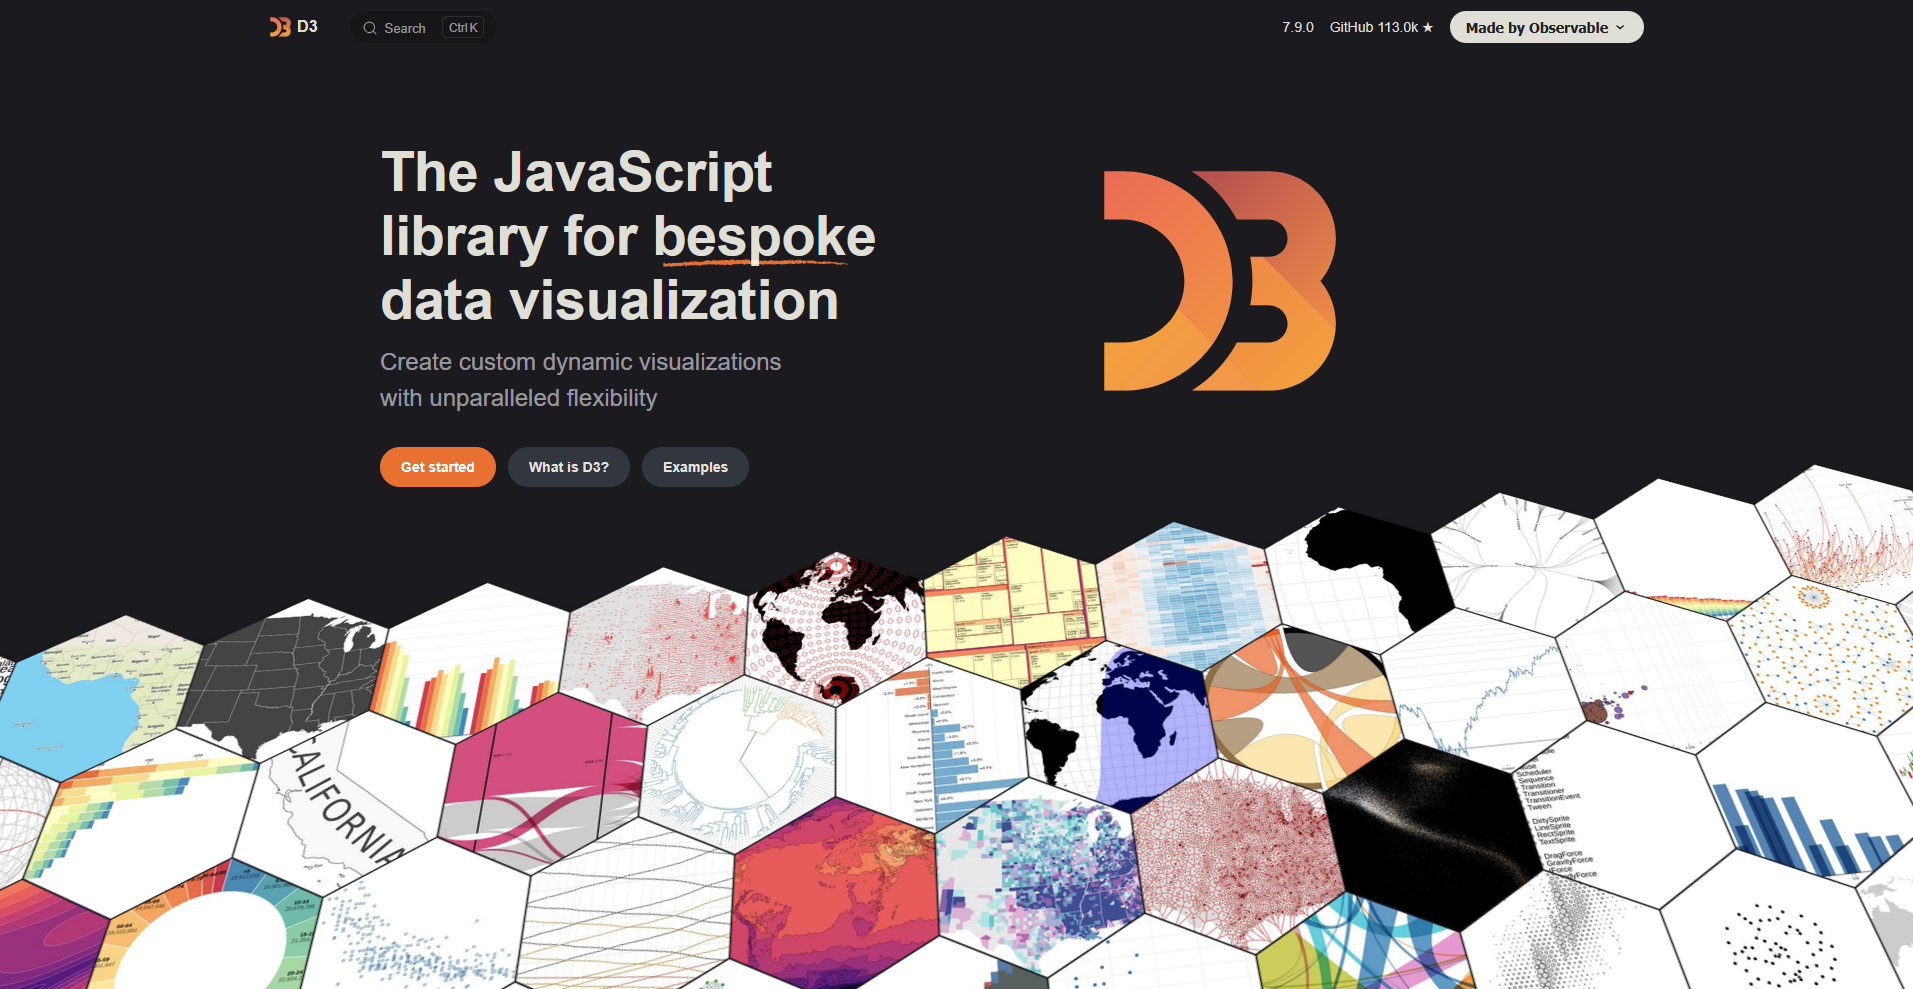
6. D3.js: Best for custom, animated web visuals
- Type: Code library
- What it does: D3.js is an open-source JavaScript library that binds data to page elements and draws custom charts and animations in the browser.
- Best for: Developers and data journalists who build one-of-a-kind interactive charts for websites.
D3.js binds data to page elements and leaves the drawing to you, so I tested it by building an animated bar chart from a small CSV file to see how much code one chart takes.
I wrote the scales, axes, and bars by hand, and a smooth transition between two datasets took one extra block. The simple chart still needed dozens of lines of code, and I had to look up how scales work before the bars lined up.
Key features
- Data binding: Bind data to page elements so the chart updates when the data changes.
- Custom visuals: Build charts from SVG, Canvas, or HTML elements.
- Transitions: Animate changes between chart states with built-in transitions.
Pros and cons
| ✅ Pros | ❌ Cons |
| A large community shares examples online, so most chart types have a starting point | Charts drawn with thousands of SVG elements can slow down, so big data work often means switching to Canvas |
| Charts can sit inside a reusable component in frameworks like Angular | Responsive resizing, tooltips, and accessibility features have to be built by hand |
| The library is split into small modules, so a project can load only the parts it uses |
What users say
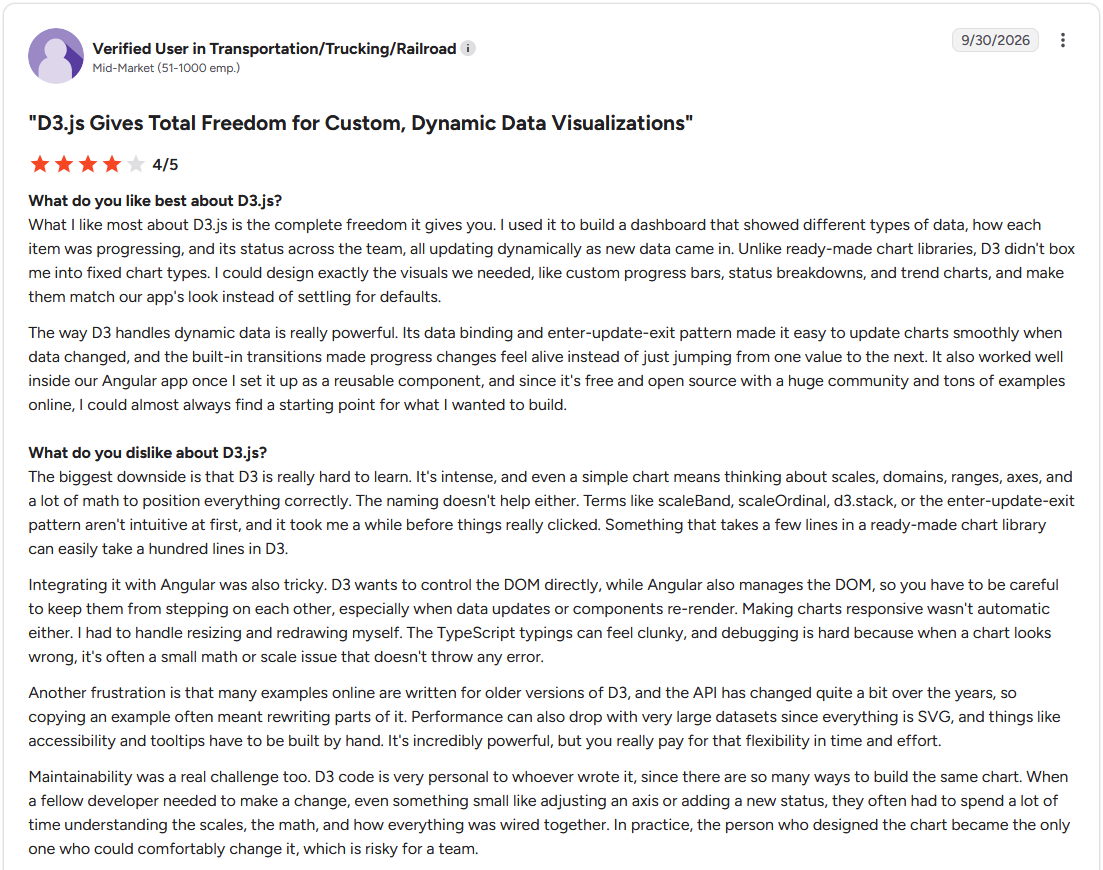
Pro: "What I like most about D3.js is the complete freedom it gives you. I used it to build a dashboard that showed different types of data, how each item was progressing, and its status across the team, all updating dynamically as new data came in." (Verified User in Transportation/Trucking/Railroad, G2)
Con: "The biggest downside is that D3 is really hard to learn. It's intense, and even a simple chart means thinking about scales, domains, ranges, axes, and a lot of math to position everything correctly. ... Performance can also drop with very large datasets since everything is SVG, and things like accessibility and tooltips have to be built by hand." (Verified User in Transportation/Trucking/Railroad, G2)
Pricing
D3.js is free and open source.
Bottom line
D3.js is worth the coding time when a visual has to be one of a kind. Chart.js could save you that work if you only need standard bar, line, and pie charts.
7. Google Charts: Best for quick embedded site charts
- Type: Code library
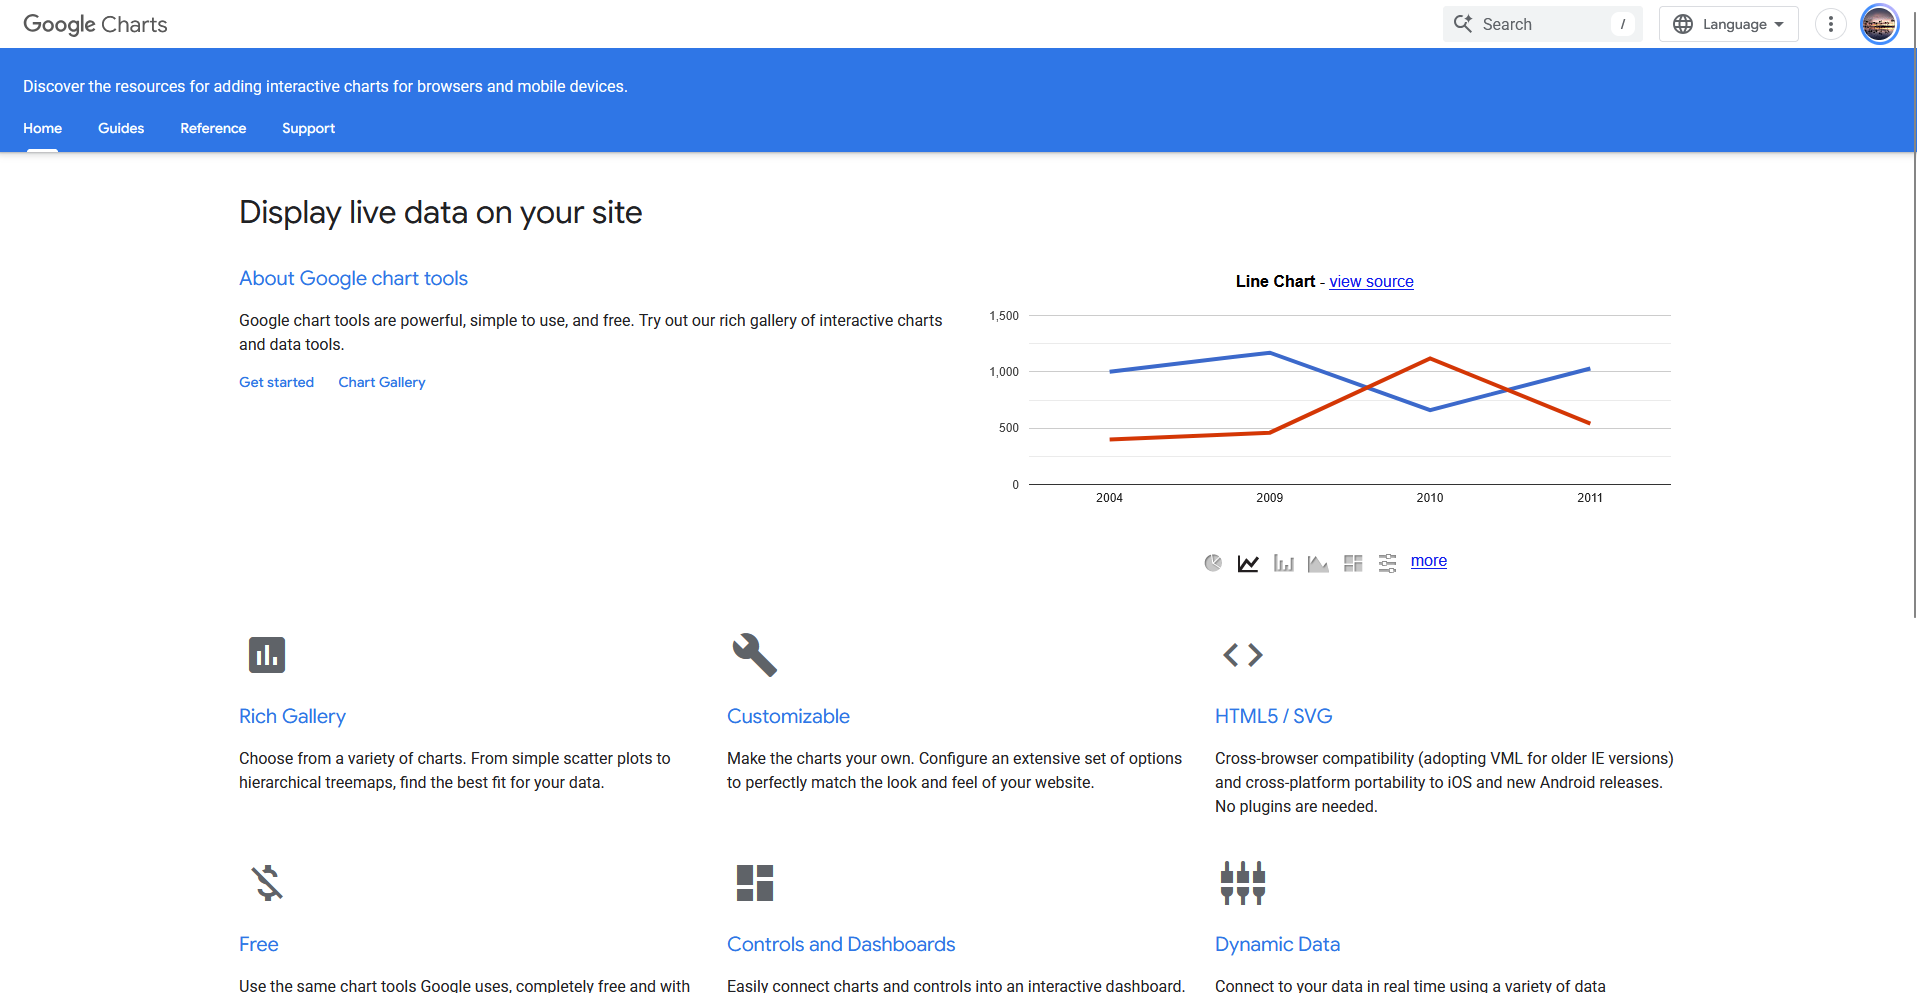
- What it does: Google Charts is a JavaScript charting library from Google that draws interactive charts in web pages from a data table or a Google Sheet.
- Best for: Site owners and developers who want a working chart on a page by loading one script and pointing it at a data table.
To see how quickly Google Charts could put a chart on a web page, I loaded the library into a blank HTML file and drew a column chart from a small data table.
It took one loader script, a short load call, and about 20 lines of code, and the hover tooltips worked without extra setup from me. Styling beyond the built-in options took more effort than the chart itself.
Key features
- Chart gallery: Draw common chart types, including bar, line, pie, geo, and timeline charts.
- Package loader: Load only the chart packages a page needs.
- Data sources: Read data from a Google Sheet or a JavaScript data table.
Pros and cons
| ✅ Pros | ❌ Cons |
| Google's developer site includes documentation and code samples for each chart type | Each chart draws in the browser, so pages with large datasets need the data trimmed or summarized first |
| Charts run in the browser with no plugin to install | Google's terms don't allow hosting the library yourself, so charts need an internet connection to draw |
| Built-in events and dashboard controls let one chart filter another, such as a date slider updating a bar chart |
What users say
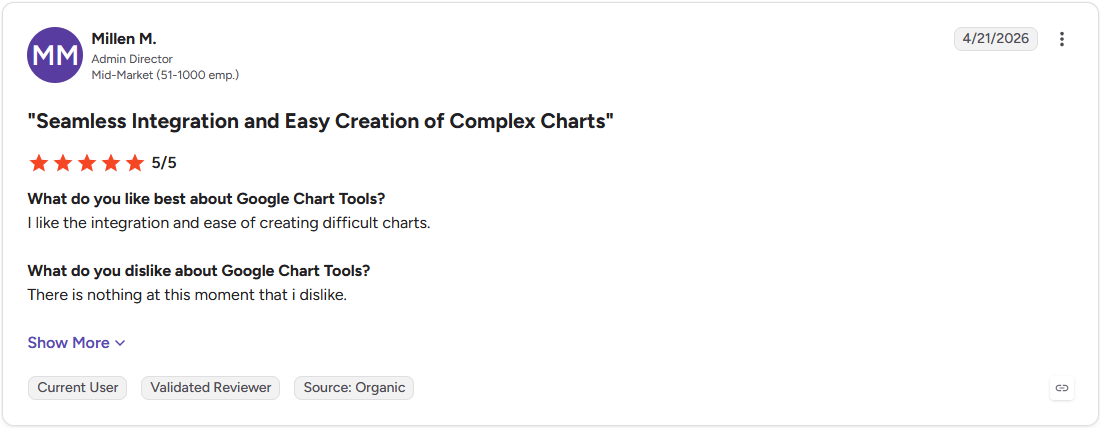
Pro: "I like the integration and ease of creating difficult charts." (Millen M., G2)
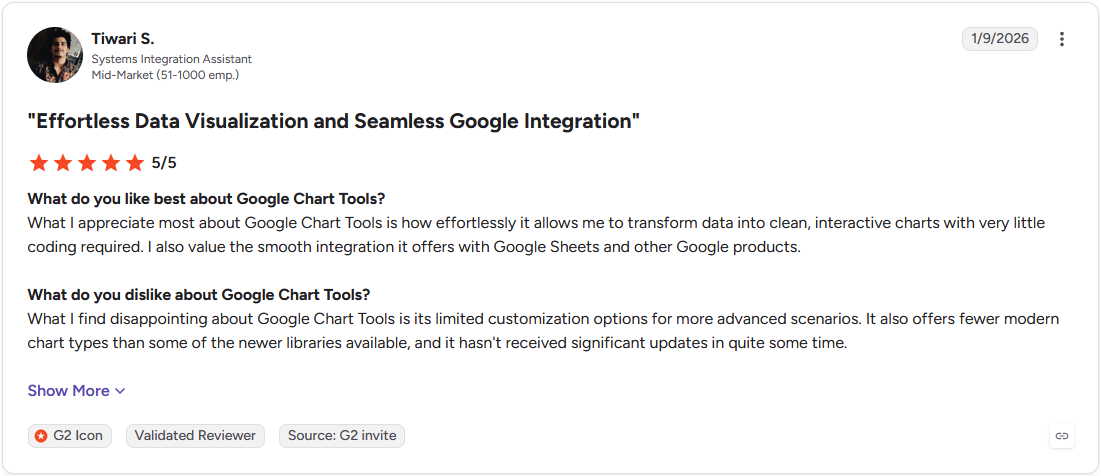
Con: "What I find disappointing about Google Chart Tools is its limited customization options for more advanced scenarios. ... it hasn't received significant updates in quite some time." (Tiwari S., G2)
Pricing
Google Charts is free to use.
Bottom line
Google Charts gets simple charts onto a small site or internal page with little effort. Highcharts deserves a look if your charts need to draw many thousands of points.
8. Plotly: Best for interactive charts in data science code
- Type: Code library
- What it does: Plotly is an open-source graphing library for Python, R, and JavaScript that draws interactive charts from code.
- Best for: Data scientists and analysts who already work in Python or R and want interactive charts inside notebooks and web apps.
I tested Plotly by charting a sample sales dataset in a Python notebook to see how much code an interactive chart takes. A line chart with hover labels, zoom, and a range slider took a handful of lines with Plotly Express, and it rendered inside the notebook. Adding a second y-axis took more trial and error than the whole first chart.
Key features
- Plotly Express: Create common charts, such as line, bar, and scatter plots, with a single function call.
- 3D and statistical charts: Draw 3D surfaces, box plots, and heatmaps from the same library.
- Dash apps: Wrap charts in a Python web app with Dash, Plotly's companion framework.
Pros and cons
| ✅ Pros | ❌ Cons |
| Charts share one JSON-based format across Python, R, and JavaScript, so a figure can move between languages | Sharing a chart as a live web app means learning Dash, a separate framework |
| WebGL traces, such as scattergl, are built for larger point counts than the default SVG traces | Exported interactive charts embed the data and the plotly.js library, so HTML files grow large |
| The core library is open source, so it's free to use in commercial projects |
What users say
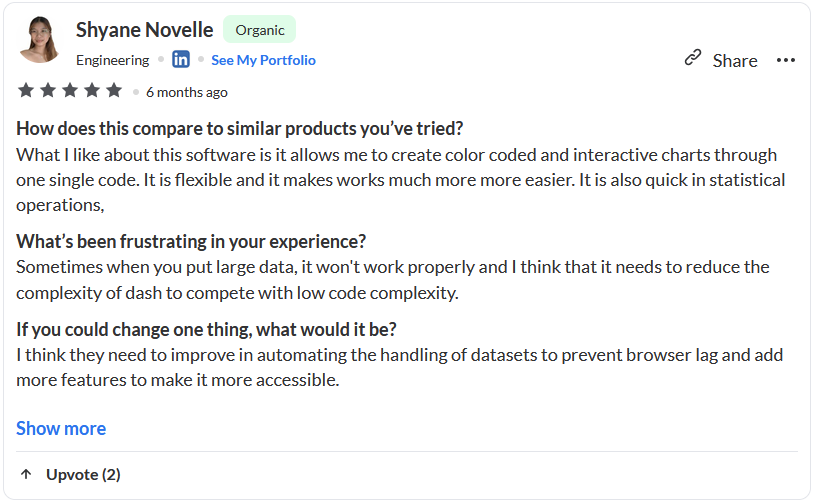
Pro: "What I like about this software is it allows me to create color coded and interactive charts through one single code." (Shyane N., Subscribed.fyi)
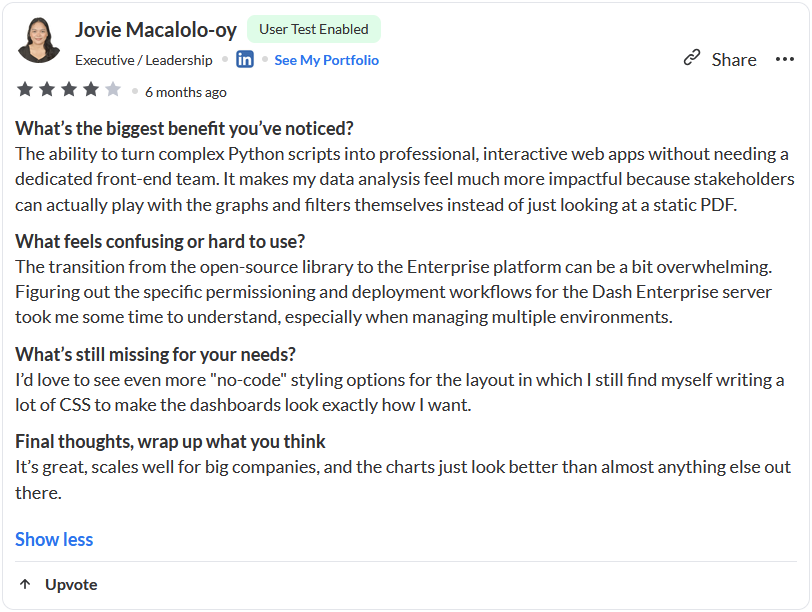
Con: "I'd love to see even more 'no-code' styling options for the layout in which I still find myself writing a lot of CSS to make the dashboards look exactly how I want." (Jovie M. Subscribed.fyi)
Pricing
Plotly starts at $290 per creator seat per year.
Bottom line
Plotly fits data scientists who already write Python or R, since a working interactive chart takes only a few lines. D3.js might be the next step if you want to design every visual element yourself.
9. Highcharts: Best for customer-facing dashboards
- Type: Code library
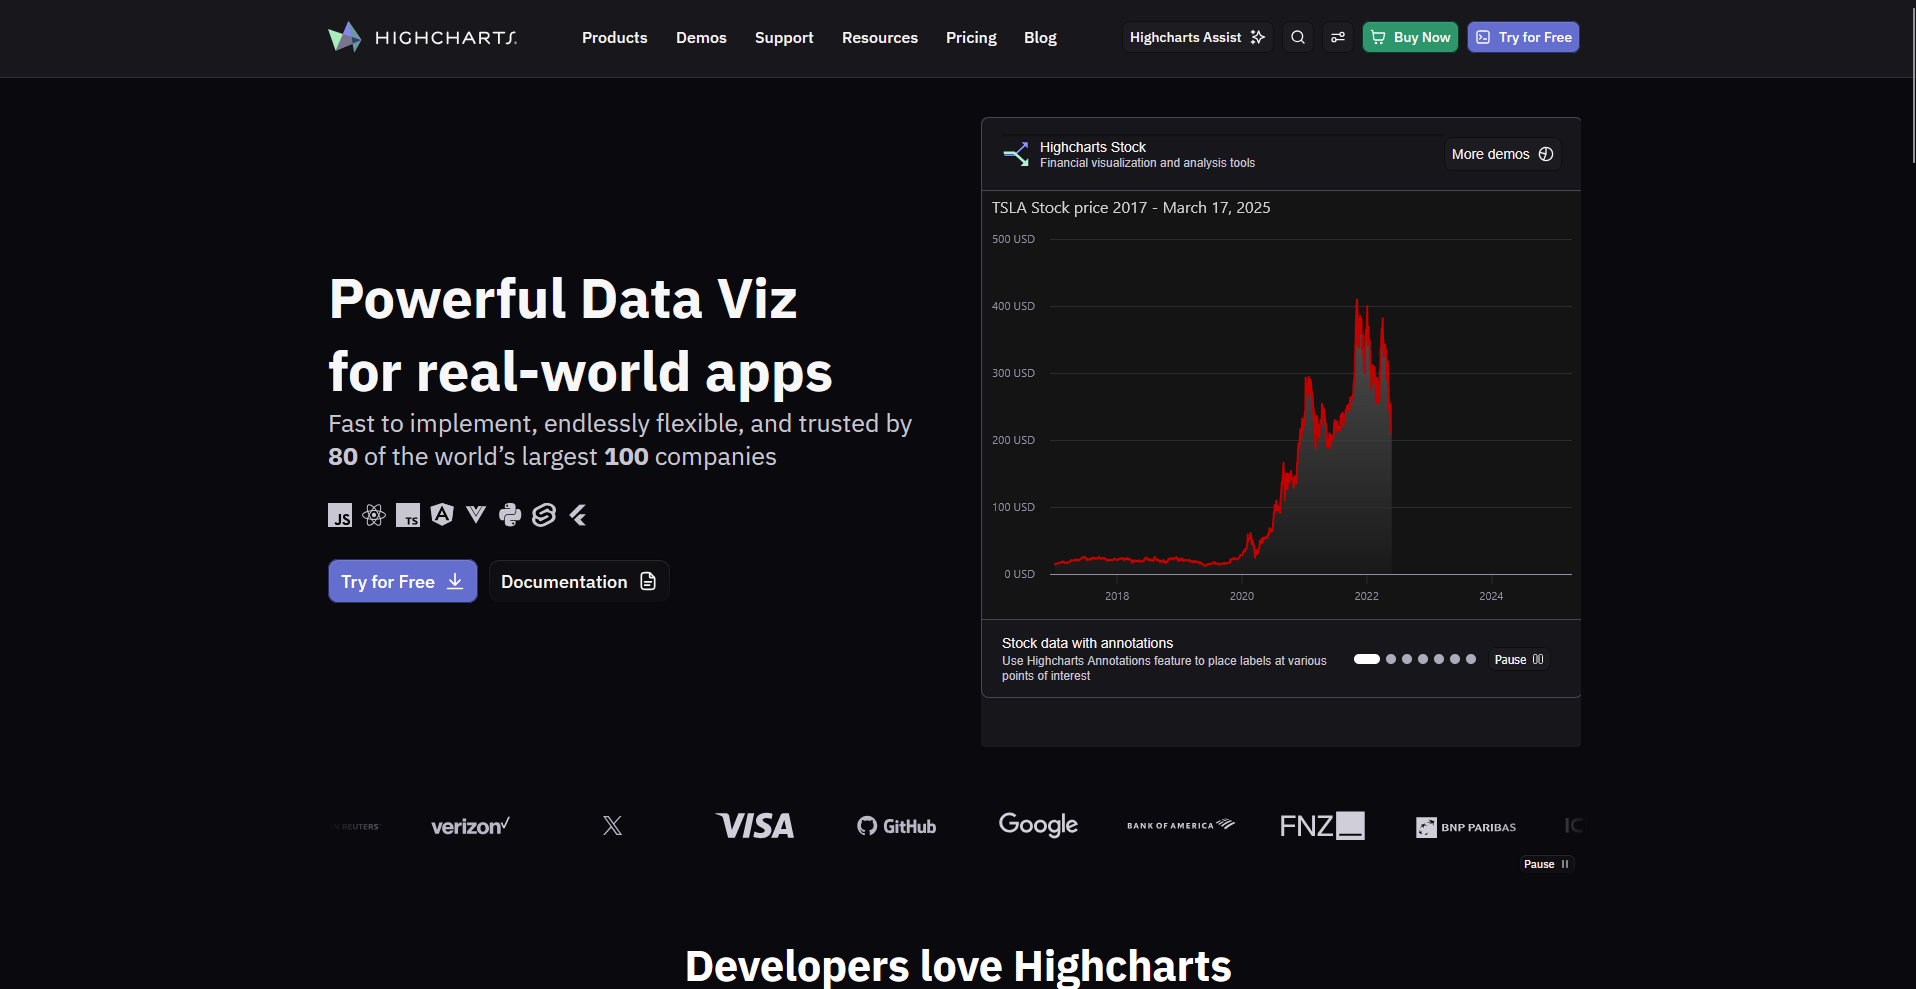
- What it does: Highcharts is a commercial JavaScript charting library that draws interactive charts and dashboards in web applications from a configuration object.
- Best for: Product teams that embed interactive charts in software and client portals, with export and accessibility options built in.
Highcharts builds each chart from one options object, so I tested it by plotting a long sample time series with the Boost module on to see how it handles a high point count.
Zooming ran smoothly, and changing one line of options turned the line chart into a column chart. Restyling a single bar meant overriding a drawing function, and that took more digging than the rest of the setup.
Key features
- Boost module: Render large point counts with WebGL.
- Export options: Download charts as PNG, JPEG, SVG, or PDF files, or print them.
- Responsive rules: Change chart options based on the size of the container.
Pros and cons
| ✅ Pros | ❌ Cons |
| The accessibility module adds keyboard navigation and screen reader support to charts | Highcharts has no drag-and-drop editor, so every chart needs a developer to write the code |
| Official wrappers cover React, Angular, Vue, and other frameworks | Data grouping and cleanup happen in your own code, since Highcharts only draws the data you pass it |
| Companion products for stock, map, and Gantt charts use the same API |
What users say
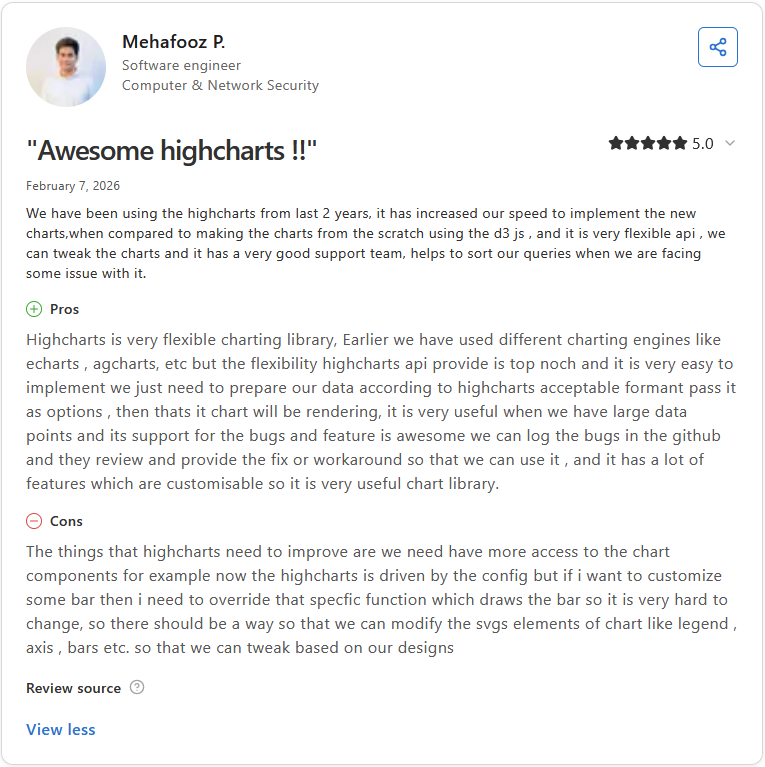
Pro: "It is very useful when we have large data points, and its support for the bugs and feature is awesome. We can log the bugs in the github and they review and provide the fix or workaround so that we can use it." (Mehafooz P., Capterra)
Con: "Now Highcharts is driven by the config but if i want to customize some bars then I need to override that specific function which draws the bar, so it is very hard to change." (Mehafooz P., Capterra)
Pricing
Highcharts starts at $366 per seat per year.
Bottom line
Highcharts matches products where customers view the charts, because export and accessibility options come built in. Julius could be an easier starting point for internal reports if nobody on your team writes JavaScript.
10. Chart.js: Best for common charts in web apps
- Type: Code library
- What it does: Chart.js is an open-source JavaScript charting library that draws charts on an HTML5 canvas from a short configuration object.
- Best for: Front-end developers who add bar, line, and pie charts to dashboards and web pages with a small amount of code.
To see how Chart.js handles a bigger dataset on a web page, I plotted a line chart with several thousand points from a sample CSV and turned on the decimation plugin.
The chart drew after one script tag, a canvas element, and a short config block, and hovering over points stayed responsive for me. Decimation samples the data before drawing, so I had to check that no small spikes went missing.
Key features
- Canvas rendering: Draw charts on an HTML5 canvas to avoid creating thousands of SVG elements in the page.
- Core chart types: Create bar, line, pie, doughnut, radar, polar area, bubble, and scatter charts.
- Data decimation: Sample large line chart datasets to reduce the number of points drawn.
Pros and cons
| ✅ Pros | ❌ Cons |
| The MIT license allows free use in commercial projects | Canvas drawing doesn't accept CSS styling, so a custom look needs built-in options or a plugin |
| Mixed charts combine chart types, such as bars and a line, on the same canvas | Chart types beyond the built-in set rely on community-maintained plugins |
| Animations are on by default, so charts move on load with no extra code |
What users say
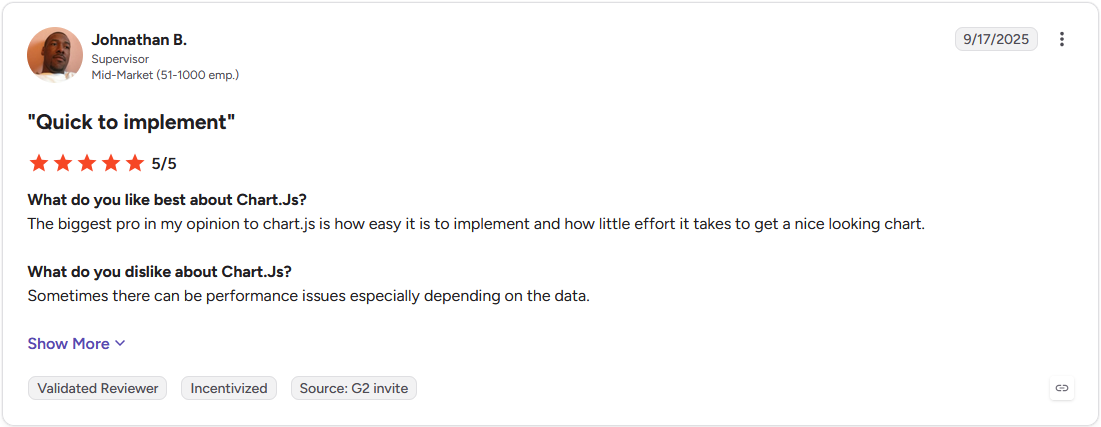
Pro: "The biggest pro in my opinion to chart.js is how easy it is to implement and how little effort it takes to get a nice looking chart." (Johnathan B., G2)
Con: "Sometimes there can be performance issues especially depending on the data." (Johnathan B., G2)
Pricing
Chart.js is free and open source.
Bottom line
Chart.js gets a standard chart into a web app with little code, though a custom design takes plugin work. Plotly may be a smoother path if your team writes Python.
11. Zoho Analytics: Best for small teams using Zoho apps
- Type: Cloud platform
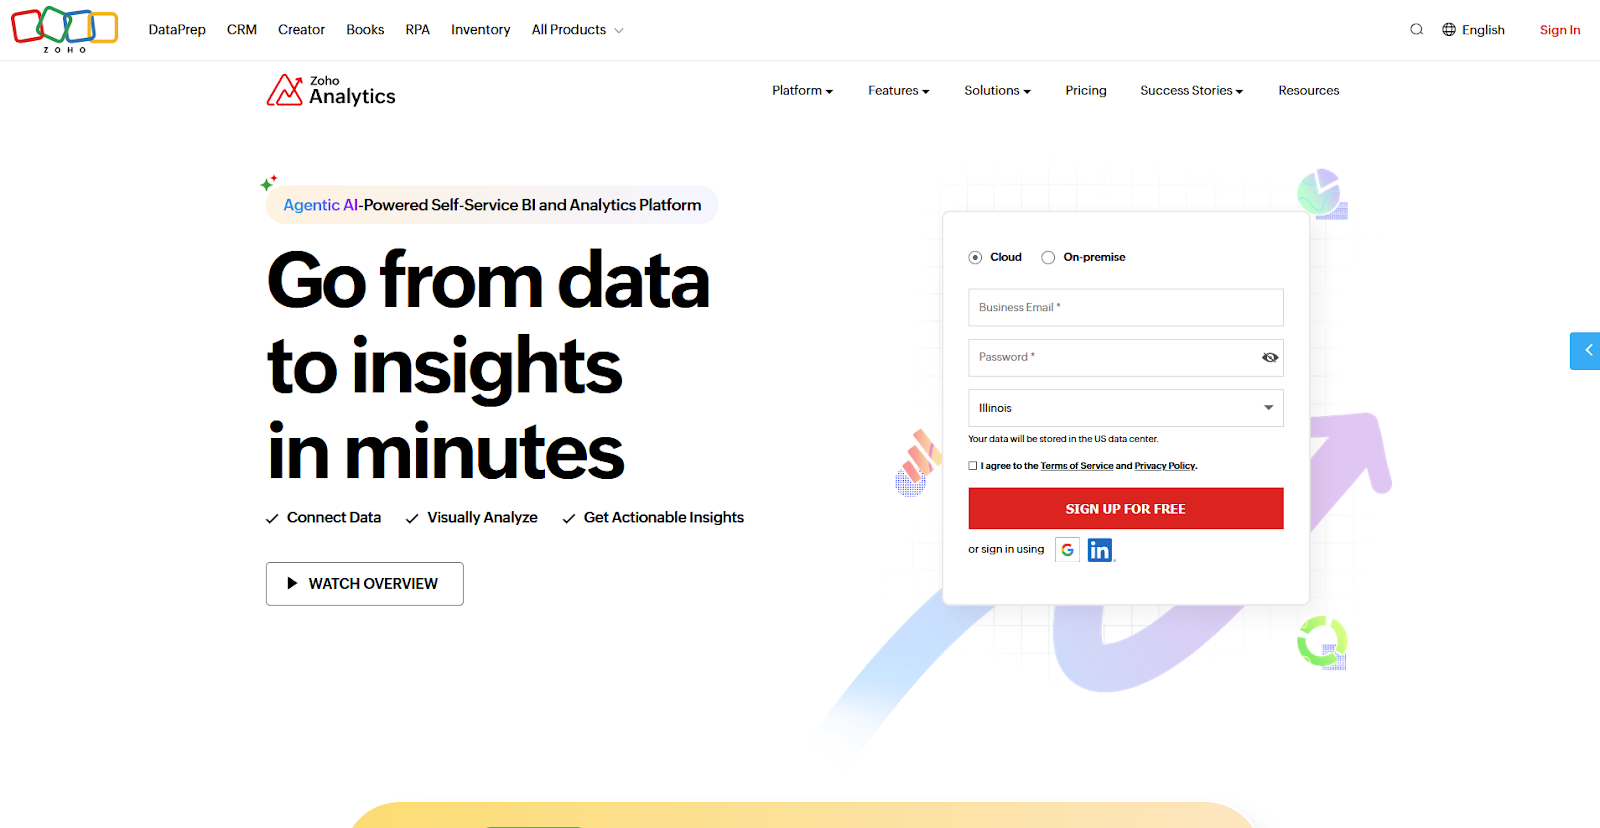
- What it does: Zoho Analytics is a cloud-based business intelligence platform that blends data from business apps, databases, and files into drag-and-drop reports and dashboards.
- Best for: Sales and marketing teams that run Zoho CRM and want prebuilt reports on that data.
Zoho Analytics ships prebuilt reports for connected Zoho apps, so I tested it by linking a sample Zoho CRM account to see how much came ready to use.
Once the sync finished, I had a full set of sales dashboards before I built a single chart, and I added one custom chart by dragging two fields onto the canvas. Pulling in data from outside Zoho took more setup than the CRM connection did.
Key features
- Business app connectors: Connect Zoho CRM and other business apps, and get prebuilt reports and dashboards for each connector.
- Ask Zia: Ask questions in natural language and get reports and KPI widgets back.
- Drag-and-drop builder: Build reports and tabbed dashboards from 80+ visualization options.
Pros and cons
| ✅ Pros | ❌ Cons |
| Data blending combines data from several business apps and files in a single report | Some of Ask Zia's newer AI features need the Premium or Enterprise plan, so check which plan includes the ones you want. |
| iPad and Android apps open reports and dashboards on a tablet | Business app data syncs on a schedule, so reports reflect the last sync |
| A free plan covers 2 users and 10,000 rows, so a small team can try Zoho Analytics before paying |
What users say
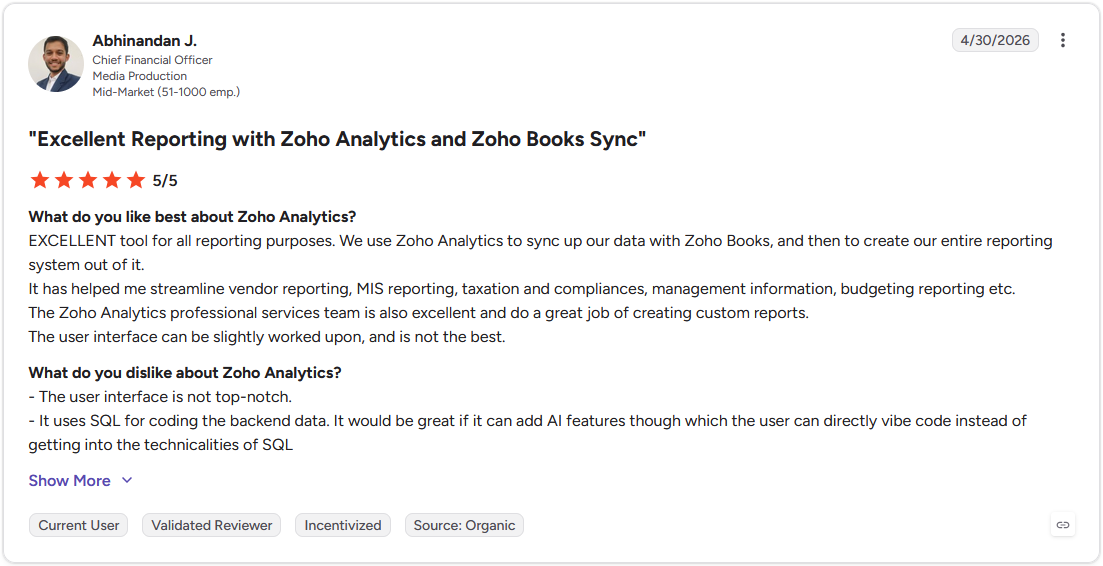
Pro: "Excellent tool for all reporting purposes. We use Zoho Analytics to sync up our data with Zoho Books, and then to create our entire reporting system out of it." (Abhinandan J., G2)
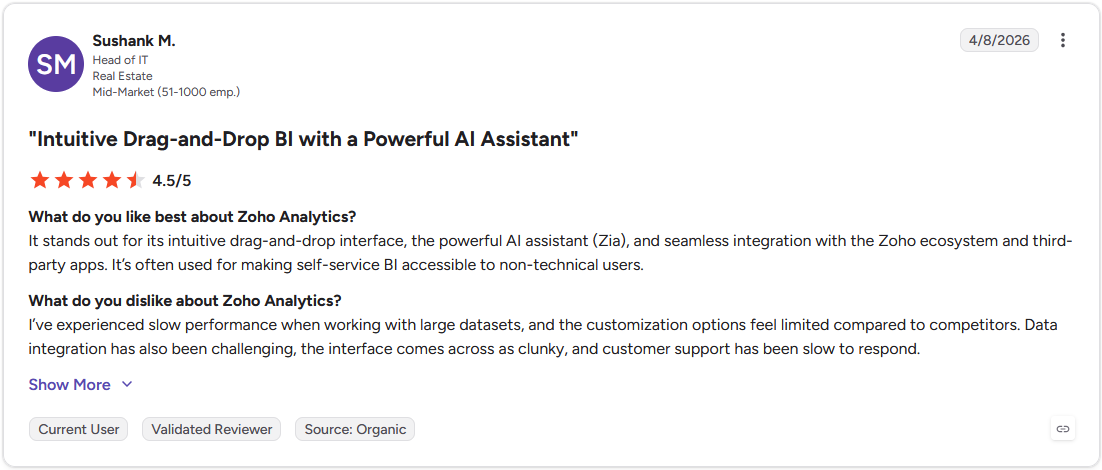
Con: "I've experienced slow performance when working with large datasets, and the customization options feel limited compared to competitors. Data integration has also been challenging, the interface comes across as clunky, and customer support has been slow to respond." (Sushank M., G2)
Pricing
Zoho Analytics starts at $24 per month for the cloud version.
Bottom line
Zoho Analytics makes the most sense when your sales and marketing data already sits in Zoho apps. Looker Studio may be a quicker route if your reports pull mostly from Google data.
12. FusionCharts: Best for embedding charts and maps in web apps
- Type: Code library
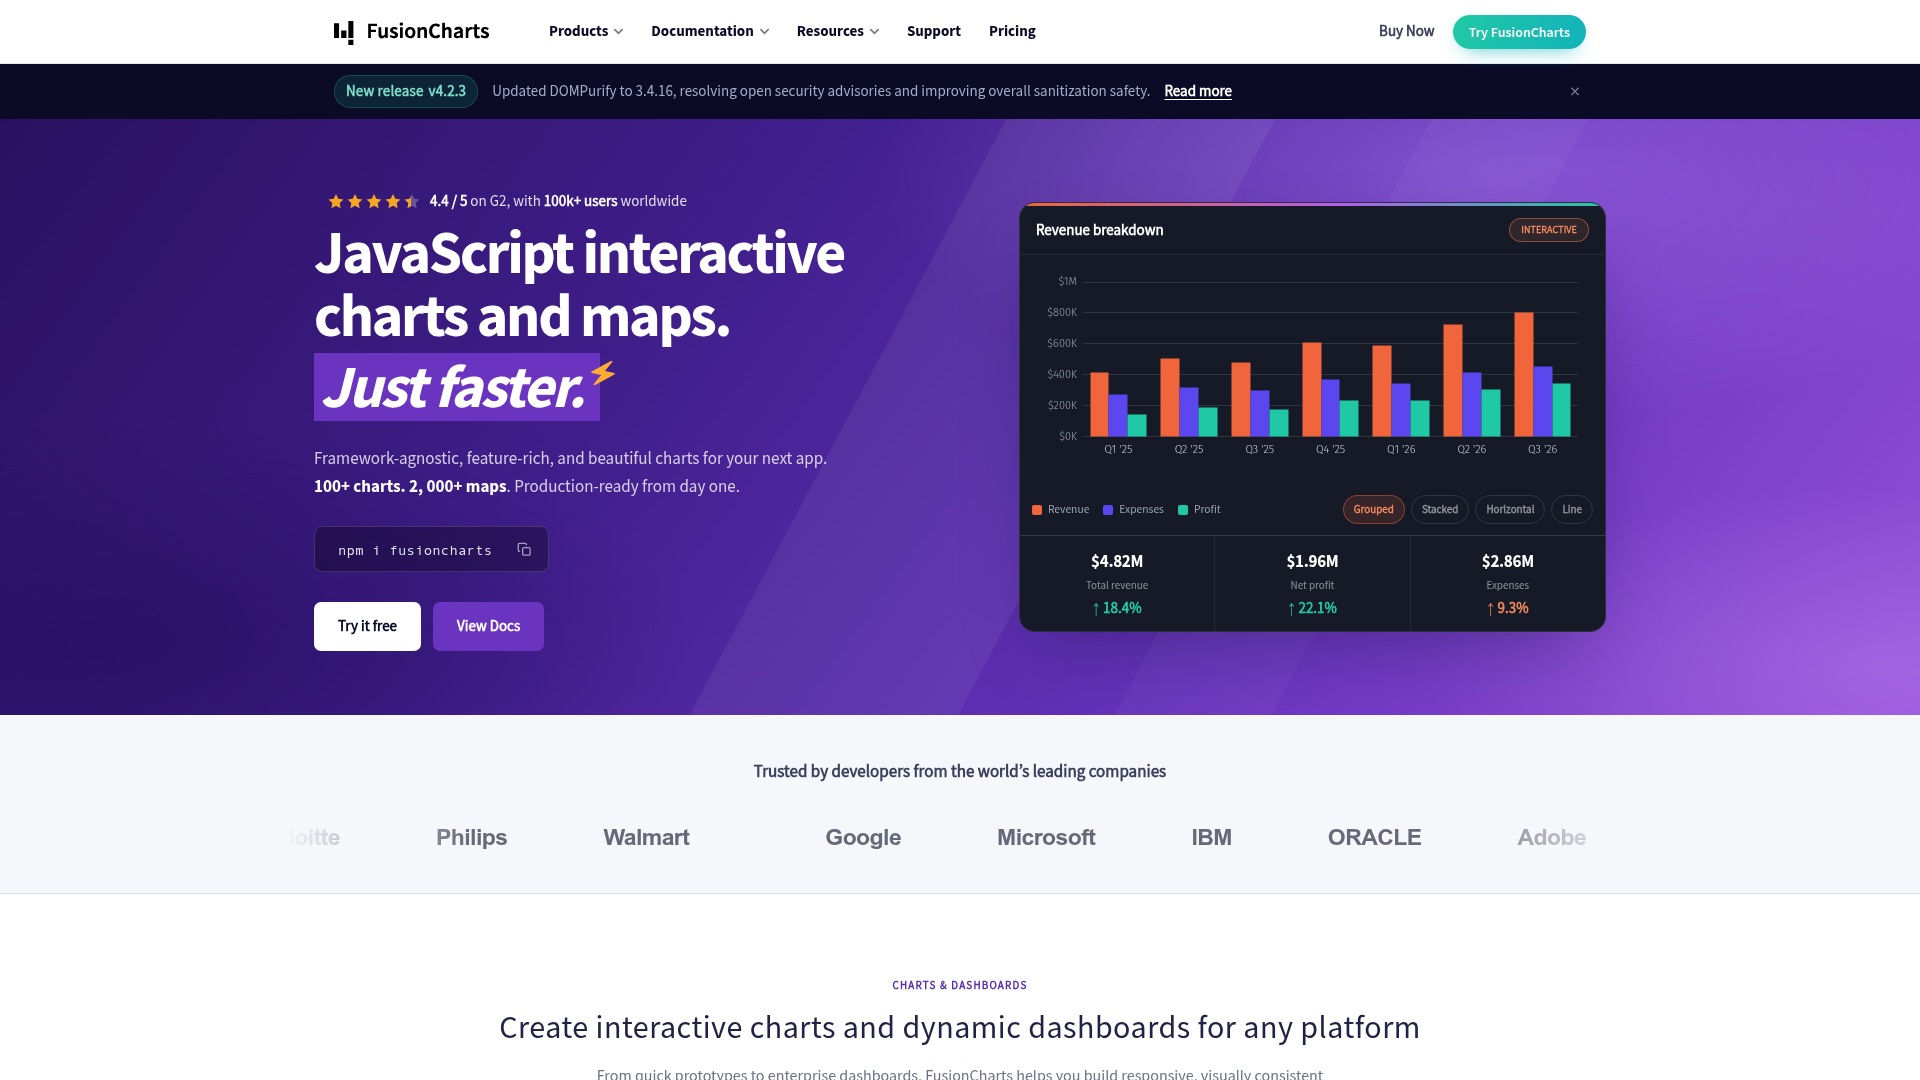
- What it does: FusionCharts is a commercial JavaScript charting library that renders interactive charts, gauges, and maps in web and mobile apps from a configuration object, with wrappers for React, Angular, and Vue.
- Best for: Development teams that need a large catalog of chart and map types in a product, with framework support and export built in.
FusionCharts builds each visual from a JSON configuration, so I tested it by rendering a column chart and a regional map from one sample dataset to see how far the catalog stretched. Swapping the column chart for a stacked bar meant changing a single “type” value, and the map picked up my data without extra setup. Matching the charts to a brand palette took more work, since the default themes needed custom styling before they looked finished.
Key features
- 95+ chart types and 1,400+ maps: Cover standard charts, gauges, and geographic maps from one library.
- Framework wrappers: Drop charts into React, Angular, or Vue projects with official integrations.
- Export options: Download charts as PNG, JPG, SVG, or PDF, or export a live dashboard to a file.
Pros and cons
| ✅ Pros | ❌ Cons |
| The large catalog of chart, gauge, and map types covers almost any visualization a product needs | A commercial license is required, starting at $1,899 per year for up to five developers, with no free tier for commercial use |
| Handles large and real-time datasets and renders them quickly | The library has a steeper learning curve for developers new to it |
| Framework wrappers and deep customization let charts match an app’s own look |
What users say
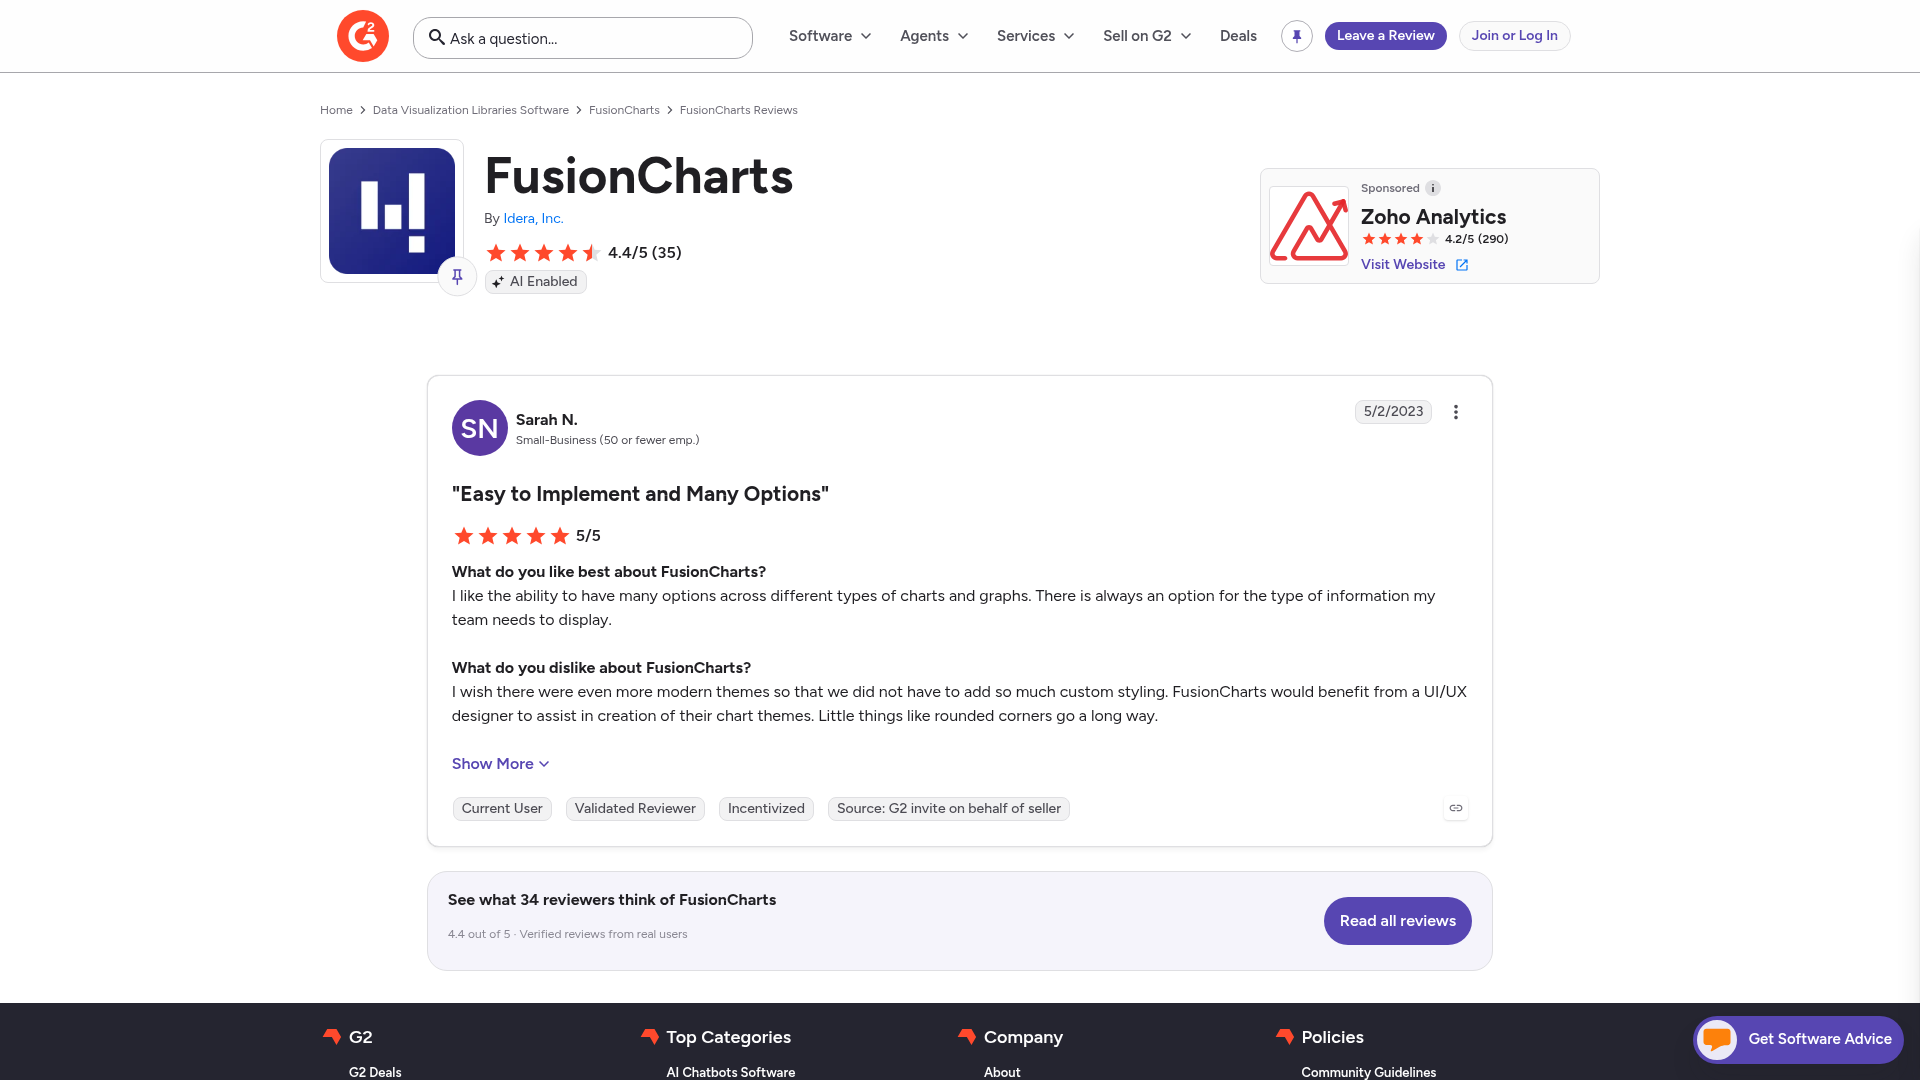
Pro: “I like the ability to have many options across different types of charts and graphs. There is always an option for the type of information my team needs to display.” (Sarah N., G2)
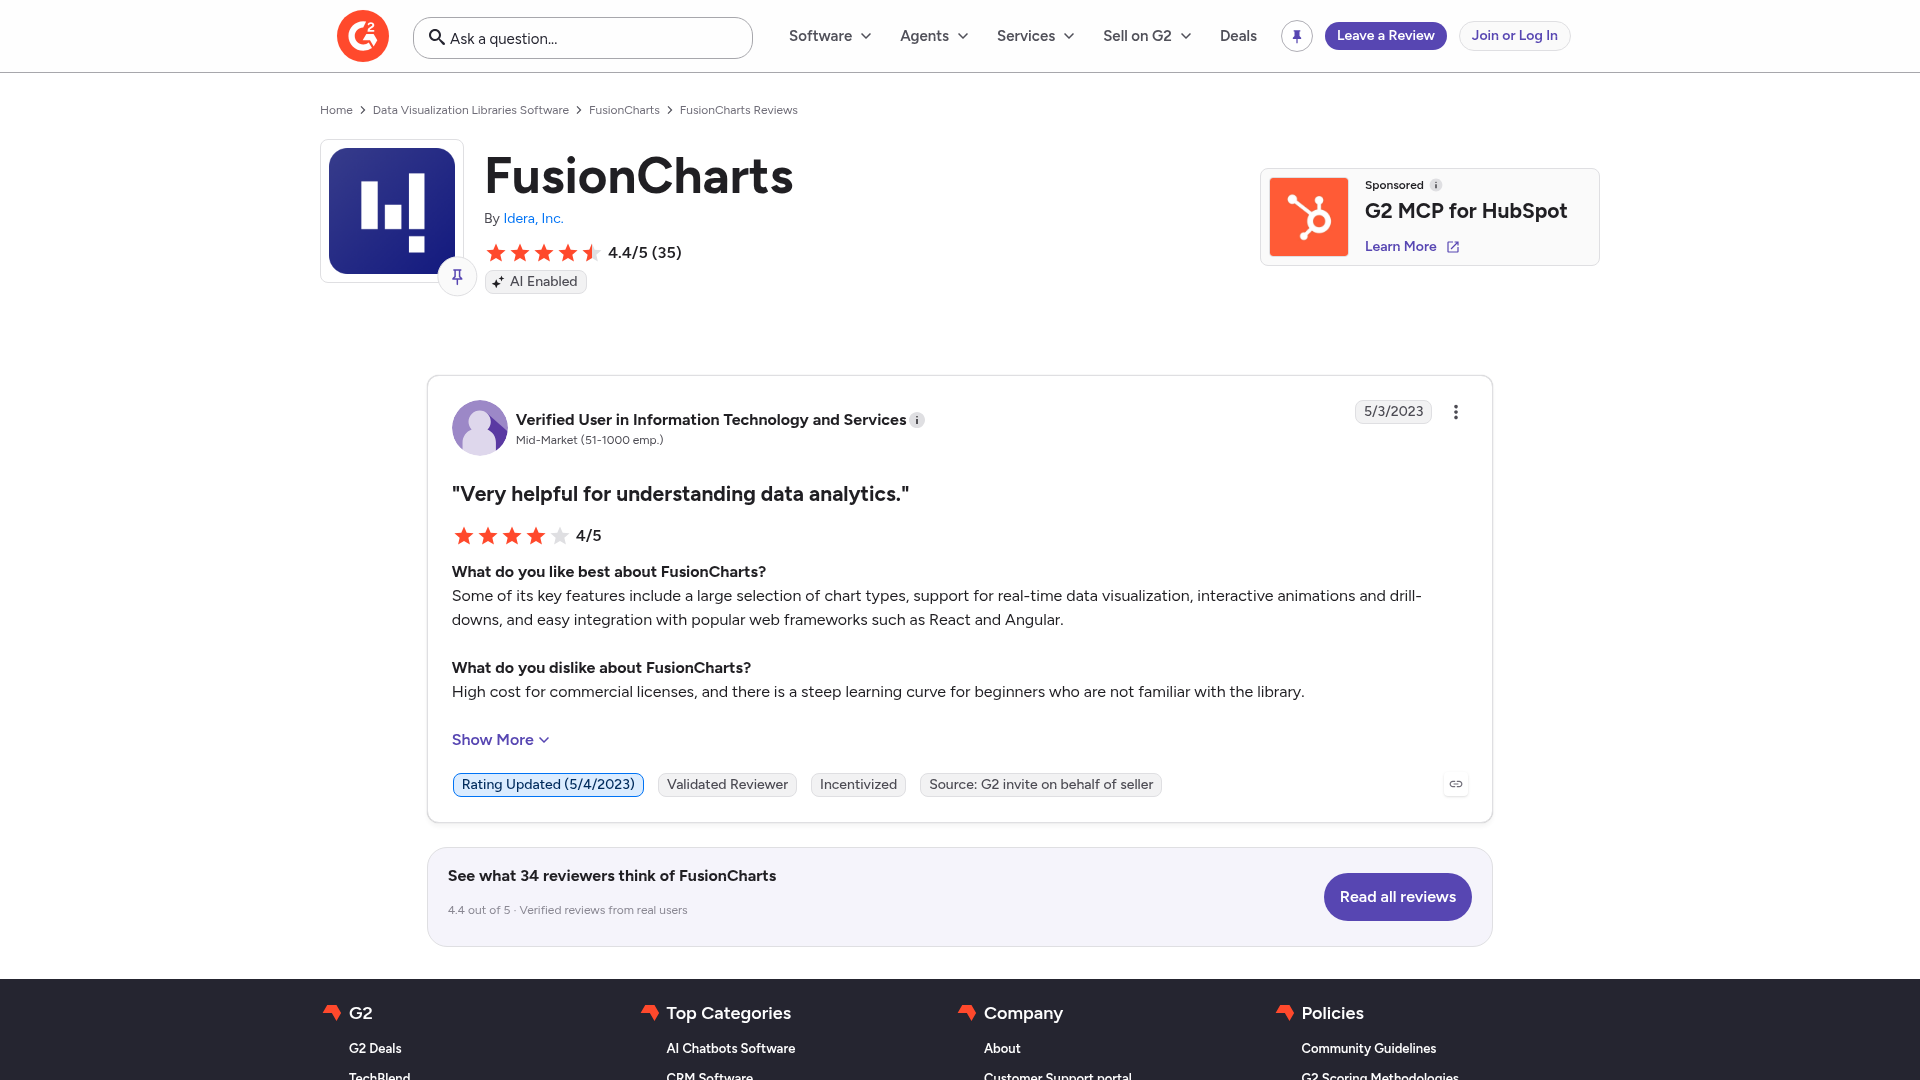
Con: “High cost for commercial licenses, and there is a steep learning curve for beginners who are not familiar with the library.” (Verified User in Information Technology and Services, G2)
Pricing
FusionCharts starts at $1,899 per year for up to five developers.
Bottom line
FusionCharts suits product teams that want one library for charts, gauges, and maps, as long as the commercial license fits the budget. Highcharts is worth comparing if accessibility or stock and Gantt charts matter more than map coverage.
How to choose the right big data visualization tool
Five criteria narrow these 12 tools down to the two or three worth a trial. Data volume gets the closest look, since tools handle larger datasets in very different ways. Consider:
- Data sources and integration: Start with where your data lives. Power BI reads Azure and SQL sources in place, and Looker Studio connects to Google Analytics, Google Ads, and BigQuery.
- Technical skill level: Match the tool to the people who will use it. Tableau, Power BI, and Looker Studio build charts when you drag fields onto a canvas, and Julius builds them from typed questions. D3.js, Plotly, and Chart.js need someone who writes code.
- Collaboration and sharing: Think about who needs to open the results. Looker Studio shares reports by link, and Power BI publishes reports so coworkers can open them online. Code libraries only draw the chart, so the website or app that hosts it handles the sharing.
- Budget: Start with a free plan or trial, then price out your whole team before you commit. Per-user pricing adds up as more people build charts, and code libraries cost developer time. Check license terms too, since some free options cover only personal or school projects.
- Data volume and scale: Larger datasets slow some tools down, so check this before you commit.
💡Tip: If your data needs cleaning or combining before you chart it, our guide to big data processing tools covers 11 platforms that prepare it.
Can ChatGPT do data visualization?
Yes, ChatGPT can create basic data visualizations. Upload a spreadsheet, describe the chart you want, and its analysis tool will generate bar charts, line plots, histograms, and more, along with a short read on what the data shows.
The limits show up as your data grows. ChatGPT caps spreadsheet uploads at about 50 MB, and very large or messy files can still get partial results, so filter or split them before you upload.
💡Tip: Choosing the right chart matters. Check out our guide to data visualization techniques to see when each type works.
Which big data visualization tool should you choose?
The right choice depends on where your data lives and who builds the charts. Platforms suit teams that build charts by clicking, and code libraries suit teams with developers.
Choose Julius if you:
- Report from a database like Postgres, Snowflake, or BigQuery and prefer typing questions to writing queries
- Share one database connection across a team and want answers to get faster and more precise with use
- Face a security review that asks for SOC 2 Type 2 report
Choose Tableau if you:
- Present dashboards to executives and need layouts that look finished
- Have an analyst who sets up data connections and calculations for everyone else
- Publish a dashboard once and need it to refresh on a schedule
Choose Microsoft Power BI if you:
- Keep your data in Excel, SharePoint, or Azure
- Sign in with Microsoft work accounts and want colleagues to open reports through them
- Prefer reports that read Azure or SQL data in place through DirectQuery
Choose Looker Studio if you:
- Report on Google Analytics, Google Ads, and BigQuery data each week
- Share reports through a link and let several people edit the same report at the same time
- Start from a template layout for traffic and ad reports
Choose Qlik Sense if you:
- Explore data across many related tables and want one click to show what connects
- Rely on an admin to define business terms like revenue, so natural language questions read the same way each time
- Have time to plan the data model before building the first dashboard
Choose D3.js if you:
- Have a developer who will build each visual by hand in JavaScript
- Design a chart that has to be one of a kind, with custom animation
- Draw a modest number of points per chart, since thousands of SVG elements can slow a page down
Choose Google Charts if you:
- Add a working chart to a web page with one script tag and a data table
- Pull chart data from a Google Sheet
- Link charts so one filters another, such as a date slider updating a bar chart
Choose Plotly if you:
- Work in Python or R notebooks and want interactive charts from a few lines of code
- Move figures between Python, R, and JavaScript
- Plan to turn charts into a web app with Dash
Choose Highcharts if you:
- Show charts to your customers inside your own software
- Require keyboard navigation and screen reader support in every chart
- Build with React, Angular, or Vue and want official wrappers for it
Choose Chart.js if you:
- Add standard bar, line, or pie charts to a web app with little code
- Plot line charts with several thousand points and want decimation to sample them before drawing
- Combine chart types, such as bars with a line on the same canvas
Choose Zoho Analytics if you:
- Keep your sales data in Zoho CRM and want prebuilt reports on it
- Blend data from several business apps and files in a single report
- Check dashboards on an iPad or Android tablet
Skip this category entirely if:
- Your data fits in one spreadsheet and the built-in chart tools in Excel or Google Sheets already answer your question
- Your data volume has outgrown dashboards, so you need a warehouse or processing engine to store and prepare it before any chart tool helps
- You need a single chart once and a screenshot from a spreadsheet takes less time than learning a new tool
See your big data without the setup
Big data visualization tools help you spot the patterns, trends, and outliers that raw numbers hide. Julius shortens that path by letting you describe what you want to see in plain English, then building the charts and summaries you can hand straight to your team.
Here's how Julius helps:
- Data search: Ask a question and pull public or connected data into a usable dataset, including financial data on 17,000+ companies.
- Direct connections: Link Postgres, Snowflake, and BigQuery so your results reflect live data.
- Built-in visualization: Get histograms, box plots, and bar charts, right where you're working.
Ready to skip the spreadsheet and go straight to the insight? Try Julius for free today.
Frequently asked questions
What is big data visualization?
Big data visualization is the practice of turning large, complex datasets into charts, graphs, maps, or dashboards. It helps teams spot patterns, trends, and outliers that stay hidden in raw numbers or spreadsheets.
What is the best free big data visualization tool?
Some of the best free big data visualization tools include Looker Studio for business teams and D3.js, Chart.js, and Plotly for developers. Looker Studio connects natively to Google Analytics, Google Ads, and BigQuery. The three libraries are open source and need someone who writes code.
What is the difference between BI tools and data visualization tools?
BI tools cover the full analytics workflow, including data modeling, governance, and reporting, while data visualization tools focus on turning data into charts. Tableau and Power BI offer both in one platform, and libraries like D3.js and Chart.js only draw charts.
What are the top 5 data visualization tools?
The top 5 data visualization tools on this list are Julius, Tableau, Microsoft Power BI, Looker Studio (formerly Google Data Studio), and Qlik Sense. Julius builds charts from typed questions, while Tableau and Power BI build interactive dashboards for reporting teams. Looker Studio reports on Google data, and Qlik Sense explores connected tables.
What are the top 10 tools for big data analytics?
The top 10 tools for big data analytics and visualization on this list are Julius, Tableau, Microsoft Power BI, Looker Studio, Qlik Sense, D3.js, Google Charts, Plotly, Highcharts, and Chart.js. They cover platforms and code libraries.