

Open a financial model or a monthly report running five hundred rows deep, and you’ll probably want the detail tucked out of sight until you need it. That's what collapsing rows in Excel does: group a block of rows, click one button to fold them away, click another to bring them back.
I reach for this constantly to keep long reporting sheets from turning into a mid-meeting scroll marathon. By the end of this guide, you'll be able to fold a messy sheet into a clean summary and expand it again in a click.
What it means to collapse rows in Excel
Collapsing rows in Excel hides a group of rows from view using the Group feature, found on the Data tab. When you group rows, Excel adds small plus and minus buttons plus numbered level buttons (1, 2, 3) in the left margin, so you can fold a section away or bring it back whenever you need to.
Collapsing only changes what you see. Your formulas, subtotals, and cell references keep calculating exactly as before, whether a section is open or folded away.
That makes grouping the natural way to keep a long report or an Excel dashboard readable without deleting anything. It also beats plain hiding, because the plus and minus controls stay visible, so anyone who opens the file can see there's more to expand.
💡 Note: Grouping works on columns too. Swap Rows for Columns in the Group dialog, and everything above still applies.
Excel collapse rows: How to group and fold sections away
Grouping starts with picking the rows you want to hide. From there, it only takes a couple of clicks to fold them away and bring them back:
1. Select the rows you want to collapse
Grouping starts with picking the rows you want to hide. From there, it only takes a couple of clicks to fold them away and bring them back:
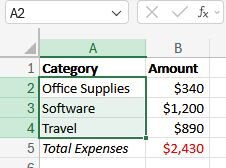
💡 Tip: Click the row numbers on the far left, not the cells, so you select the entire rows.
2. Group the selected rows
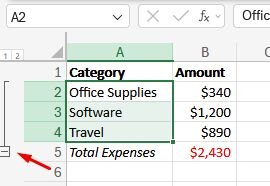
Go to the Data tab and click Group. Choose Group Rows from the dropdown. Excel draws a bracket down the left margin with a minus button at the bottom.

3. Collapse the group
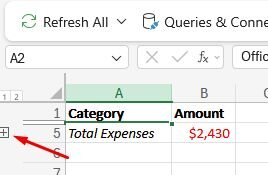
Click the minus (–) button at the bottom of the bracket in the left margin. The detail rows fold away, leaving you with the summary row and a plus button where the detail used to be.
 4. Expand the group again
Click the plus (+) button to bring the rows back.
 How to create nested, multi-level groups
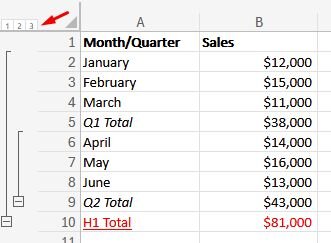
Real reports often have detail inside detail, like days inside months inside quarters. Excel handles that with nested groups, up to 8 levels deep.
Build nested groups from the inside out. Group the smallest blocks first (the months), collapse them, then select the wider range spanning those collapsed groups and group again (the quarters). Repeat as needed, but keep the 8-level limit in mind.
 Keyboard shortcuts to collapse and expand rows
Shortcuts speed up grouping once you're doing it across a large sheet. These cover the full workflow on Windows, Mac, and Excel for the web:
| ⌨️Task 🪟Windows 🍎Mac 🌐Excel for web | |||
| Group rows | Alt + Shift + Right Arrow | Command + Shift + K | Same as Windows/Mac |
| Ungroup rows | Alt + Shift + Left Arrow | Command + Shift + J | Same as Windows/Mac |
| Collapse a group | Alt + A + H | Command + Option + Left Arrow | Alt + Shift + Dash |
| Expand a group | Alt + A + J | Command + Option + Right Arrow | Alt + Shift + Equal sign |
| Show or hide outline symbols | Ctrl + 8 | Ctrl + 8 | Not supported |
To collapse or expand every group on the sheet at once, press Ctrl + A to select everything first, then use the collapse or expand shortcut.
💡 Tip: You can also automate repeated grouping with a macro in Excel.
How to ungroup or remove grouping
Removing groups is quick, but there's one catch worth knowing.
Expand the group first. If you ungroup while a section is collapsed, those rows stay hidden, and you'll have to unhide them by hand.
With the group open, select the grouped rows, go to Data, click Ungroup, and choose Ungroup Rows.

Faster grouping with Auto Outline and subtotals
If your sheet already has a clear structure, Excel desktop can build the groups for you automatically:
- Auto Outline: Click any cell in your data, go to Data, open the Group menu, and pick Auto Outline. Excel reads your subtotal and SUM formulas and groups the rows for you.
- Subtotal: Go to Data and click Subtotal to insert subtotal rows for each category and group them in one step. This works well for sales-by-region or spend-by-department reports.
Auto Outline is hit or miss. It fails when ranges overlap or blank rows break up your data. If it produces a mess, undo the grouping and try again on a cleaner range.
Keep in mind that Auto Outline and Subtotal aren't available in Excel for the web. This section applies to Excel desktop only.
💡 Tip: If Auto Outline still leaves you doing manual cleanup, try a few other options that skip the outline step.
Troubleshooting common collapse and grouping problems
Most grouping issues come down to a handful of repeat offenders. Check these when something doesn't behave the way you expect:
Heading row disappears when you collapse a group
This happens because Excel assumes your summary row sits below the detail by default, so it collapses the top row away with everything else.
On Excel desktop, go to the Data tab, click the small arrow in the bottom-right corner of the Outline section, and uncheck Summary rows below detail. Now Excel treats the row above each group as the summary, so your heading stays in place when you collapse.
💡 Note: Excel for the web doesn't have this setting. If you need this fix, open the file in Excel desktop, make the change there, and it'll carry over when you're back in web.
The plus and minus buttons aren't showing up
This happens because Excel assumes your summary row sits below the detail by default, so it collapses the top row away with everything else.
On Excel desktop, go to the Data tab, click the small arrow in the bottom-right corner of the Outline section, and uncheck Summary rows below detail. Now Excel treats the row above each group as the summary, so your heading stays in place when you collapse.
💡 Note: Excel for the web doesn't have this setting. If you need this fix, open the file in Excel desktop, make the change there, and it'll carry over when you're back in web.
You get an overlapping-group error when nesting
This happens when you group a wider range before the smaller range inside it. Undo, and rebuild from the inside out, smallest block first, as covered above.
Copied rows include hidden data
A collapsed group still copies its hidden rows by default. On Excel desktop, select the range, go to Find & Select, choose Go To Special, and pick Visible cells only, or use the Alt + ; shortcut. This will copy only the visible rows.
💡 Note: Excel for web doesn't have a way to copy only visible rows when a group is collapsed. Expand the group first, then copy only the specific rows you need.
Collapse rows vs. hide rows: which should you use?
Grouping is the better choice for almost every situation, since it keeps controls visible and stays reversible:
- ✅ Grouping: Reversible in one click, shows plus and minus controls, and survives being shared, since the next person can see there's hidden detail.
- ❌ Hiding: Manual, invisible, and easy to forget. Ship a file with hidden rows, and someone eventually finds data you meant to keep out of view.
When the spreadsheet outgrows manual cleanup
Grouping keeps a big sheet readable, and for most reports that's all you need. But if you're collapsing thousands of Excel rows just to make sense of them, the spreadsheet has outgrown manual data analysis. At that point, you're managing the view when you should be answering the question. Julius handles this kind of work well.
Julius is an AI-powered data analysis tool. You ask a question in plain English, and it runs the analysis and builds the charts to match, with no outlining or formulas needed.
Julius can help in a few ways:
- Data search: Start from a question without needing a file first. Julius pulls public web data or structured financials for 17,000+ companies through its Financial Datasets integration.
- Direct connections: Link PostgreSQL, Snowflake, or BigQuery, or upload the Excel file you were about to collapse.
- Built-in visualization: Ask for a summary, and Julius returns charts alongside it, so you skip the manual build.
- Learning Sub Agent: Julius picks up on your database structure and relationships as you go, so answers get faster and more precise the more you use it with connected data.
- One-click sharing: Turn any analysis into a clean PDF report you can send without reformatting.
Ready to stop wrestling the spreadsheet and go straight to the answer? Try Julius for free today.
Frequently asked questions
What is the shortcut to collapse rows in Excel?
The shortcut to collapse a group in Excel is Alt + A + H on Windows, Command + Option + Left Arrow on Mac, or Alt + Shift + Dash in Excel for web. Group the rows first with Alt + Shift + Right Arrow (Command + Shift + K on Mac), then use the collapse shortcut for your platform.
How do I collapse rows in Excel without grouping?
You can't get click-to-collapse controls without grouping, since the plus and minus buttons come from the Group feature. The only alternative is hiding rows with right-click and Hide, but that's manual and shows no controls, so grouping is the better choice.
Why can't I collapse rows in Excel?
You usually can't collapse rows if they were never grouped, or the outline symbols are hidden. Group the rows first through Data, then Group. On desktop, press Ctrl + 8 to bring hidden symbols back. This shortcut isn't available in Excel for web.
How many levels of grouping can Excel handle?
Excel handles up to 8 nested outline levels. You move between them using the numbered level buttons above the outline margin, where 1 collapses to the top summary and higher numbers reveal more detail underneath it.
Does collapsing rows delete or affect my data?
No, collapsing rows doesn't delete or change your data. It only hides rows from view, and regular formulas and references keep calculating exactly as before. One exception: SUBTOTAL functions using the 101-111 range exclude hidden rows, so collapsing a section can change that specific total.