
Minitab still works for statistical analysis and quality control. But its annual subscription can be expensive, especially if you only need a handful of statistical tests or charts.
We've reviewed eight alternatives based on their features, pricing, free-plan limits, and Six Sigma capabilities to help you find one that fits your needs.
Julius lets you upload datasets and run statistical tests using plain English. JMP offers dedicated Six Sigma tools, while JASP is a free option for control charts, process capability analysis, and more. Learn about all 8 alternatives in detail.
8 best Minitab alternatives: TL;DR
- Julius: Best for running statistical tests and creating charts from uploaded data using plain English.
- JMP: Best for engineers needing advanced Six Sigma and quality-control tools.
- JASP: Best free, point-and-click alternative for statistical analysis and Six Sigma.
- XLSTAT: Best for statistical analysis and quality checks inside Excel.
- EngineRoom: Best for guided Lean Six Sigma and process improvement projects.
- BlueSky Statistics: Best for R-based statistical analysis with a graphical interface.
- R with RStudio: Best free alternative for customizable statistical analysis using code.
- IBM SPSS Statistics: Best for researchers needing statistical testing and data preparation tools.
Why look for Minitab alternatives?
Minitab offers a wide range of statistical tools, including regression, ANOVA, control charts, process capability analysis, and design of experiments (DOE). It's particularly useful for manufacturing, engineering, and quality improvement projects.
However, a few limitations might make you consider alternatives:
- High subscription cost: Minitab Solution Center Core costs $2,394 per year for a single user. That's a significant investment if you only need basic statistical analysis.
- No permanent free plan: Minitab offers a free trial, but there's no ongoing free edition listed. Tools like JASP and R are better suited for users looking for free statistical software.
- Learning curve: Minitab's interface is relatively approachable, but advanced statistical and quality-control methods still take time to learn.
Your preferred workflow can also influence the decision. Some alternatives work directly inside Excel, some use code, and others let you analyze datasets through plain-English prompts.
How to evaluate Minitab alternatives
The best way to compare statistical analysis software is to test it with a dataset you already know. Before making the switch, consider these factors:
- Statistical capabilities: Check whether the software supports your required tests, control charts, Cp/Cpk, gage R&R, and DOE.
- Free-plan limitations: See which features require payment and whether subscriptions are billed monthly or annually.
- Ease of use: Consider whether you prefer a graphical interface, writing code, or entering plain-English prompts.
- Reproducibility: Check whether you can review calculations, save your analyses, and share results with your team.
8 best Minitab alternatives: Side-by-side comparison
| Tool | Starting price | Free plan | Interface | Six Sigma tools |
| Julius | $20/month | Yes, limited credits | Plain English | Custom analysis; no dedicated quality suite |
| JMP | $1,390/year | Academic users only | Point-and-click | SPC, Cp/Cpk, gage R&R, DOE |
| JASP | Free | Yes | Point-and-click | SPC, Cp/Cpk, gage R&R, DOE |
| XLSTAT | $380/year (Essentials, commercial) | 14-day trial | Excel add-in | SPC, capability, gage R&R; DOE in Advanced |
| EngineRoom | $495/year | 30-day trial | Point-and-click | SPC, Cp/Cpk, gage R&R, DOE |
| BlueSky Statistics | $495/year for Pro | Yes, basic statistics | Point-and-click | SPC, Cp/Cpk, gage R&R, DOE in Pro |
| R with RStudio | Free | Yes | Code | All four through R packages |
| IBM SPSS Statistics | $109/month | No, 14-day trial | GUI and syntax | SPC, capability; limited dedicated R&R/DOE |
The 8 best alternatives to Minitab
1. Julius: Best for plain-English statistical analysis
Julius lets you upload datasets, run statistical tests, and create charts using plain-English prompts. You can analyze Excel or CSV files, request an ANOVA or regression analysis, and ask follow-up questions about the results.
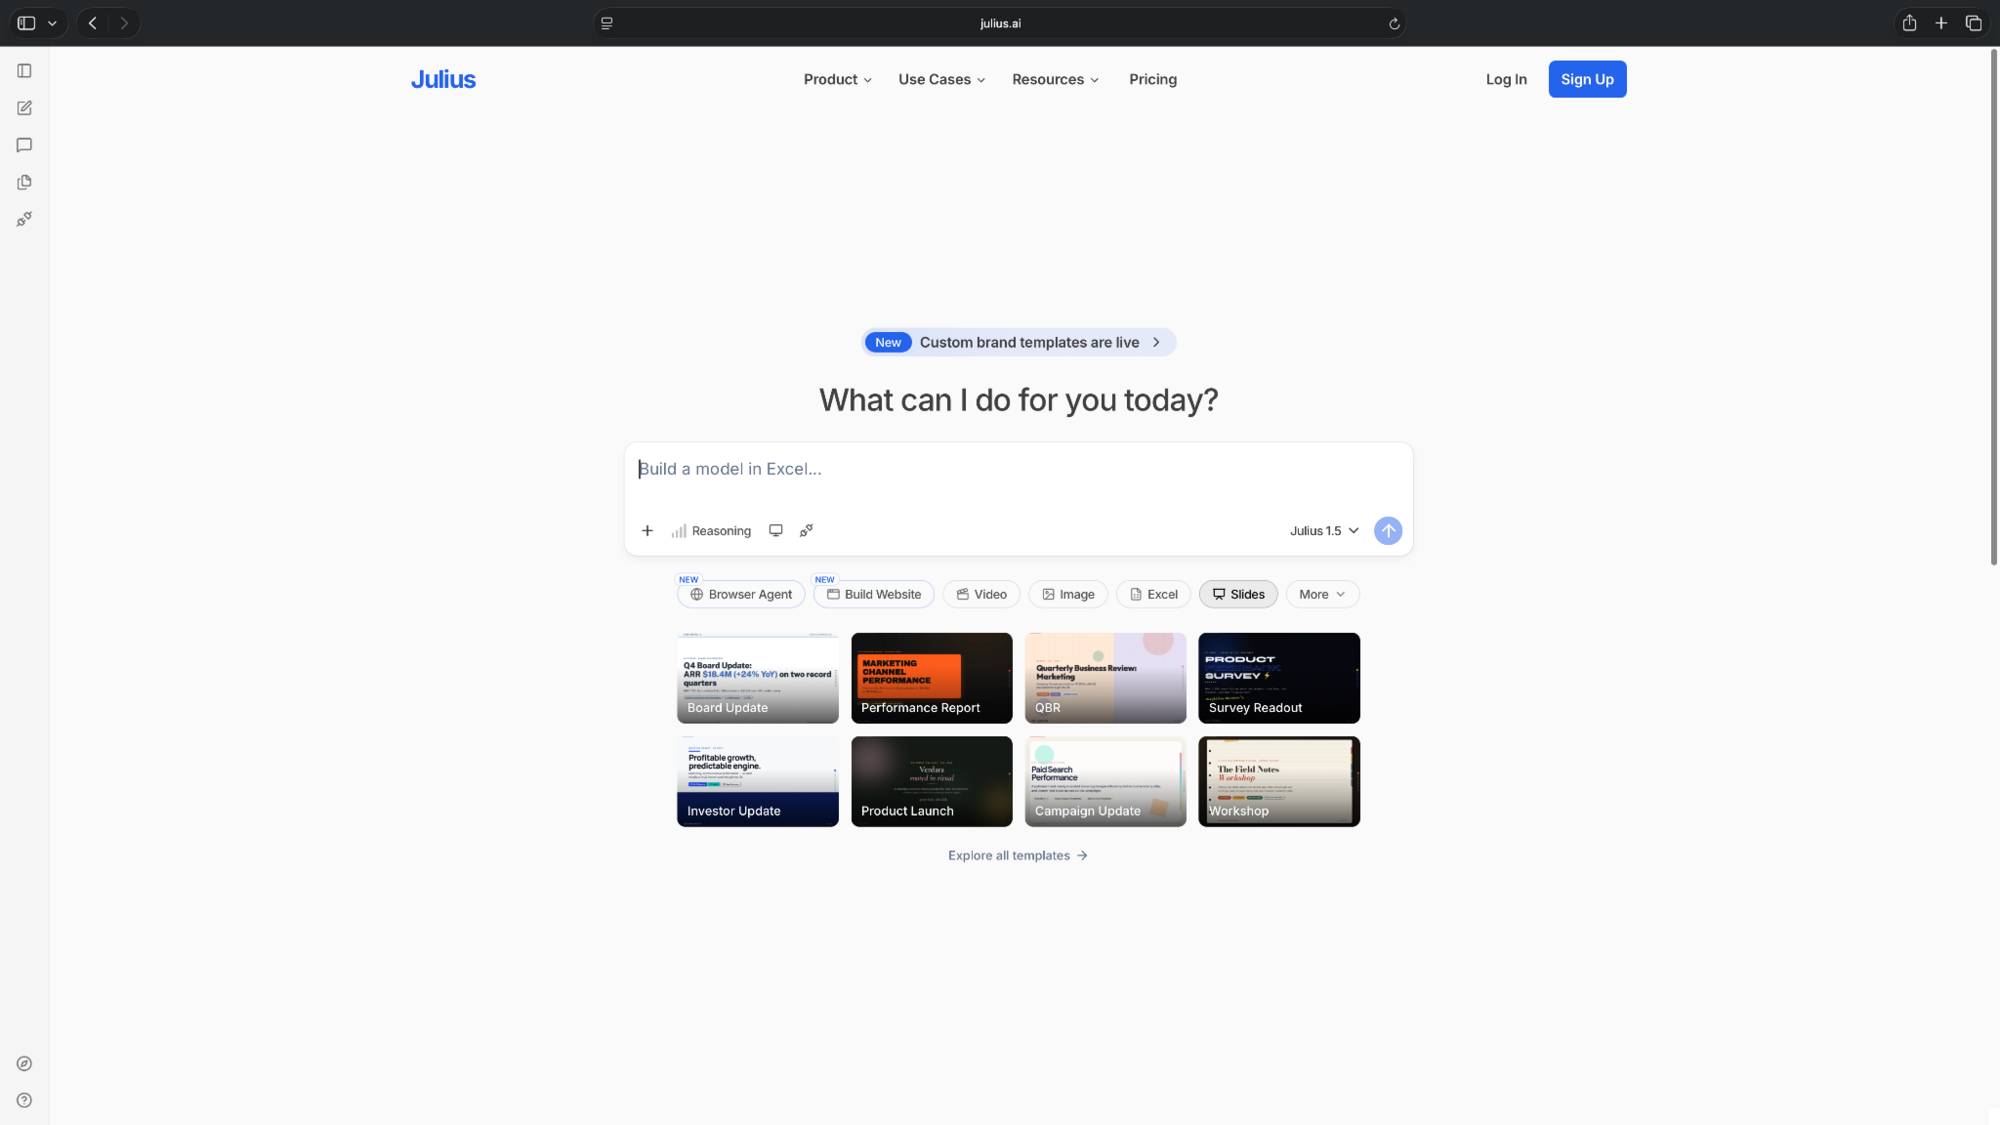
Alt text: Julius AI homepage showing the plain-English prompt interface for uploading datasets and running statistical analysis.
Six Sigma check: Supports custom statistical analysis and charts, but dedicated control chart, Cp/Cpk, gage R&R, and DOE modules aren't documented.
Pros
- Analyze datasets and generate charts using natural language
- Run statistical tests, including regression and ANOVA
- Export findings into reports and visualizations
Cons
- Lacks dedicated Six Sigma and measurement system analysis tools
- AI-generated statistical results require verification
Pricing
- Free to use with limited daily credits
- Paid plans from $20/month, billed monthly
2. JMP: Best for advanced Six Sigma and quality engineering
JMP is a statistical analysis platform built for scientists, engineers, and quality teams. It combines interactive visualizations with dedicated tools for process improvement and experimental design.
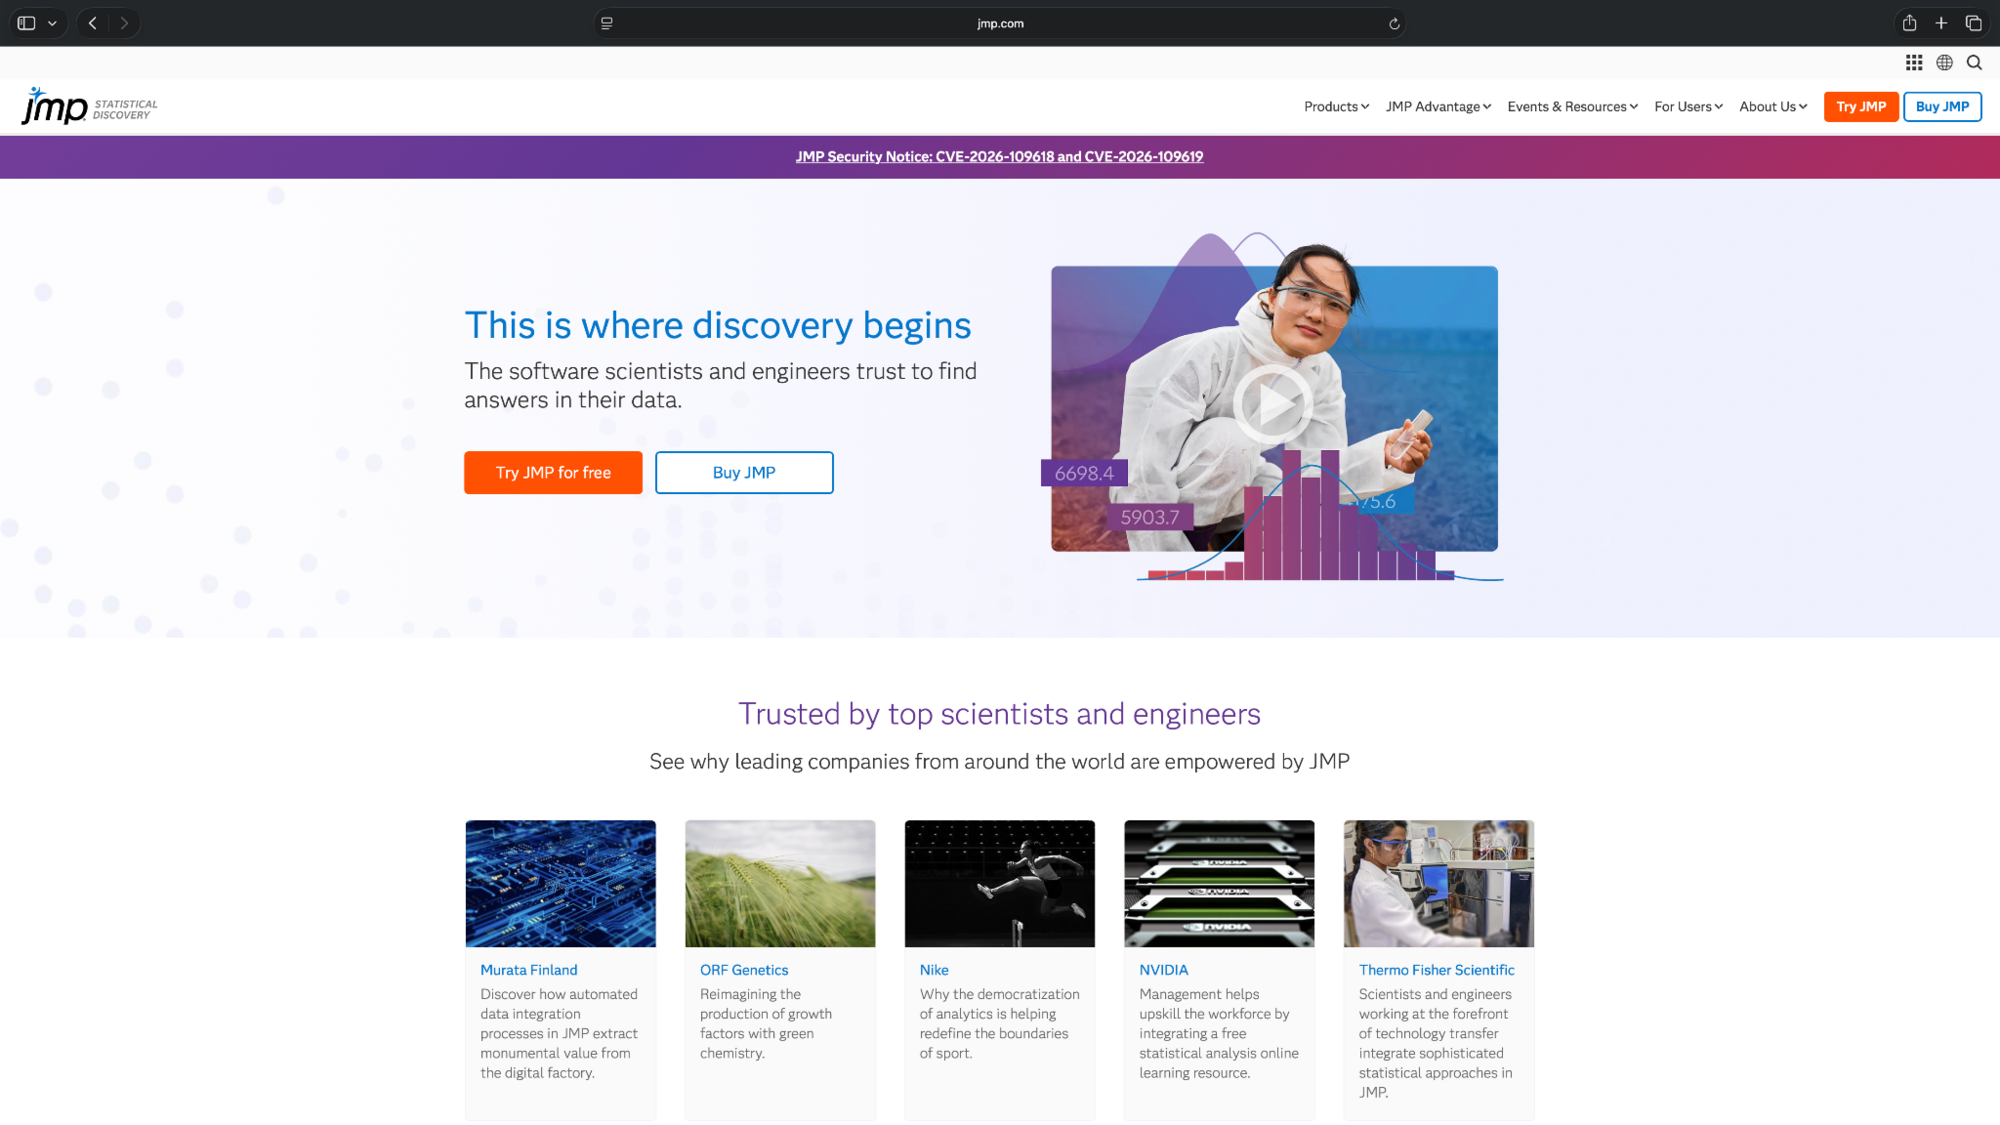
Alt text: JMP statistical analysis software homepage highlighting data visualization and quality engineering tools.
Six Sigma check: Supports control charts, Cp/Cpk, gage R&R, and DOE.
Pros
- Dedicated tools for statistical process control and capability studies
- Advanced DOE tools for testing process variables
- Interactive graphs help explore patterns and variation
Cons
- Commercial licenses are expensive for occasional users
- Advanced workflows take time to learn
Pricing
- Student Edition is free for eligible academic users
- Paid plans start from $1,390/year, equivalent to $115.83/month, billed yearly
3. JASP: Best free Minitab alternative for Six Sigma
JASP is free, open-source statistical software with a point-and-click interface. Its Quality Control module makes it particularly useful for students and engineers who need Minitab-style statistical tools.
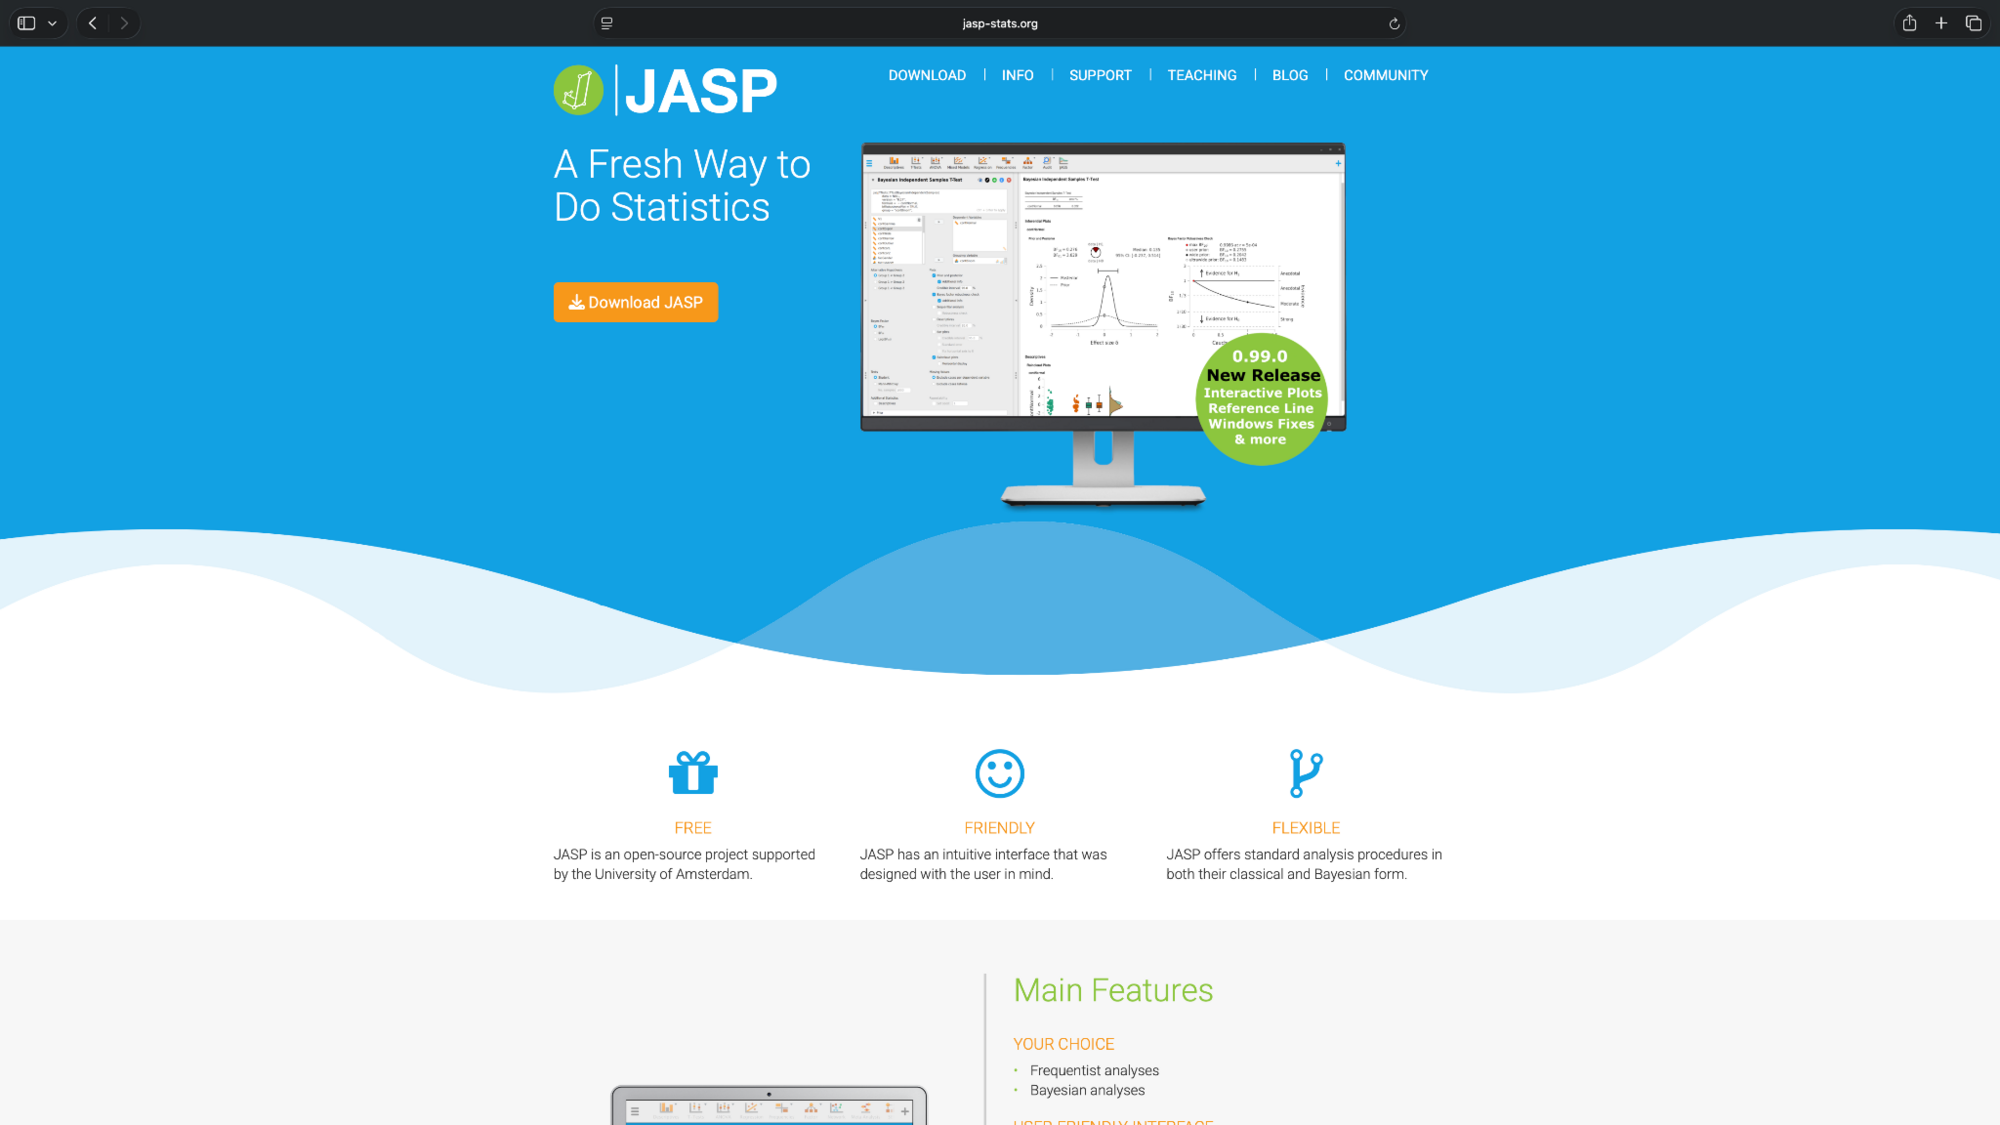
Alt text: JASP free statistical software homepage showing a preview of its point-and-click data analysis interface.
Six Sigma check: Supports control charts, Cp/Cpk, gage R&R, and factorial and response-surface DOE.
Pros
- Free access to statistical tests and quality-control tools
- Supports Minitab workbook imports and common statistical tests
- No programming required for standard analyses
Cons
- Offers fewer specialized industrial workflows than Minitab
- Complex data preparation may require additional software
Pricing
- Fully free and open-source, including the Quality Control module
4. XLSTAT: Best for statistical analysis inside Excel
XLSTAT is now a separate product under Lumivero. It adds statistical analysis and quality-control tools directly to Microsoft Excel. It's suited to analysts who already manage their data in spreadsheets.
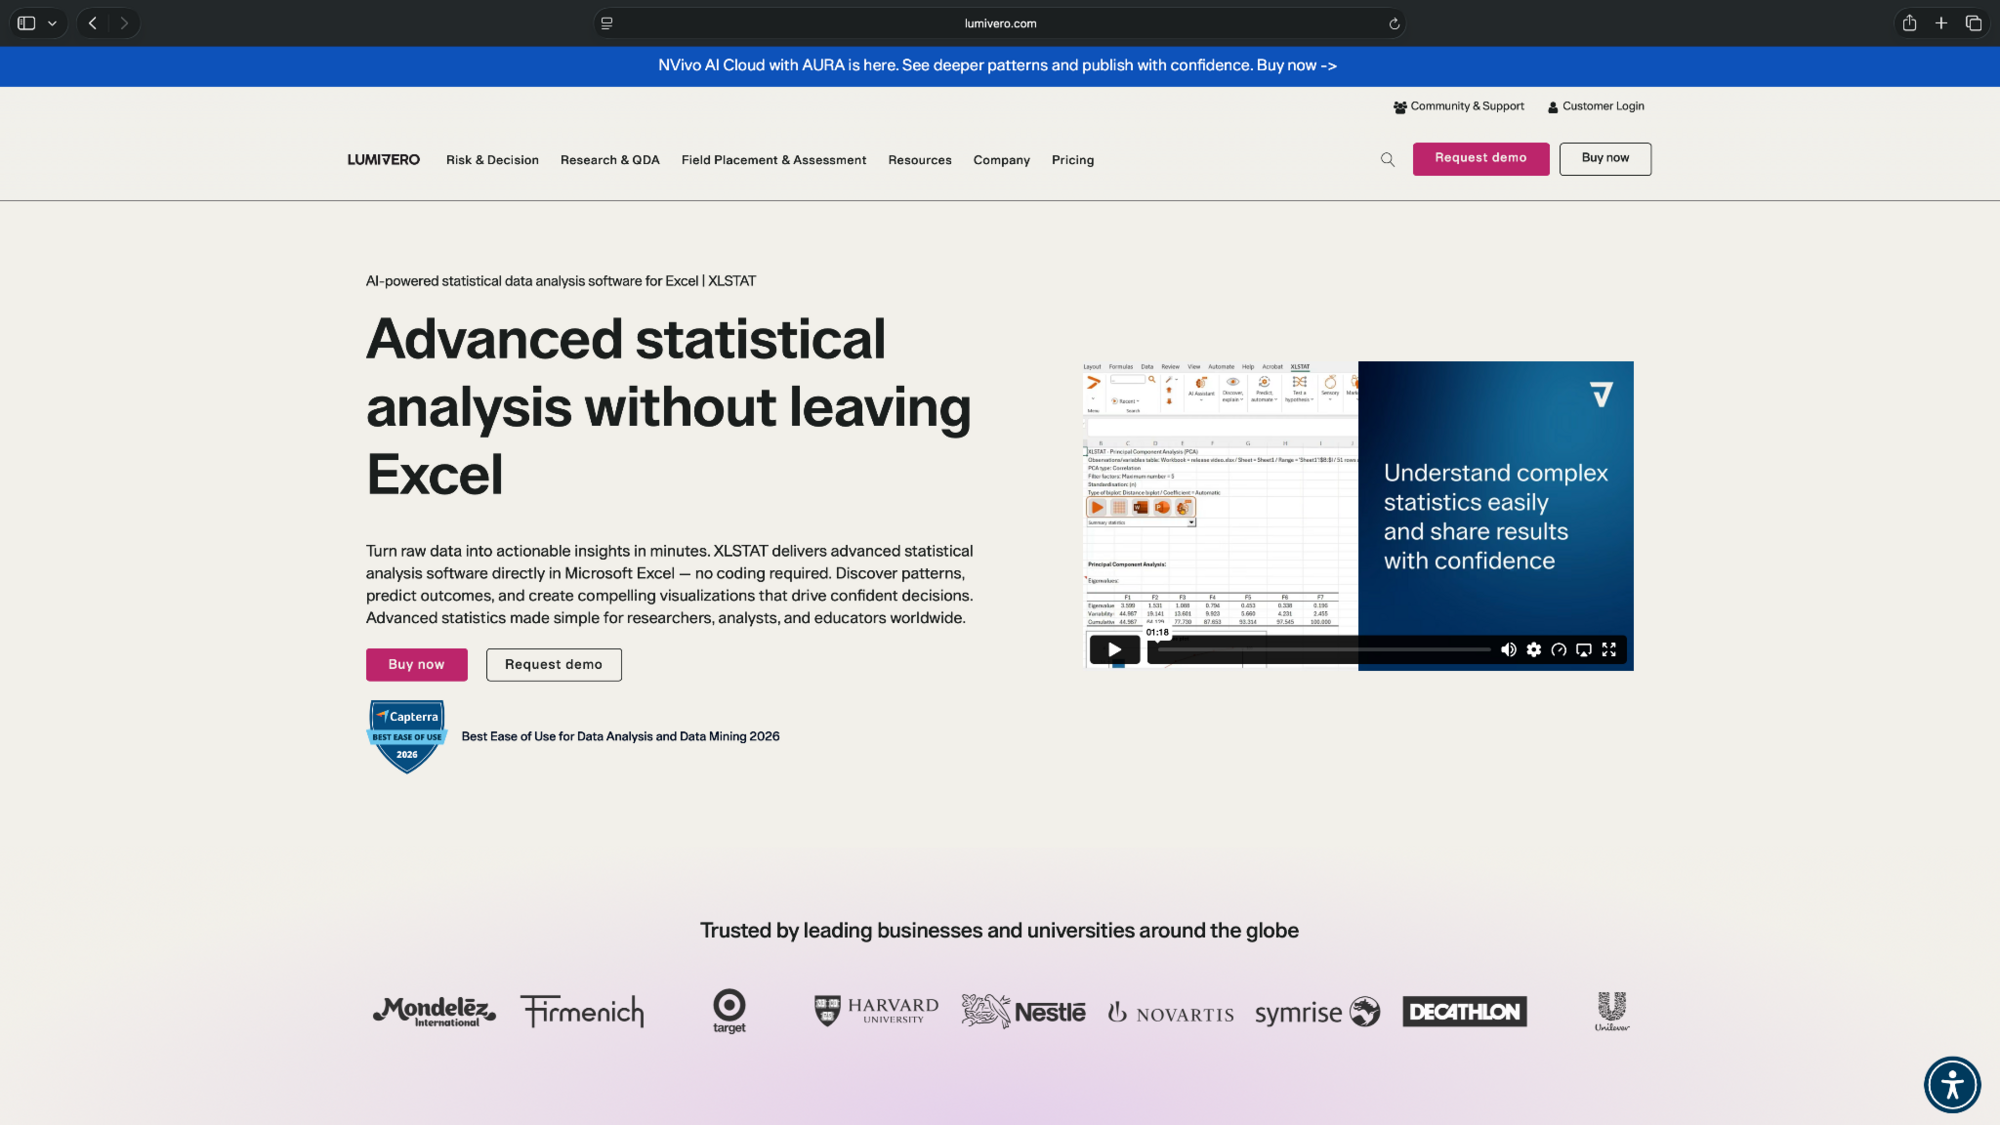
Alt text: XLSTAT homepage showing statistical analysis tools integrated with Microsoft Excel.
Six Sigma check: Paid editions include control charts, process capability, and gage R&R. DOE requires Advanced.
Pros
- Runs statistical tests directly inside Excel
- Supports ANOVA, regression, and statistical process control
- Offers a permanent free edition for basic analysis
Cons
- Free edition doesn’t include dedicated Six Sigma tools
- Full DOE functionality requires the more expensive Advanced plan
Pricing
- No free plan, only a 14-day free trial
- Paid commercial plans start from $380/year (Essentials), billed yearly, with Standard and Advanced tiers above that
5. EngineRoom: Best for guided Lean Six Sigma projects
EngineRoom by MoreSteam helps quality teams analyze process variation and plan improvements. Its guided workflows are especially useful for structured Lean Six Sigma projects.
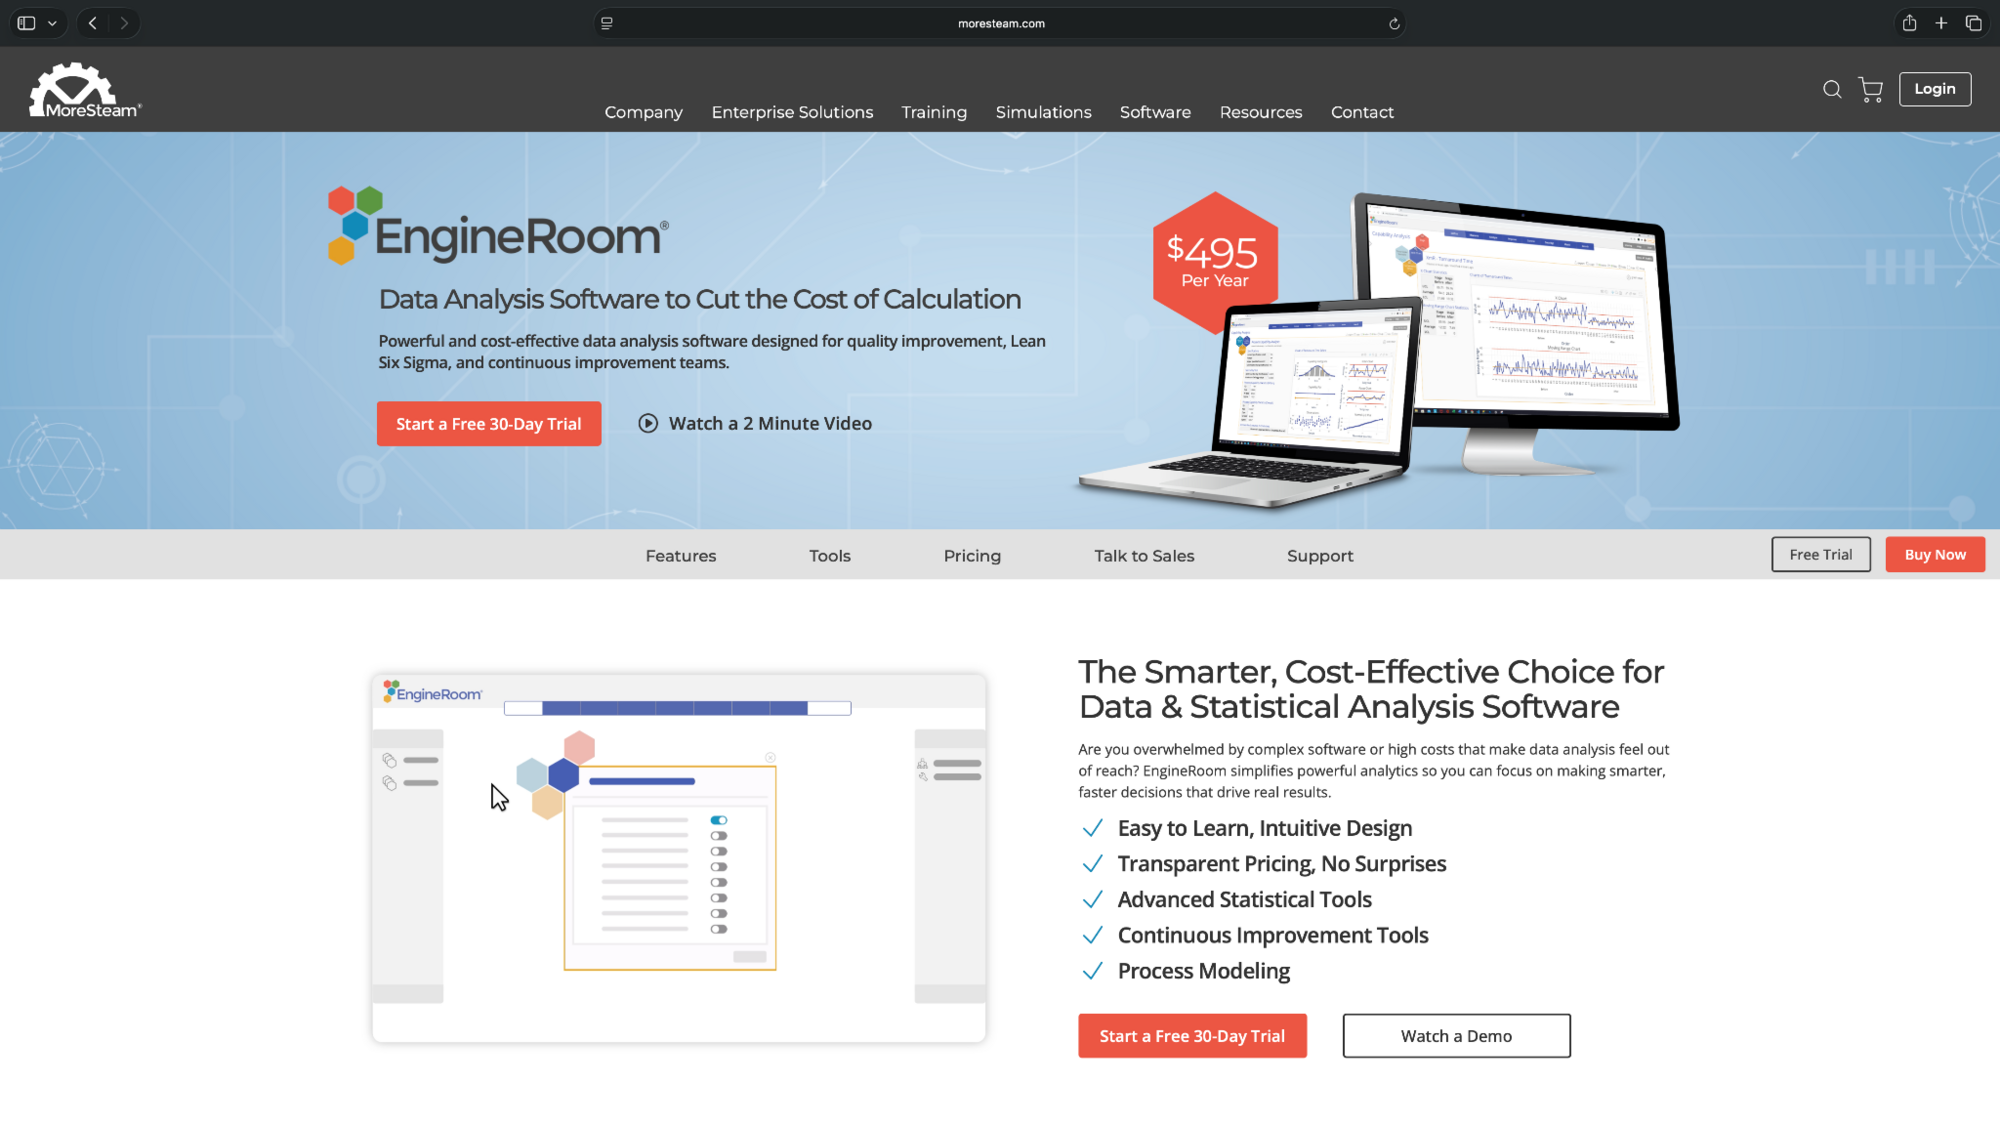
Alt text: EngineRoom by MoreSteam homepage highlighting Lean Six Sigma and process improvement software.
Six Sigma check: Includes control charts, Cp/Cpk, gage R&R, and DOE
Pros
- Dedicated process capability and measurement system analysis tools
- Guided workflows for DOE and process improvement
- Includes process maps and other improvement tools
Cons
- No permanent free version
- Primarily designed for quality improvement workflows
Pricing
- No free plan, only a 30-day trial
- Individual license costs $495/year, equivalent to $41.25/month, billed yearly
6. BlueSky Statistics: Best for R-based analysis with a visual interface
BlueSky Statistics provides a point-and-click interface for statistical analysis powered by R. Its Pro edition includes dedicated quality engineering tools.
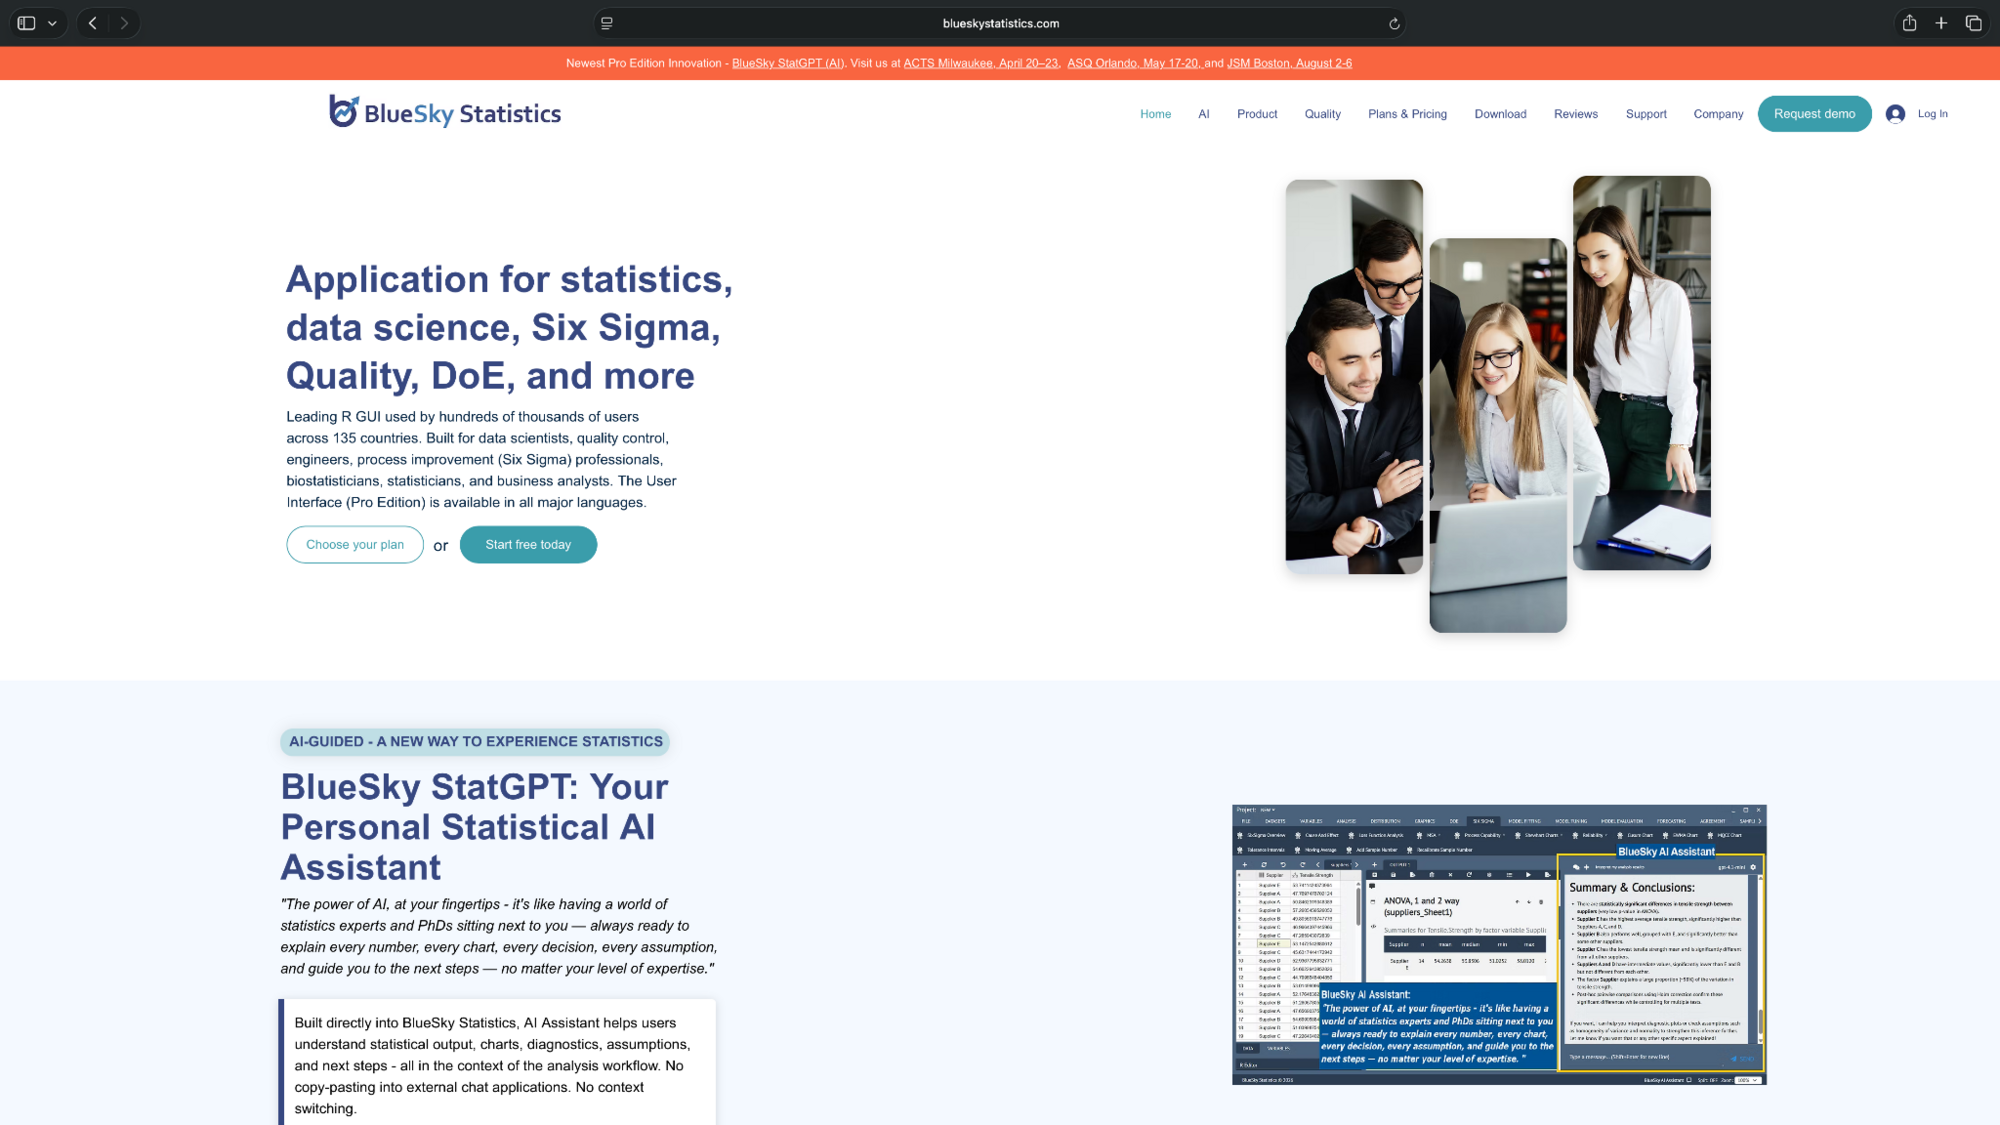
Alt text: BlueSky Statistics homepage featuring R-based statistical analysis, Six Sigma tools, and data visualization.
Six Sigma check: Pro supports control charts, Cp/Cpk, gage R&R, and DOE.
Pros
- Runs statistical analysis through a graphical interface
- Pro includes a broad set of Six Sigma tools
- Supports common statistical tests and data visualizations
Cons
- Specialized quality-control features require Pro
- The Base edition lacks the full process improvement toolkit
Pricing
- Free to use with general statistical analysis
- Paid plans start from $495/year, equivalent to $41.25/month, billed yearly
7. RStudio: Best free alternative for custom statistical analysis
R is a free statistical programming language, while RStudio provides an interface for writing and running R code. Together, they support statistical modeling, visualization, and quality-control analysis.
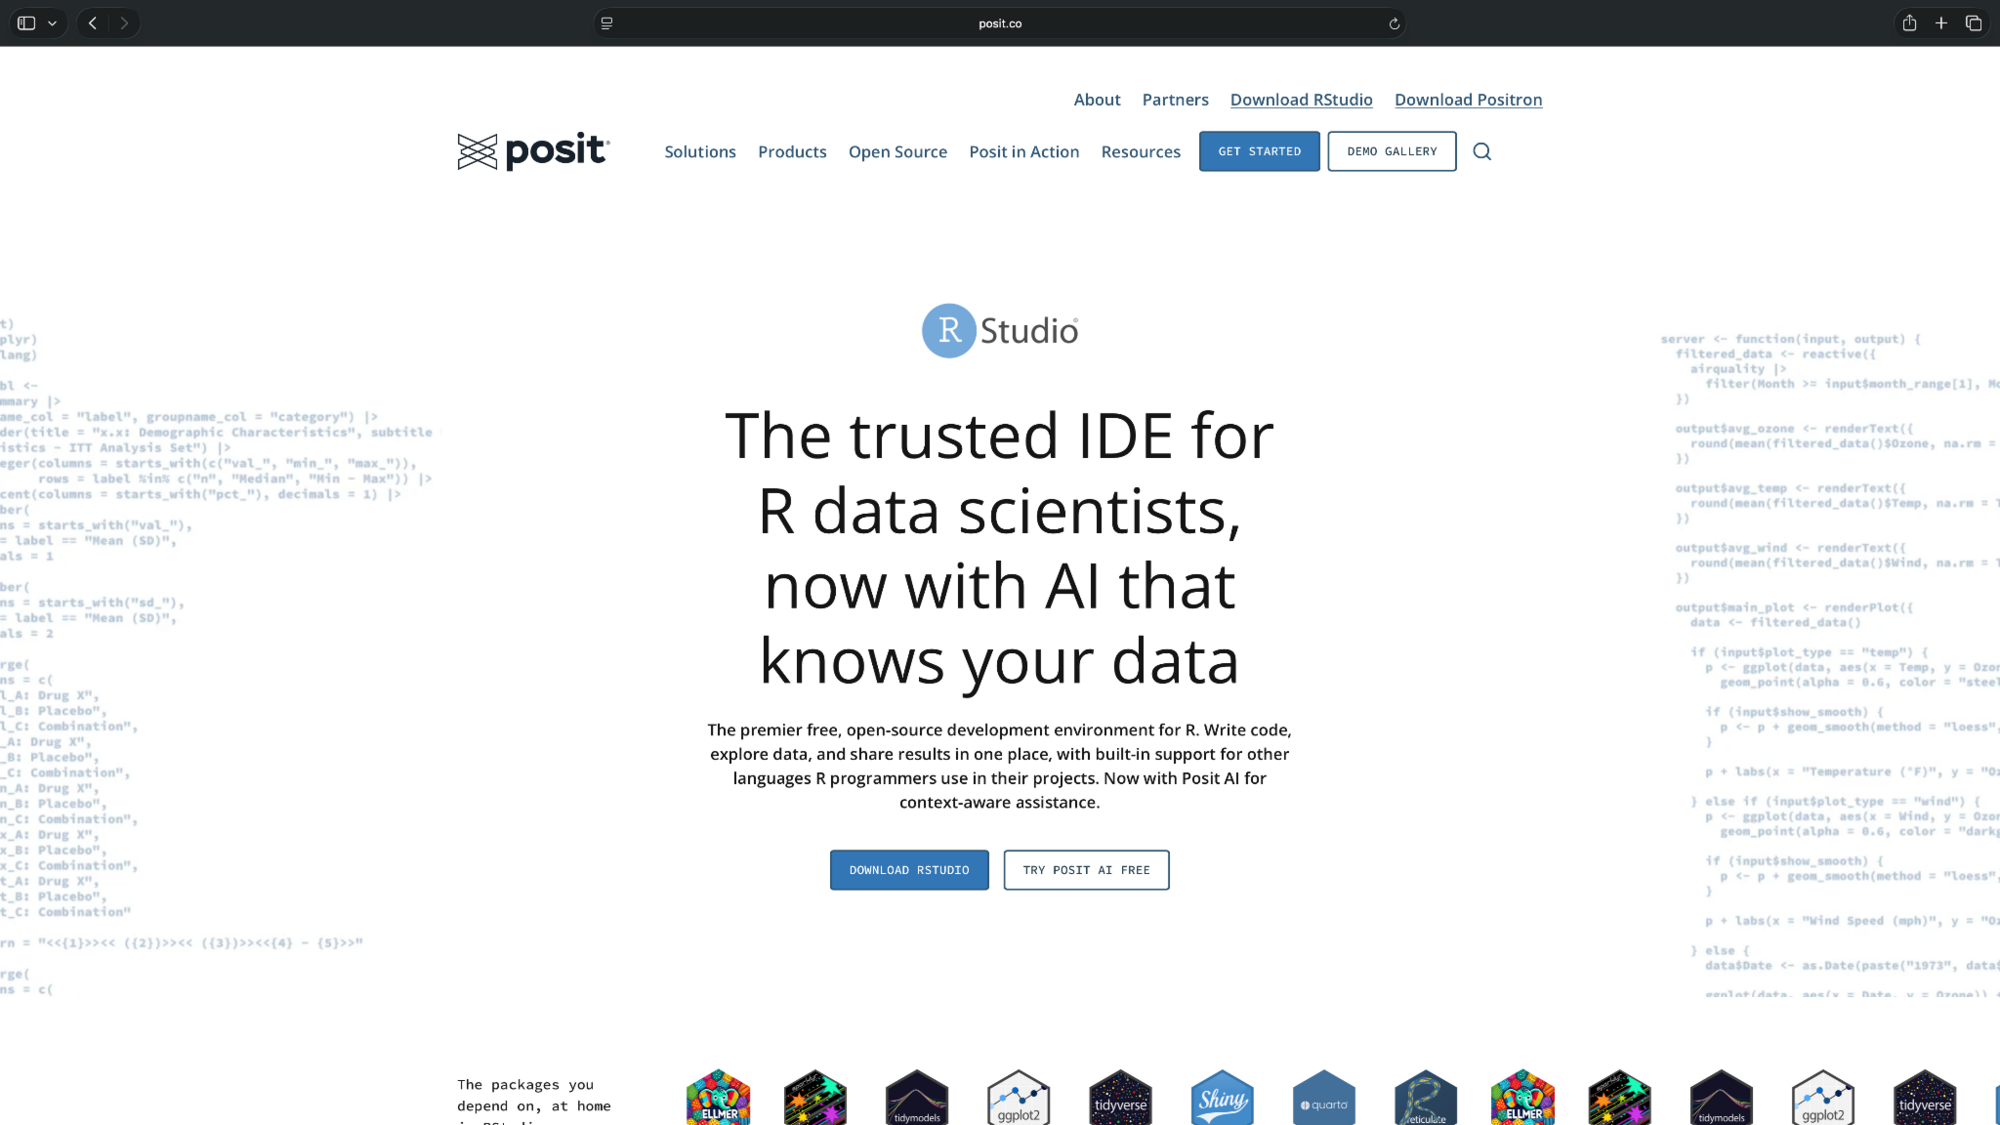
Alt text: RStudio homepage showing its integrated development environment for R programming and statistical analysis.
Six Sigma check: Packages such as qcc, SixSigma, and DoE.base support control charts, Cp/Cpk, gage R&R, and DOE.
Pros
- Free access to extensive statistical libraries
- Flexible analysis and visualization through R packages
- Supports reproducible scripts and custom workflows
Cons
- Requires learning R programming
- Six Sigma tools need separate packages and configuration
Pricing:
- Free and open-source, including access to statistical packages.
- Commercial RStudio plan costs $1204/year, billed yearly
8. IBM SPSS Statistics: Best for research and statistical testing
IBM SPSS Statistics offers statistical testing, data preparation, and predictive modeling tools through a graphical interface. It's commonly used for research projects involving surveys, regression, and hypothesis testing.
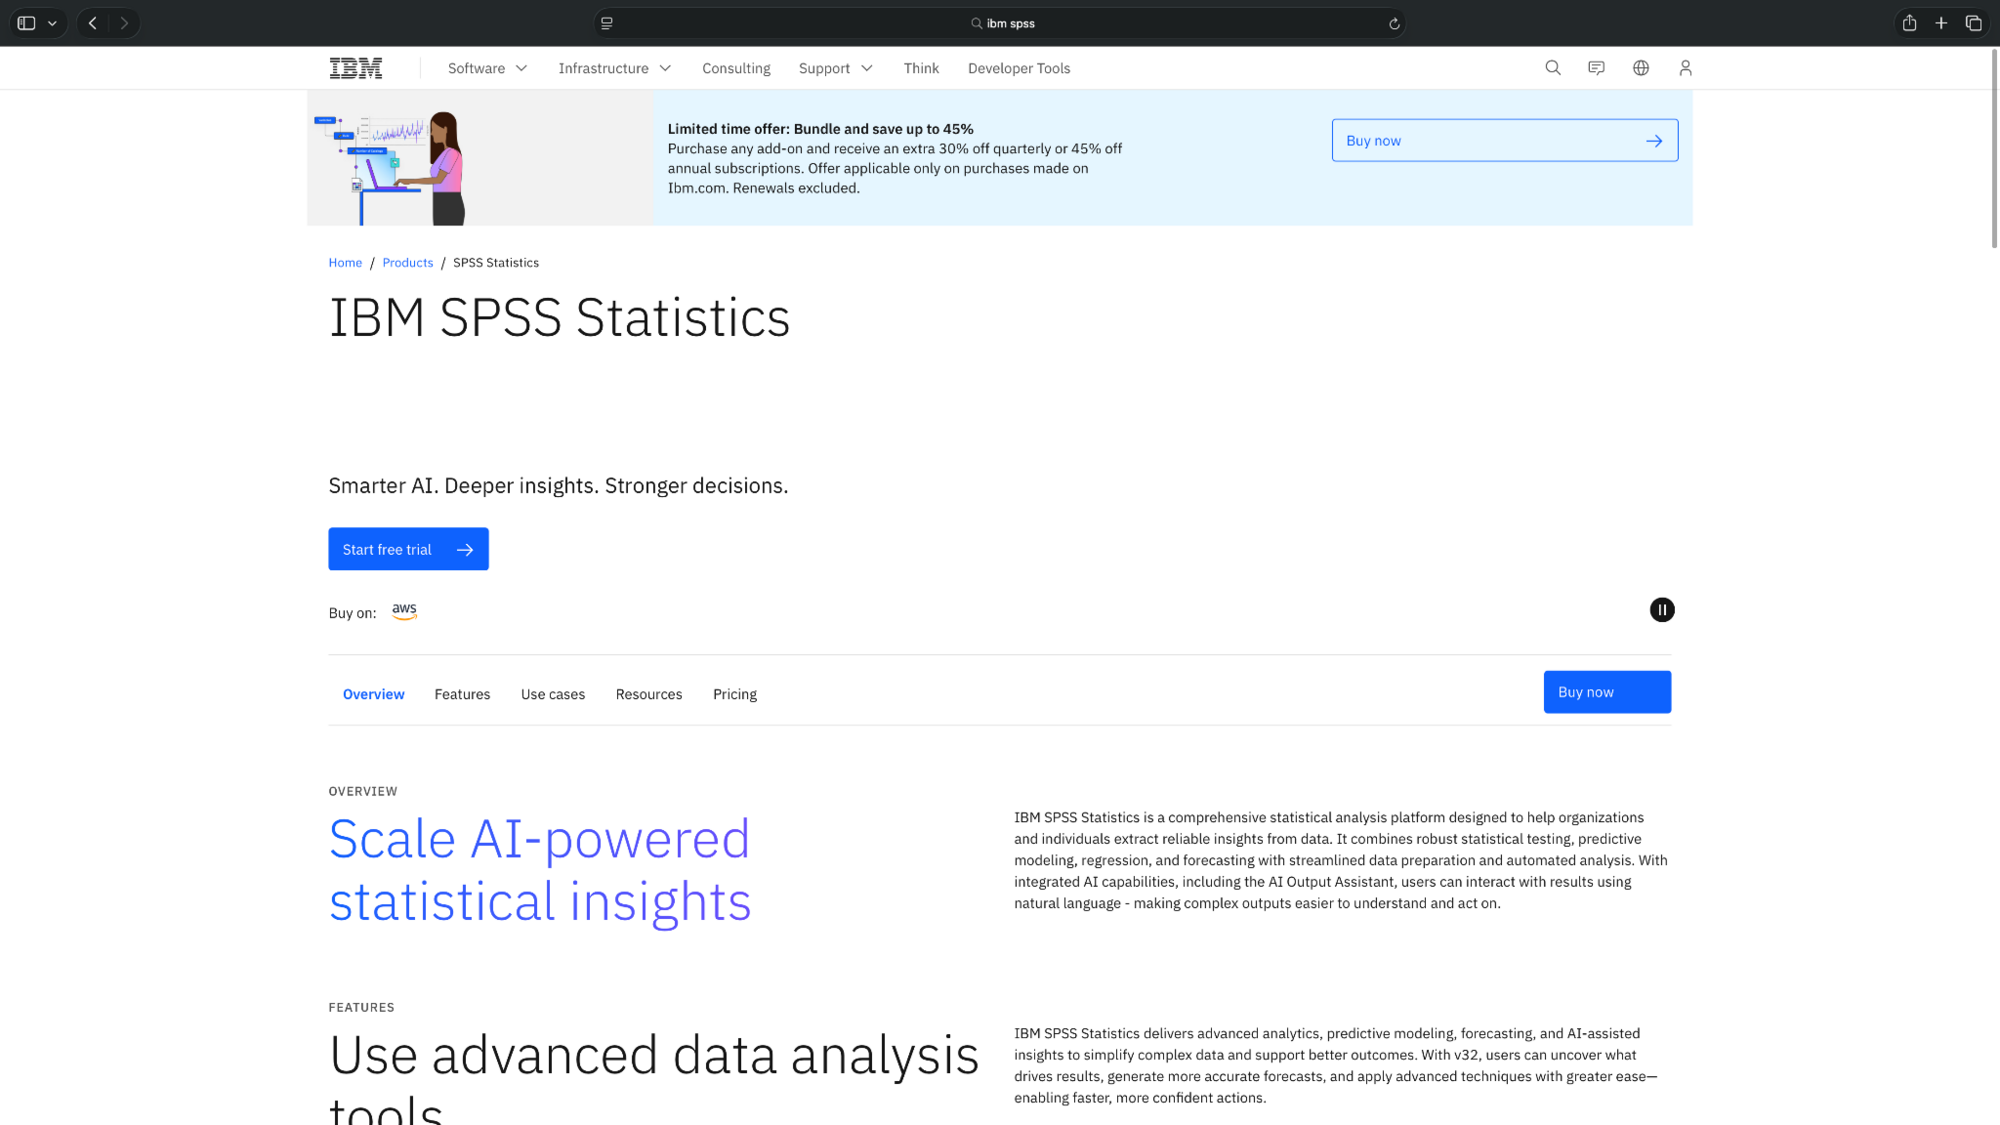
Alt text: IBM SPSS Statistics product page highlighting statistical analysis, data preparation, and AI-powered insights.
Six Sigma check: Supports control charts and process capability indices, including Cp/Cpk. Dedicated gage R&R and DOE design tools are more limited.
Pros
- Supports regression, ANOVA, and multivariate analysis
- Includes data preparation and statistical visualization tools
- Provides control charts and capability analysis
Cons
- Lacks a dedicated gage R&R workflow comparable to Minitab
- Advanced statistical features may require paid add-ons
Pricing
- No free plan, only a 14-day trial
- Base subscription starts at $109/user/month, with extra costs for add-ons
What Minitab still does better
Minitab remains a strong choice for manufacturing and quality teams. It combines control charts, Cp/Cpk, gage R&R, DOE, and guided statistical analysis in one interface.
Switching can also take time if your team already uses Minitab templates or relies on its reports for quality reviews. You'll need to check whether a replacement produces comparable results and fits your existing procedures.
Minitab is still actively developed. Its October 2026 update added new control chart features and updated capability indices.
Which Minitab alternative should you choose?
The right alternative depends on your budget, statistical needs, and experience. Here are a few scenarios to help you decide:
- Choose Julius if you want to analyze datasets and generate charts using plain-English instructions. It isn't a dedicated Six Sigma platform.
- Choose JASP if you need free statistical software with built-in quality-control tools.
- Choose JMP or EngineRoom if you regularly work on Six Sigma, process capability, or measurement system studies.
- Choose R with RStudio if you're comfortable coding and want more control over your statistical analyses.
- Stick with Minitab if your team already relies on its dedicated quality engineering tools and established reporting workflows.
Final verdict
The right Minitab alternative depends on what you're analyzing. JASP and R with RStudio offer free statistical tools, while JMP and EngineRoom are well suited to dedicated Six Sigma projects.
If your work involves analyzing spreadsheets, running statistical tests, and creating charts, Julius offers a simpler approach using plain English. You can upload a dataset, ask questions, and review the results before deciding whether it fits your needs.
Frequently asked questions
Does anyone still use Minitab?
Yes, users still use Minitab, especially for manufacturing quality control, engineering, and process improvement. It supports control charts, capability analysis, measurement system studies, and other statistical methods.
Is Minitab outdated?
No, Minitab isn't outdated. It receives regular updates, including new control chart features and capability analysis improvements in October 2026. Its subscription cost and suitability for your workflow are stronger reasons to consider alternatives.
Is JMP or Minitab better?
The better tool between JMP and Minitab is the one that fits your specific work. JMP is a strong choice for interactive statistical analysis and DOE, while Minitab suits teams with established quality-control workflows. Both support control charts, Cp/Cpk, gage R&R, and DOE.
Is there a free version of Minitab?
No, Minitab doesn’t have a free version. However, it offers a 14-day free trial. Eligible students and instructors can access discounted academic licenses. For free alternatives, consider JASP or R with RStudio.