
A two-sample t-test (or 2-sample t-test) checks whether the averages of two independent groups differ by more than luck would explain. Think of it like an A/B test for means: two separate groups, one question, one honest answer about whether the gap is real.
If your two numbers come from the same people measured twice, like a before-and-after score, use a paired t-test instead. Mixing the two up is the most common mistake in this whole topic.
Once you know which version fits your data, the math takes a few lines, and Excel, R, and Python can each run the full test in a single function call.
What is a two-sample t-test?
A two-sample t-test compares the means of two independent groups to tell you whether the difference between them is statistically significant. The two groups are unrelated: different people, different items, or different conditions, with no overlap between them.
Say you measure the heights of 50 collies and 50 labradors. Two separate groups, one question: do the breeds differ in average height, or did you just happen to draw a few tall dogs? That's the independent samples t-test at work.
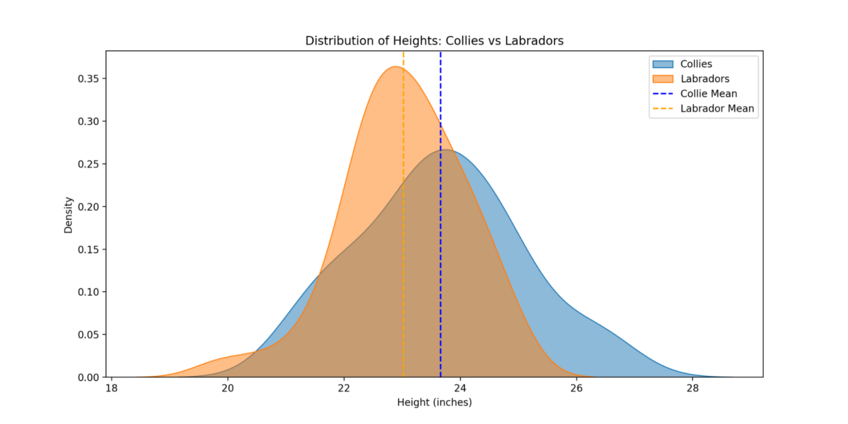
Comparing the mean height of 50 collies and 50 labradors. The p-value of 0.0111 is below 0.05, so the height difference between the breeds is statistically significant. Created in seconds with Julius AI.
You'll see it written both ways, two-sample and 2-sample t-test, and both names mean the same test.
Reach for it when:
- Two separate groups: your data splits into two unrelated samples, like Team A and Team B.
- You care about the average: the question is about means. Proportions and medians need a different test.
- Your numbers are continuous: scores, dollars, minutes, heights, anything you can average.
Skip it when your data is paired (the same subjects measured twice) or you're comparing three or more groups. Paired data belongs to the paired t-test, and three-plus groups belong to ANOVA.
One myth worth dropping: there's no rule that your samples have to stay under 30. The t-test is simply what you use when you don't know the population's standard deviation, which is almost always the case. Small samples are where it earns its keep, but large ones work fine too.
Two-sample vs. paired vs. one-sample t-test
People mix up the three flavors of t-test constantly, and it doesn't help that they share a name. The difference comes down to what you're comparing:
| 🧮 Test | ⚖️ Compares | 🎯 Use when | 🧪 Example | 📐 Degrees of freedom |
| One-sample | one group's mean vs a set value | you have a target or benchmark | class average vs 75 | n − 1 |
| Two-sample (independent) | means of two separate groups | the groups are unrelated | Hospital A vs Hospital B | n1 + n2 − 2 (pooled) |
| Paired | the mean difference within matched pairs | same subjects, before and after | patients' pre vs post scores | pairs − 1 |
If you're testing one group against a single target number, that's the one-sample t-test. Two measurements on the same subjects? Paired. Two different groups? You're in the right place.
Assumptions and conditions of a two-sample t-test
What are the assumptions of a two-sample t-test? Four conditions need to hold for the result to mean anything:
- Independence: each observation stands on its own, and the two groups don't influence each other.
- Random sampling: you drew each sample randomly, so no selection bias is baked in.
- Approximate normality: each group is roughly bell-shaped. With larger samples the Central Limit Theorem relaxes this, so you don't need perfect normality.
- Equal variances, or Welch: the classic pooled test assumes both groups have similar spread. When they don't, you switch to Welch's version instead of forcing the assumption.
That last point trips people up. If you're not sure the spreads match, you don't have to guess. You can check with a variance test such as Levene's, or default to Welch's version and skip the question. For a deeper look at checking these, see our guide on testing assumptions in statistical analysis.
How to state your hypotheses: two-tailed, left-tailed, and right-tailed
Every two-sample t-test starts with a null hypothesis that the two group means are equal, written H0: μ1 = μ2. Your alternative hypothesis depends on the question you're asking, and it comes in three shapes.
- Two-tailed: H0: μ1 = μ2, Ha: μ1 ≠ μ2. You're checking for any difference in either direction.
- Left-tailed: H0: μ1 ≥ μ2, Ha: μ1 < μ2. You suspect group 1 is lower.
- Right-tailed: H0: μ1 ≤ μ2, Ha: μ1 > μ2. You suspect group 1 is higher.
Then comes the decision rule. Pick a significance level (α), usually 0.05. Calculate your t-statistic and its p-value. If the p-value is below α, you reject the null and conclude the difference is statistically significant. If it's at or above α, you fail to reject, and the difference could just be noise.
💡 Note: a two-tailed test splits α across both tails (0.025 each side at the 0.05 level), while a one-tailed test puts the whole α in one tail.Decide which one you need before you look at the data..
The two-sample (2-sample) t-test formula: pooled vs. Welch
This is the one spot where the version you pick changes the actual numbers. There are two ways to calculate the t-statistic, depending on whether the two groups share the same variance.
In both formulas, x̄1 and x̄2 are the sample means, s1² and s2² are the sample variances, and n1 and n2 are the sample sizes.
Equal variances (the pooled t-test). When you can assume both groups have the same spread, you pool their variances into one estimate:
t = (x̄1 − x̄2) / ( sp × √(1/n1 + 1/n2) )
where the pooled variance is sp² = [ (n1 − 1)·s1² + (n2 − 1)·s2² ] / (n1 + n2 − 2), and sp is its square root.
Degrees of freedom here are simple: df = n1 + n2 − 2.
Unequal variances (Welch's t-test). When the spreads differ, you skip the pooling and use each group's own variance:
t = (x̄1 − x̄2) / √( s1²/n1 + s2²/n2 )
The degrees of freedom get messier, calculated with the Welch–Satterthwaite formula:
df = ( s1²/n1 + s2²/n2 )² / [ (s1²/n1)²/(n1 − 1) + (s2²/n2)²/(n2 − 1) ]
That usually lands on a decimal, and the convention is to round it down to the nearest whole number before you look up a critical value. The NIST/SEMATECH e-Handbook walks through the same two-sample setup if you want the reference text.
💡 Tip: if you're not sure the variances are equal, use Welch. It handles equal and unequal spreads gracefully, which is why R's t.test() runs it by default. (SciPy in Python defaults to the pooled version, so you pass equal_var=False to get Welch.)
Two-sample t-test example, step by step
Suppose you're comparing patient-satisfaction scores (0 to 100) at two hospitals, drawn as independent samples, to see which one patients rate higher.
The two samples:
- Hospital A: n1 = 12, mean x̄1 = 82, standard deviation s1 = 5.
- Hospital B: n2 = 12, mean x̄2 = 76, standard deviation s2 = 6.
Step 1: State the hypotheses. H0: μA = μB, Ha: μA ≠ μB, with α = 0.05 (two-tailed). The spreads are close, so we'll use the pooled test.
Step 2: Pool the variance. sp² = [11 × 25 + 11 × 36] / 22 = 671 / 22 = 30.5, so sp = √30.5 ≈ 5.52.
Step 3: Compute the standard error. sp × √(1/12 + 1/12) = 5.52 × √0.1667 ≈ 5.52 × 0.408 ≈ 2.25.
Step 4: Compute t. t = (82 − 76) / 2.25 = 6 / 2.25 ≈ 2.66.
Step 5: Find the degrees of freedom and compare. df = 12 + 12 − 2 = 22. The critical t for a two-tailed test at α = 0.05 with 22 degrees of freedom is about 2.074. Since 2.66 is larger than 2.074 (p ≈ 0.014), you reject the null.
The conclusion in plain English: Hospital A's mean satisfaction score is significantly higher than Hospital B's, and the six-point gap is unlikely to be chance.
💡 Note: because the two variances here are close, Welch gives almost the identical answer (t ≈ 2.66, df ≈ 21.3, p ≈ 0.015). That's common when sample sizes and spreads match up.
It's worth reporting the effect size next to the p-value. Cohen's d here is 6 ÷ 5.52 ≈ 1.09, which counts as large by Cohen's usual benchmarks (0.2 small, 0.5 medium, 0.8 large), so the six-point gap matters in practice as well as statistically.
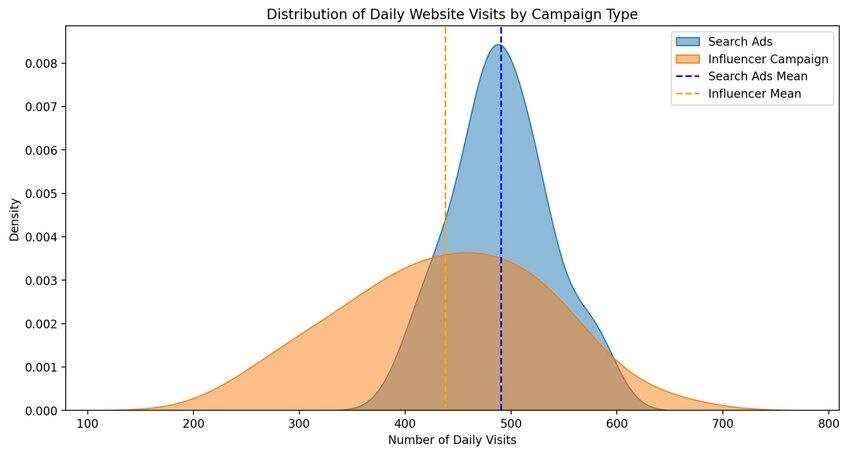
A two-sample t-test comparing 30 days of visits for a search ad campaign versus an influencer campaign. The p-value of 0.0071 says the gap between them is statistically significant. Created in seconds with Julius AI.
How to run a two-sample (2-sample) t-test in Excel, R, Python, and Julius
Outside a quick sanity check, you'll rarely do this by hand, since hand calculation is slow and easy to fumble, especially the Welch degrees of freedom. Each tool below runs both versions in a single step.
Excel: use =T.TEST(array1, array2, tails, type). Set tails to 2 for a two-tailed test, and type to 2 for the pooled (equal-variance) version or 3 for Welch. Prefer buttons? Turn on the Analysis ToolPak add-in, then go to Data > Data Analysis and pick "t-Test: Two-Sample Assuming Equal Variances" for the pooled test or "t-Test: Two-Sample Assuming Unequal Variances" for Welch.
R: t.test(x, y) runs Welch by default. Set var.equal = TRUE for the pooled test. (Leave paired = FALSE; flipping it to TRUE runs the paired test instead.)
Python: with SciPy, scipy.stats.ttest_ind(a, b, equal_var=False) gives you Welch, and equal_var=True gives you the pooled version.
Julius: upload your two groups as a file or connect the database they live in, then type the question in plain English, like "Run a two-sample t-test comparing these two groups and tell me if the difference is significant." Julius writes and runs the Python or R code, shows you each step, and charts the result the way you saw above.
💡 Tip: as long as you choose the same variance assumption, these tools should agree on the p-value (Excel's T.TEST returns the p-value only). If they don't, check whether one of them defaulted to Welch.
Common mistakes to avoid
A two-sample t-test is forgiving, but a few errors show up again and again.
- Reading the p-value backward: the p-value is the chance of seeing a gap at least this large if the two means were equal. It isn't the chance the null is true, and a p-value above alpha doesn't prove the means match. It only means the data can't rule chance out.
- Using the wrong test: before-and-after or matched data needs the paired t-test, and three or more groups need ANOVA. The two-sample test is for exactly two independent groups.
- Forcing equal variances: if the spreads clearly differ, don't pool them. Use Welch and move on.
- Picking the wrong tail: choose one-tailed or two-tailed based on your hypothesis before you see the result, so the data can't tempt you into the easier conclusion.
Alternatives to a two-sample t-test
Sometimes the two-sample t-test isn't the right tool, usually because an assumption breaks.
- Mann-Whitney U test: when your data clearly isn't normal, this rank-based test compares two groups without the normality assumption.
- ANOVA: when you have three or more groups to compare, analysis of variance handles them all at once instead of running a pile of t-tests.
One clarification: Welch's t-test is a version of the two-sample test for unequal variances, so it belongs with the formulas above and sits outside this list of alternatives. For the wider map of how these methods fit together, see the full t-test in-depth guide.
Run your two-sample t-test without the hand calculations
The math itself is quick. Where people stall is picking the right version and trusting they entered everything correctly.
We built Julius so you can skip that friction entirely. Bring your two groups as a file or a database connection, ask your question in plain English, and let it handle the variance check, the formula, and the chart.
A few features make that easier:
- Code you can check: Julius writes Python or R and runs it in a secure cloud container, and you can open any step to see exactly what it ran.
- Direct connections: plug into Postgres, Snowflake, or BigQuery to test on the data you already store.
- Built-in visualization: every test comes back with a clear chart next to the numbers, like the ones above.
- Easy sharing: export the result or share the conversation with your team without rebuilding it in another tool.
Julius works like an AI chat assistant that happens to be fluent in statistics, so you get the two-sample t-test answer and the reasoning behind it in the same place.
Ready to skip the hand calculations and go straight to the insight? Try Julius for free today.
Frequently Asked Questions
What is a two-sample t-test used for?
A two-sample t-test is used to compare the means of two independent groups and decide whether the difference between them is statistically significant. It fits cases like A/B tests, two product variants, or two populations. For before-and-after data on the same subjects, use the paired t-test instead.
What is the difference between a paired t-test and a two-sample t-test?
The main difference between a paired and a two-sample t-test is the data structure. A paired t-test compares two measurements taken on the same subjects, like a before-and-after score, while a two-sample (independent) t-test compares two separate, unrelated groups. Paired tests use the within-pair differences; two-sample tests use the two group means.
When should I use Welch's t-test instead of the pooled two-sample t-test?
Use Welch's t-test when the two groups have unequal variances or very different sample sizes. It adjusts the degrees of freedom to account for that imbalance, which keeps the p-value honest. Because it handles equal and unequal spreads, Welch is a safe default when you're unsure.
How do you interpret the p-value for a two-sample t-test?
The p-value tells you how likely a difference at least as large as yours would be if the two group means were equal. If the p-value is below your alpha level (commonly 0.05), you reject the null hypothesis and conclude the means differ significantly. If it's at or above alpha, you fail to reject, and the difference may just be chance.
Does a two-sample t-test assume normality?
Yes, a two-sample t-test assumes each group is drawn from a roughly normal population. With larger samples the Central Limit Theorem relaxes this, so mild non-normality is usually fine. If your data is strongly non-normal, the Mann-Whitney U test is a better fit.
What is the difference between a two-sample t-test and ANOVA?
The main difference between a two-sample t-test and ANOVA is the number of groups. A two-sample t-test compares the means of exactly two groups, while ANOVA compares three or more at once. Running many t-tests instead of one ANOVA inflates your chance of a false positive.