Turn Excel Data into a PowerPoint with AI
Upload your spreadsheet and tell Julius what your audience needs to know. It analyzes the data, creates charts, and builds an editable slide deck.
How to convert Excel data into a PowerPoint with AI
Move from spreadsheet to presentation without rebuilding every chart by hand.
1. Upload your spreadsheet
Add an Excel or CSV file, including workbooks with multiple tabs, and describe the presentation you need.
2. Analyze the data
Julius calculates from your file, finds the important trends and comparisons, and creates charts from the results.
3. Build and export the deck
Turn the findings into a clear slide narrative, refine the design, and export the finished presentation.
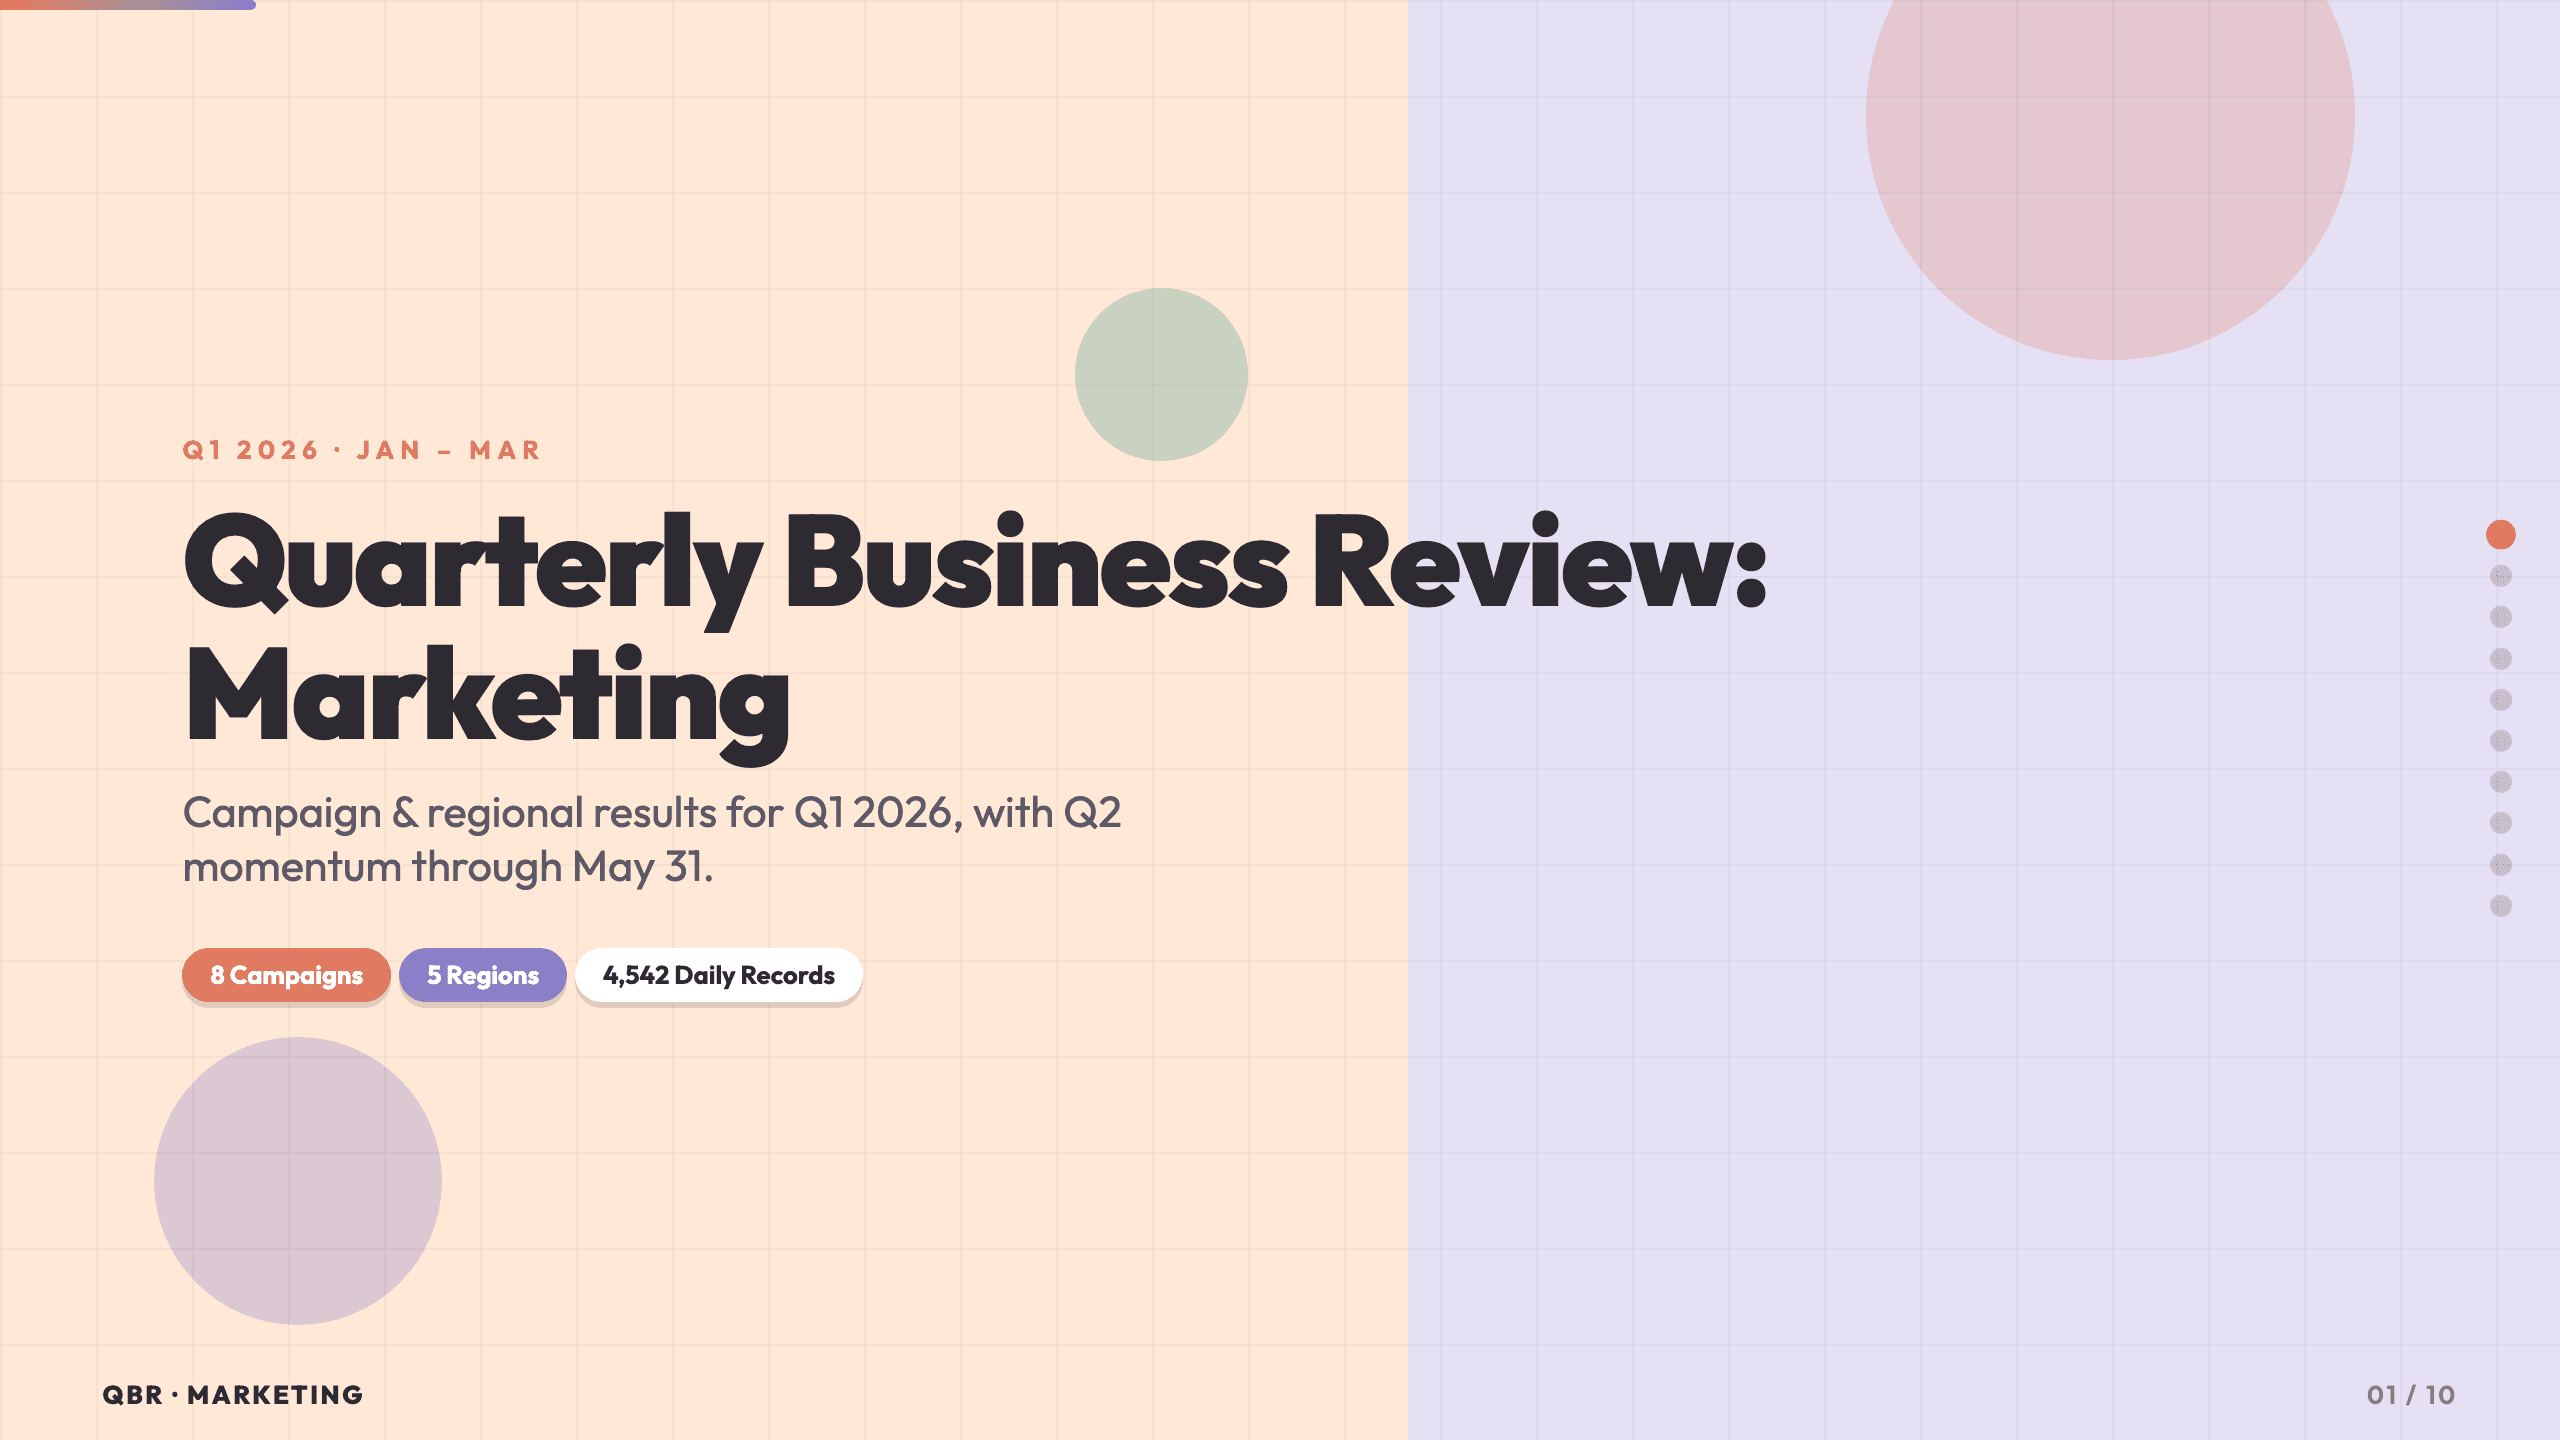
Find the story behind the spreadsheet
Julius does more than copy cells into slides. It analyzes your Excel data, surfaces the metrics and changes that matter, and helps frame them for the people viewing the presentation.

Turn findings into clear charts
Ask for the comparisons, trends, and breakdowns your audience needs. Julius creates data visualizations and places them into a presentation with concise explanations.
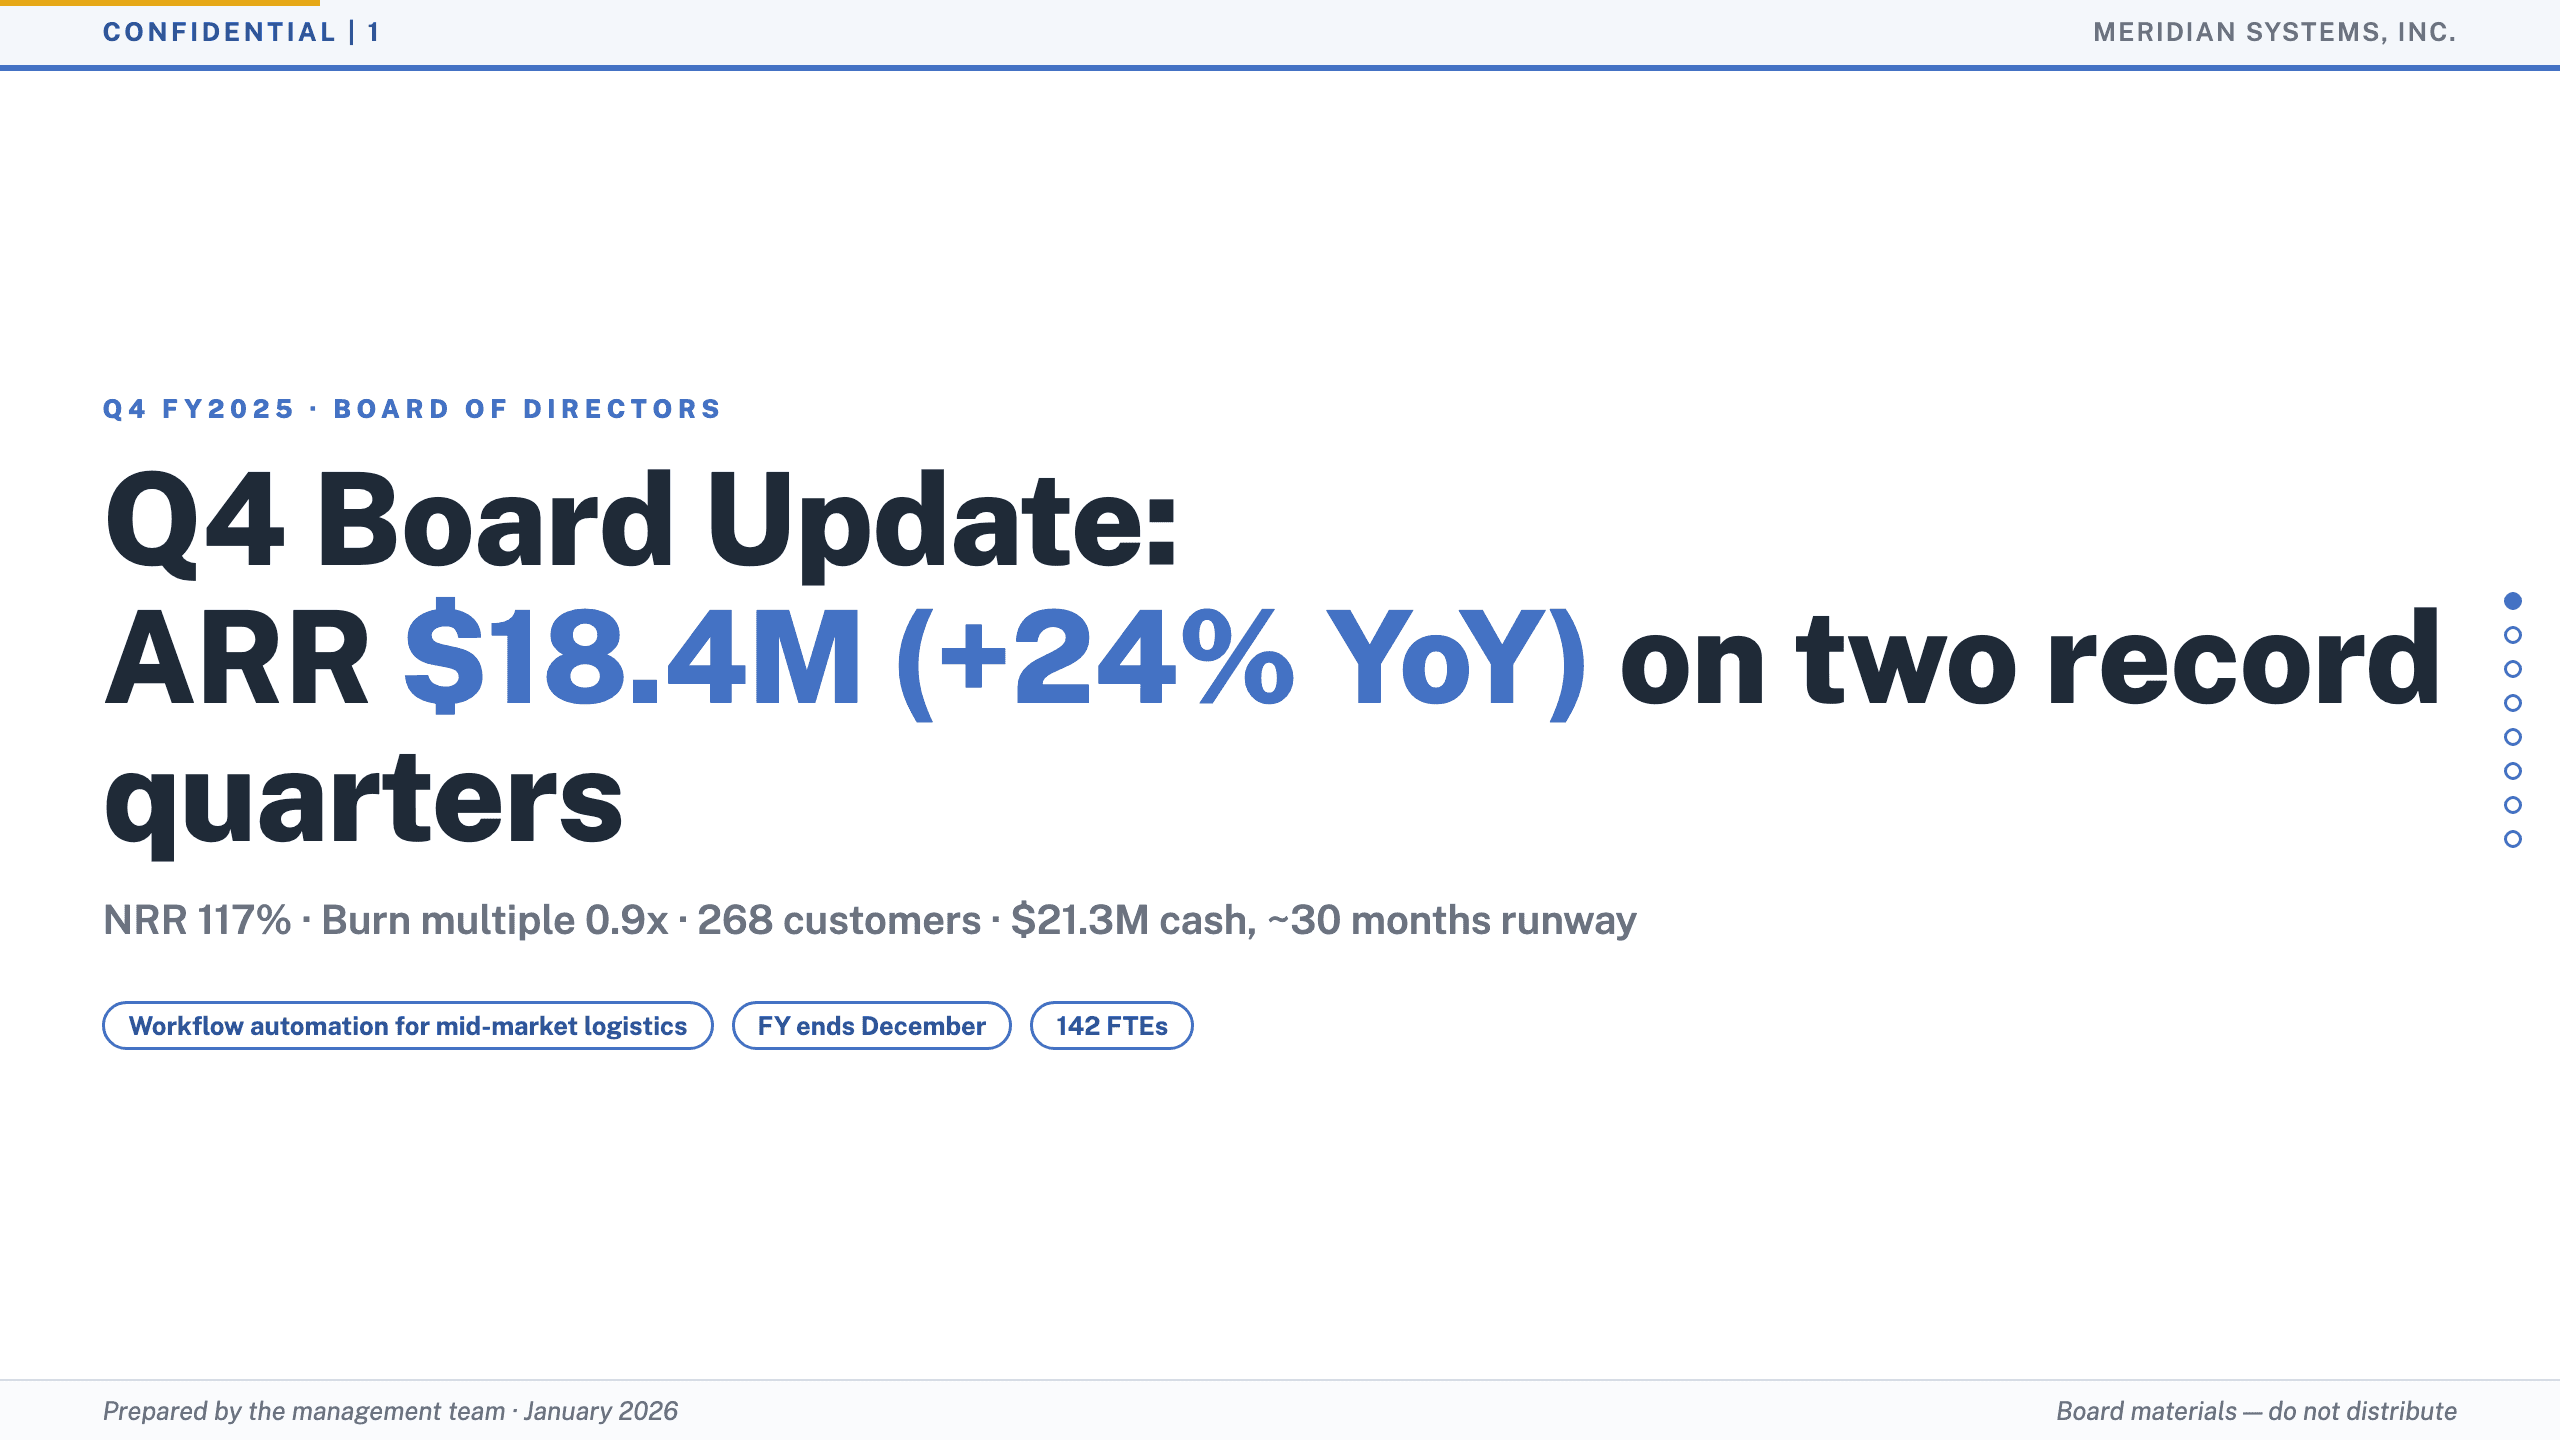
Create an editable, on-brand deck
Choose a template or provide brand guidance, revise the slides in conversation, and export the presentation to PowerPoint, PDF, PNG, or Google Slides.
Excel presentations you can create
Turn recurring analysis and one-off spreadsheets into decks for any audience.
Quarterly business reviews
Present performance, wins, misses, and next-quarter priorities.
Board and investor updates
Summarize company metrics, progress, runway, and key decisions.
Sales pipeline reviews
Explain funnel performance, forecasts, and regional trends.
Survey and research readouts
Turn response data into findings, charts, and recommendations.
Keep the presentation grounded in your data
Julius writes and runs code against the spreadsheet you upload, so the analysis comes from your actual values. You can inspect the work, ask follow-up questions, and review the final numbers before sharing the PowerPoint.
Frequently asked questions
Which spreadsheet formats can I use?
Can Julius analyze an Excel workbook with multiple tabs?
Can Julius create charts from my Excel data?
Is the exported PowerPoint editable?
How can I check the numbers before presenting?
Is the Excel to PowerPoint AI free to try?
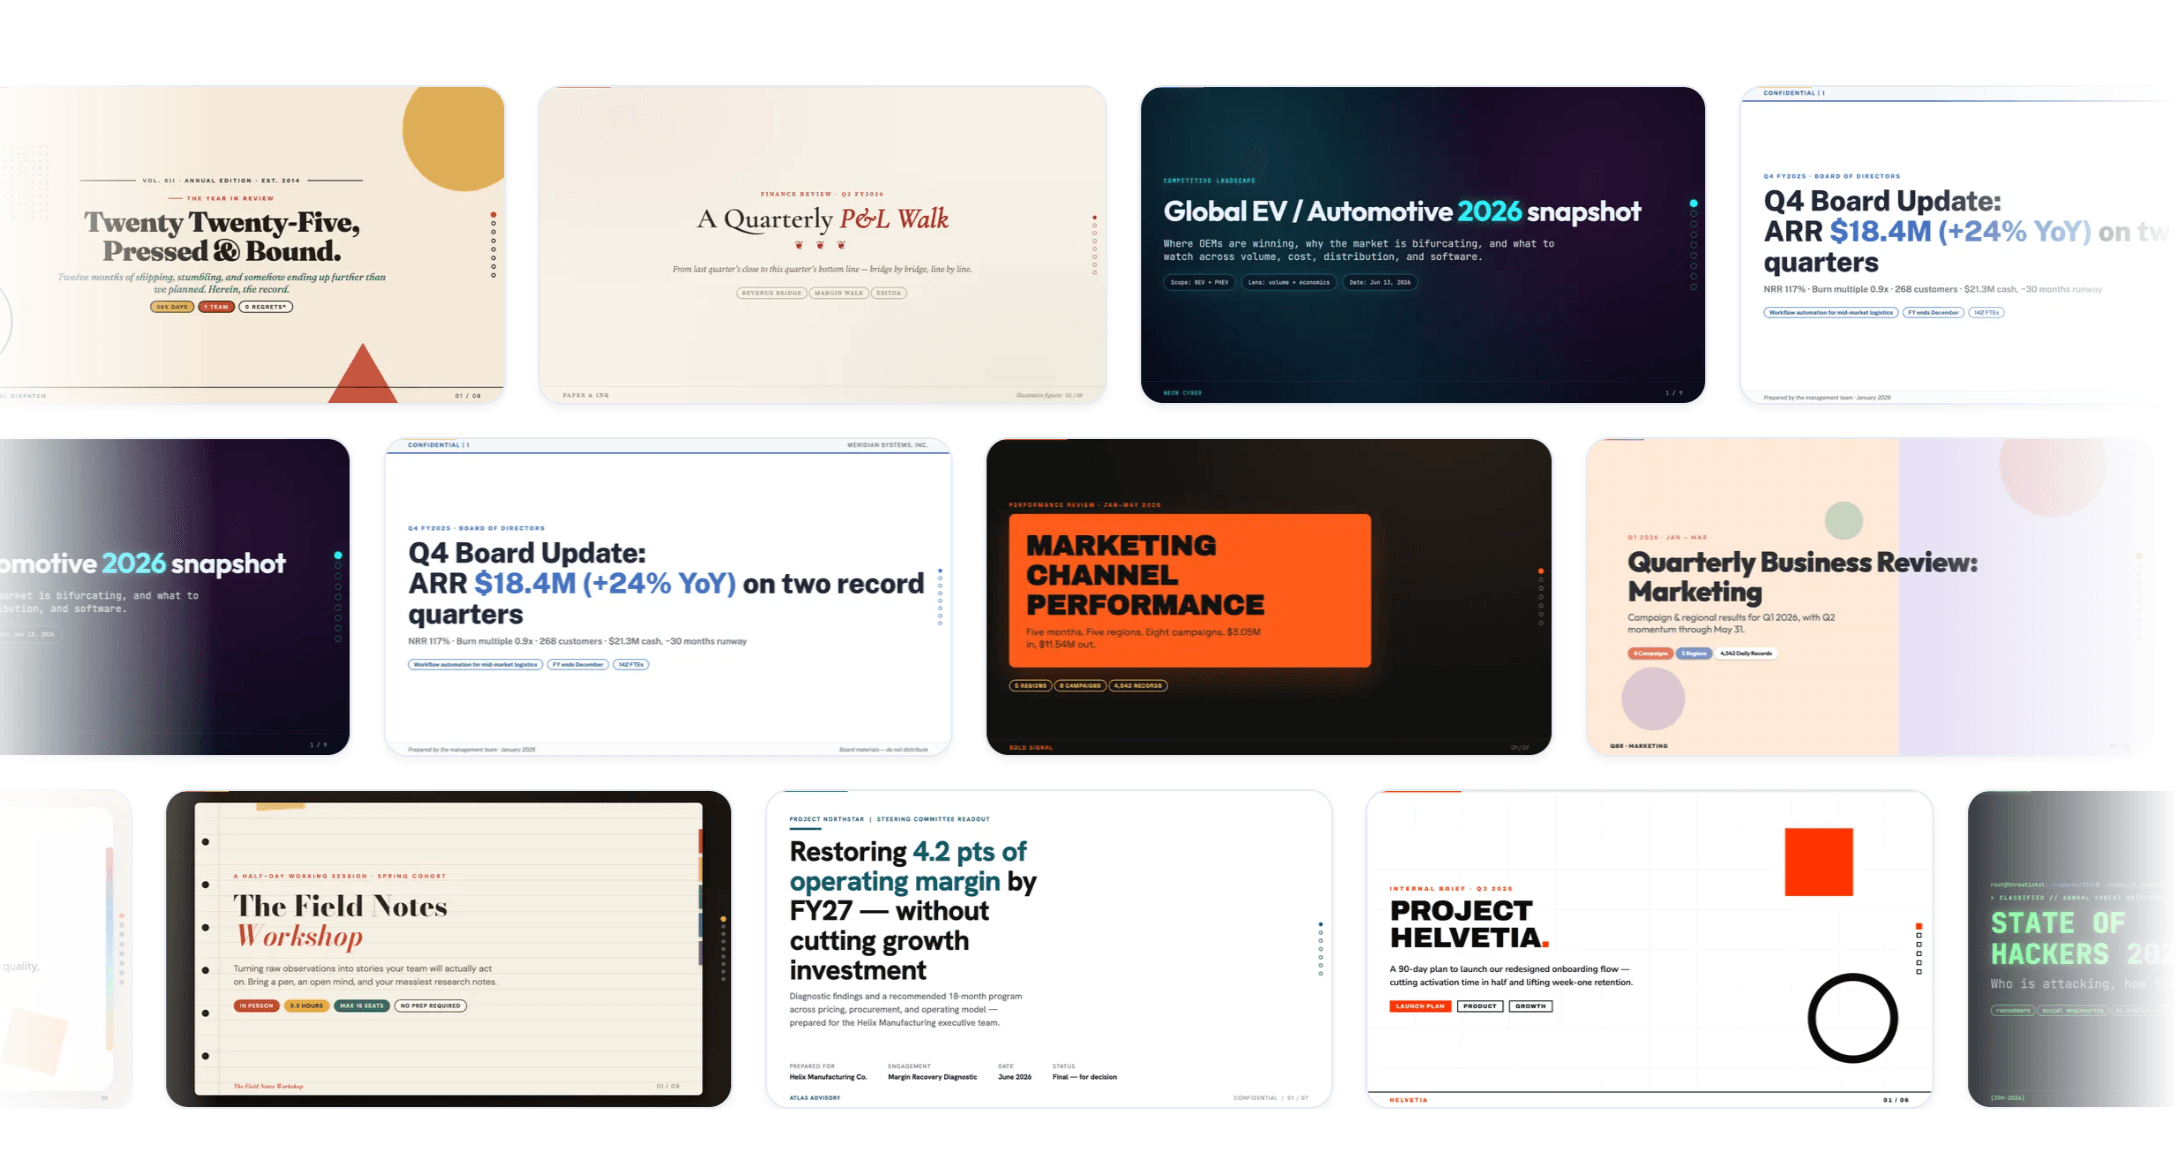
AI Presentation Maker
Build the finished presentation in Julius
Continue in the AI Presentation Maker to refine the story, choose a design, and export your spreadsheet insights as a polished deck.
Explore the AI Presentation Maker