Julius 1.2 Max
Work through complex analysis with additional reasoning and Julius’s file and creation tools.
Available on Pro, Max, Ultra, and Business. Compare plans
Reviewed · Sources
- Best suited to
- Complex analysis with additional reasoning
- Product type
- Julius agent
- Inputs
- Prompts and files supported by Julius
- Output
- Answers and deliverables through Julius tools
Julius 1.2 Max pricing
Julius agents use the credits included in your plan.
Prices in USD, reviewed October 13, 2026. API token charges are separate from Julius subscriptions and credits.
What is Julius 1.2 Max?
Julius 1.2 Max is a Julius agent for complex analysis with additional reasoning. Work with files, ask questions, and use Julius’s tools in one conversation.
Choose Max when an analysis involves several transformations or assumptions that need checking. Define the question, provide the files, and ask for an explanation of the approach and the final checks.
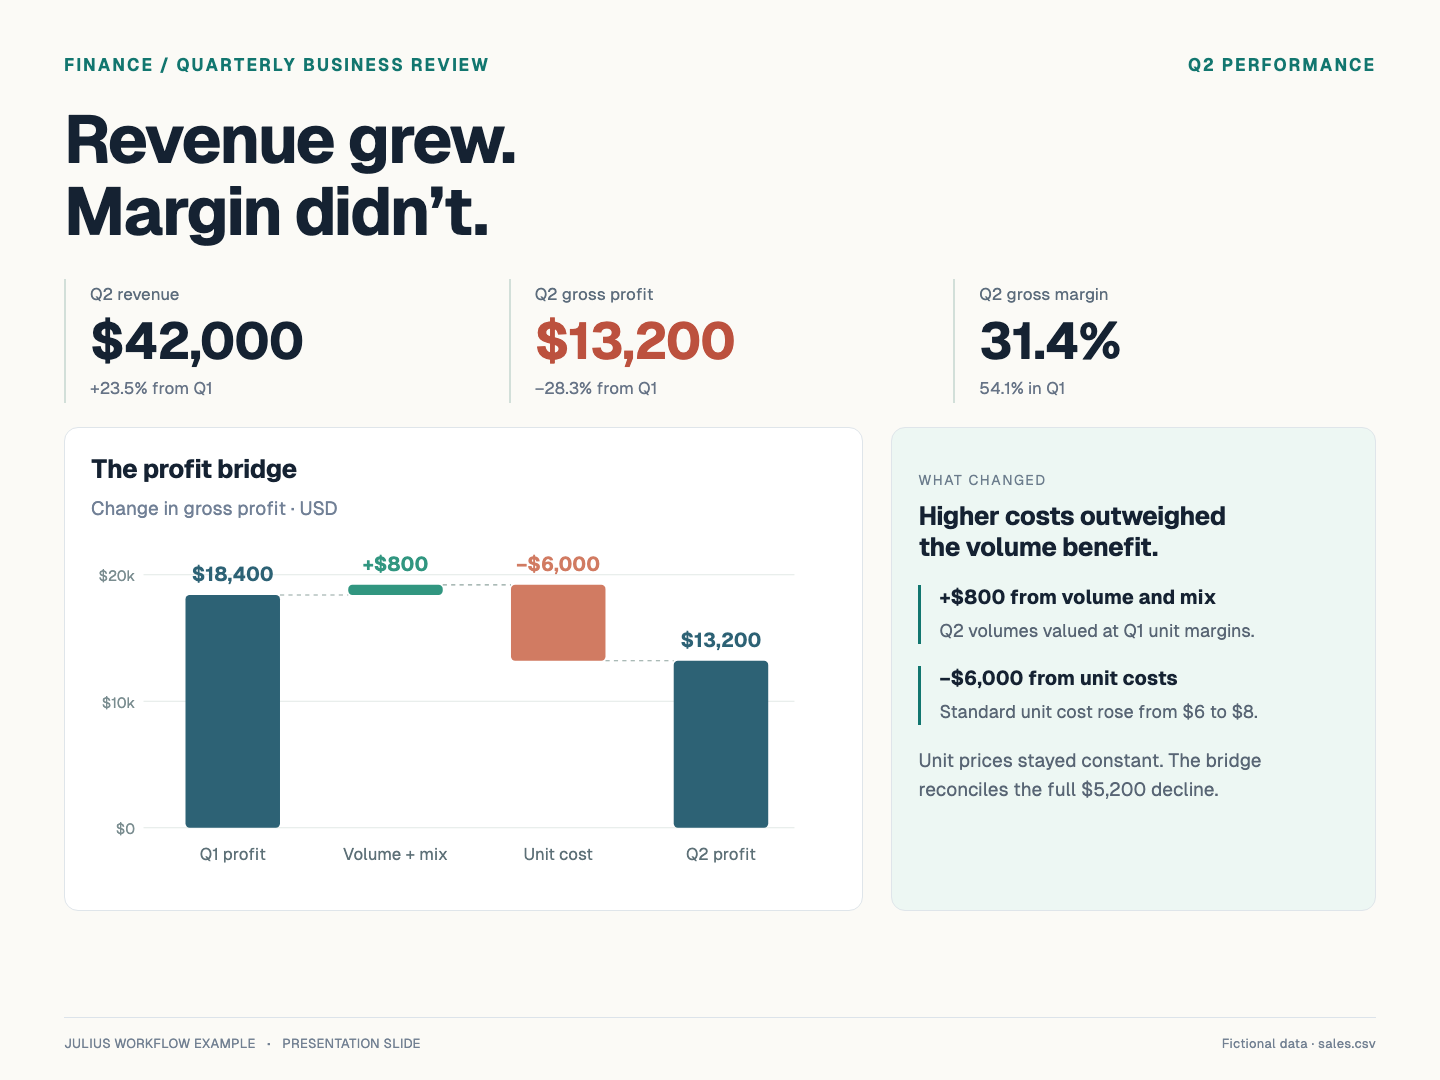
Explain why revenue rose while profit fell
A two-product business sold more in Q2. Why did it keep less of the revenue?
Worked example · Fictional sample data · Expected results calculated from the CSVs
1. Input
Quarterly sales and costs
2. Check
Separate volume, mix, and cost
3. Deliver
A reconciled profit bridge
View the prompt and sample data
Calculate revenue, gross profit, and gross margin for each quarter. Reconcile the gross-profit change into a volume/product-mix effect using Q1 unit margins and a unit-cost effect using Q2 volumes. Create a clear chart and a short management memo. State the assumptions; do not infer causes that are absent from the data.
sales.csv
quarter,product,units,unit_price,unit_cost
Q1,Standard,1000,10,6
Q1,Premium,800,30,12
Q2,Standard,3000,10,8
Q2,Premium,400,30,12
These expected results come from the downloadable Python calculations. This example illustrates a workflow; it is not a measured benchmark of Julius 1.2 Max.
Using Julius 1.2 Max in Julius
Start with your task
The try buttons carry Julius 1.2 Max into a new chat when your plan includes it. Example buttons also fill the composer with the sample data. Review the prompt, or replace it with your own files and question, before sending.
If the model is unavailable on your plan, Julius explains the access requirement. You can choose another option in the model menu.
Know the boundaries
- The model menu describes Max as using 2× more credits.
- These are Julius agent options, not standalone API models with a public per-token price. Credit usage depends on the work performed.
Model details and official research
Go to the original documentation for specifications, release details, and evaluation methods.
Julius 1.2 Max: frequently asked questions
Is Julius 1.2 Max available on Julius?
How much does Julius 1.2 Max cost?
How is Julius 1.2 Max different from a foundation model?
Explore other models and research
Read the details, compare tradeoffs, and find another model for your work.