
Two companies can report the same retention rate and have very different customer problems. One might be losing new users in their first week. The other might be keeping customers longer but earning less from each group.
Cohort analysis helps you see the difference, but the software you choose depends on the data you have.
We reviewed 9 cohort analysis software options, including Julius, Amplitude, and Mixpanel, based on cohort segmentation, retention reporting, revenue analysis, integrations, and pricing.
9 best cohort analysis software tools: TL;DR
- Julius: Best for analyzing exported customer data using plain-English prompts
- Amplitude: Best for advanced behavioral cohorts and product retention
- Mixpanel: Best for event-based retention and user journey analysis
- Heap: Best for analyzing automatically captured product interactions
- PostHog: Best for technical teams tracking product behavior
- Google Analytics 4: Best for website and app acquisition cohorts
- ChartMogul: Best for subscription MRR and revenue retention cohorts
- Userpilot: Best for onboarding and feature adoption analysis
- Matomo: Best for privacy-focused website retention analysis
What is cohort analysis?
Cohort analysis groups users or customers by something they share, such as their sign-up month or first purchase date, then tracks how each group behaves over time.
For example, a SaaS team can compare how many January sign-ups return after 30 days versus February sign-ups. These comparisons help reveal retention and churn patterns that an overall average may hide.
How we evaluated these cohort analysis tools
We compared these 9 tools based on their documented cohort features, pricing, and how well they support different business needs. Our evaluation focused on five factors:
- Cohort segmentation: Can you group users by acquisition date, behavior, or revenue?
- Retention tracking: Does the tool offer cohort tables, retention charts, and custom reporting periods?
- Revenue analysis: Can you compare purchase activity, customer lifetime value, or subscription MRR?
- Integrations: Can it work with your existing data sources, analytics platforms, and business tools?
- Pricing: What cohort features are available for free, and what do you need to pay to access advanced reports?
These criteria help distinguish tools built for continuous product tracking from those better suited to subscription reporting or analyzing existing datasets.
9 best cohort analysis software: Side-by-side comparison
The right tool depends on the type of data you're analyzing. Product analytics platforms work well for tracking user behavior over time, while subscription analytics tools focus on revenue retention and churn. Here are 9 options worth considering:
| Tool | Cohort segmentation | Retention tracking | Revenue cohorts | Free plan | Starting price |
| Julius | Custom, file-based | Generated tables/charts | Custom analysis | Yes | $20/month |
| Amplitude | Acquisition, behavioral | Retention charts | LTV analysis | Yes | Free; usage-based |
| Mixpanel | Acquisition, behavioral | Retention reports | Purchase events | Yes | $140/month |
| Heap | Acquisition, behavioral | Retention charts | Custom analysis | Yes | Custom quote |
| PostHog | Acquisition, behavioral | Charts and tables | Custom analysis | Yes | $0.00005/event |
| GA4 | Acquisition, events | Cohort explorations | Purchase events | Yes | Custom |
| ChartMogul | Subscription, revenue | Retention curves | Native MRR cohorts | Yes | $69/month |
| Userpilot | Behavioral, onboarding | Retention reports | Limited | Trial only | $299/month |
| Matomo | Acquisition, visitor | Cohort reports | E-commerce revenue | Core only | $26/month |
The 9 best cohort analysis software tools in 2026
1. Julius: Best for analyzing cohort data using plain English
Julius is an AI data analyst tool that helps you analyze datasets, create charts, and spot patterns by asking questions in plain English.

You can upload Excel or CSV files containing customer IDs, sign-up dates, and activity records, then ask Julius to group customers into cohorts and compare retention rates.
Best for: Marketing, finance, and business teams that want to analyze existing customer data without writing SQL.
Key features
- Custom cohorts: Group customers by acquisition date, purchase behavior, or revenue using the fields in your dataset.
- Retention tracking: Generate cohort tables and charts to compare customer activity across weeks or months.
- Data integrations: Work with uploaded files and Google Drive, with database connections such as Snowflake and PostgreSQL available on Business plans.
Pros
- Analyze cohort data using plain-English prompts
- Create custom retention tables, charts, and visualizations
- Work with spreadsheets and multiple data sources
Cons
- Requires prepared data and manual validation of AI-generated calculations
- Doesn't continuously capture product events like dedicated analytics platforms
Pricing
- Free plan that includes daily credits for basic analysis
- Paid plans start from $20/month, billed monthly, with 2,000 monthly credits and access to more advanced AI models
2. Amplitude: Best for advanced behavioral cohorts and product retention
Amplitude is a product analytics platform that lets you define cohorts using customer actions and properties, then examine how those groups behave over time.
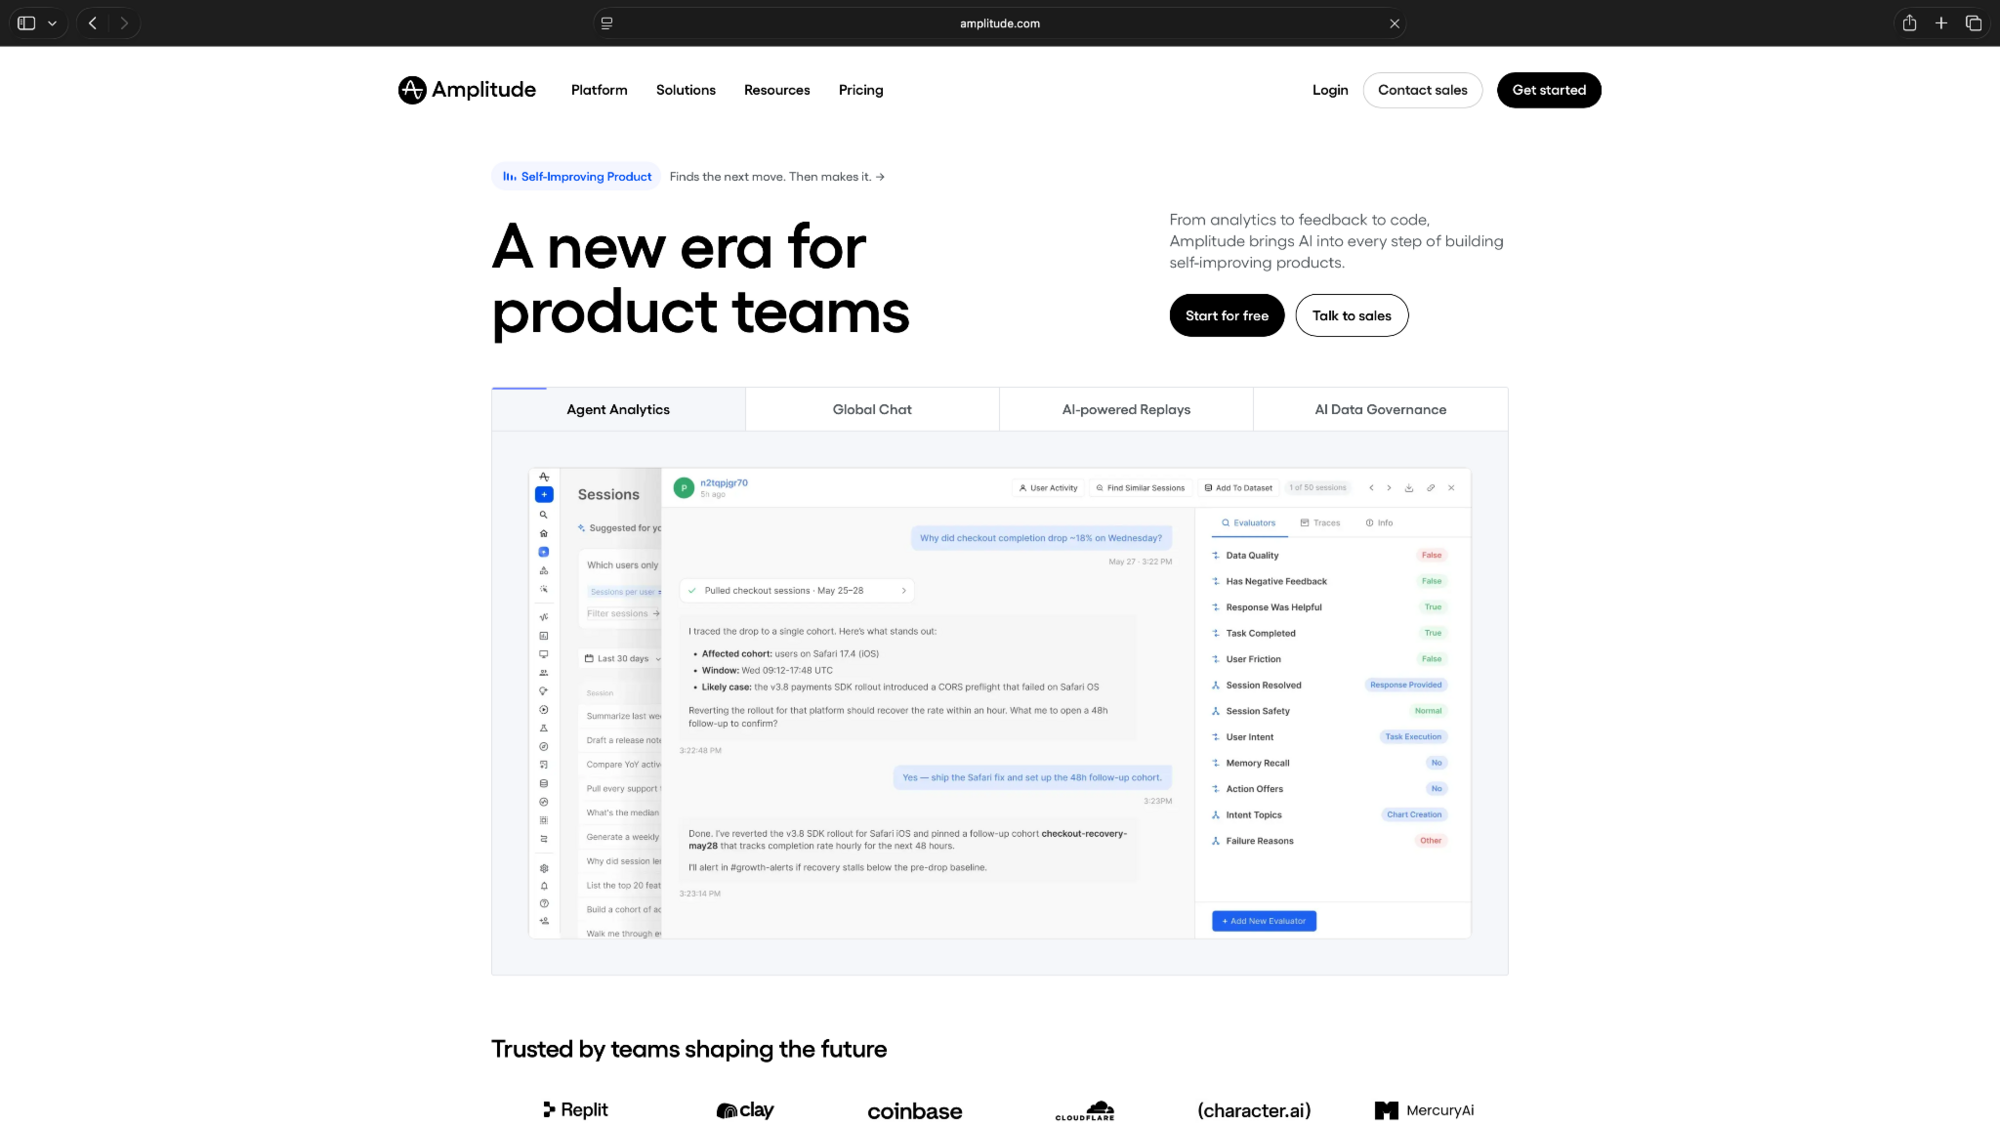
Its flexibility makes it useful for SaaS businesses that want to understand whether onboarding changes, new features, or acquisition campaigns affect retention. Amplitude integrates with Segment, Snowflake, HubSpot, and Braze, among other platforms.
Best for: Product teams that need detailed behavioral analysis and custom cohort segmentation.
Key features
- Behavioral cohorts: Segment users by actions, properties, and event sequences.
- Retention analysis: Compare returning users across different time periods using retention charts.
- Revenue analysis: Analyze purchase and revenue events, although subscription MRR reporting requires additional modeling.
Pros
- Create behavioral cohorts using custom events and user properties
- Compare retention across different customer segments
- Supports integrations with analytics and marketing platforms
Cons
- Advanced configuration and event tracking take practice
- Higher event volumes can increase monthly costs
Pricing
- Free plan with 2 million events/month and core product analytics
- Free for the first 2M events/month, then usage-based pricing that scales with event volume
3. Mixpanel: Best for event-based retention and user journey analysis
Mixpanel helps teams understand how users interact with websites and apps through event-based tracking.
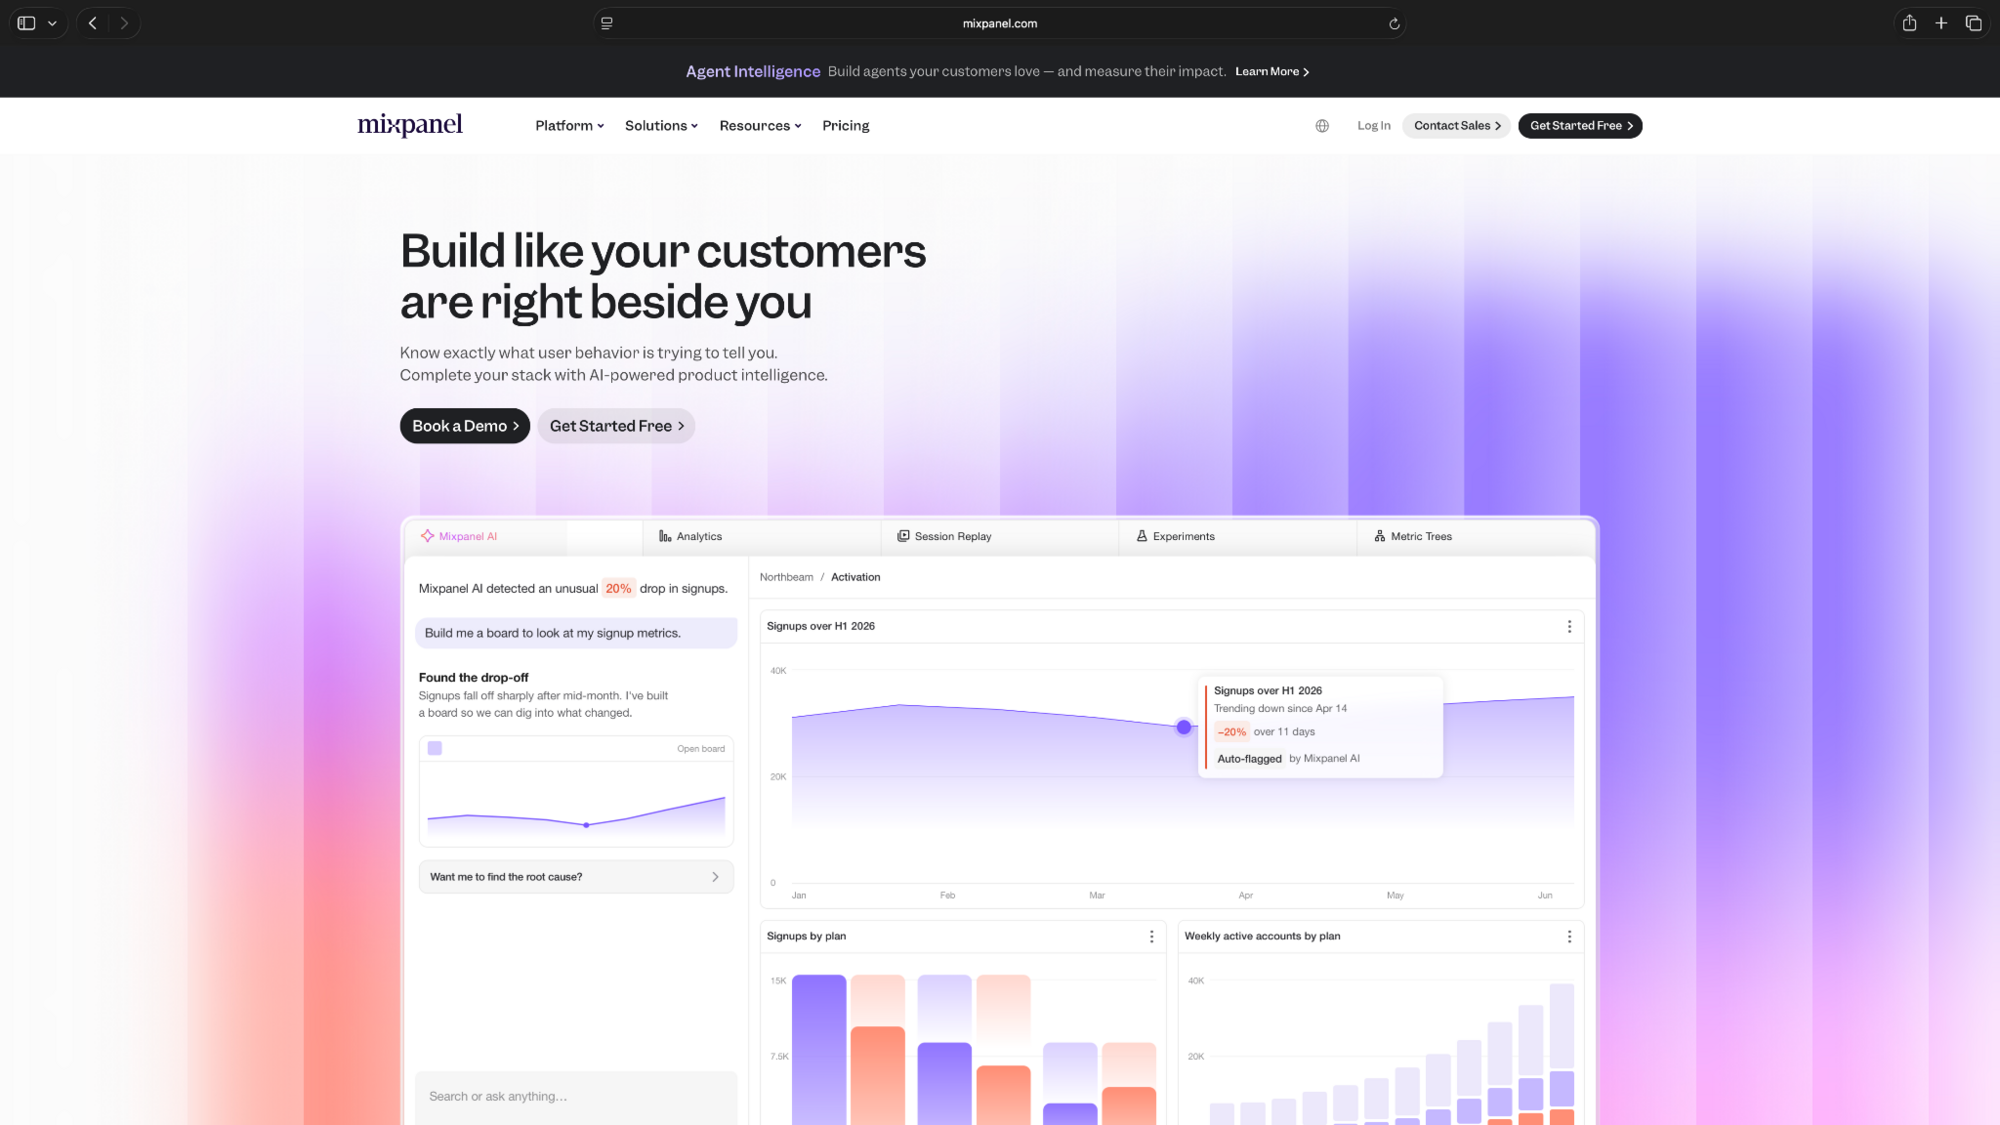
It offers funnel analysis, user segmentation, and built-in cohort reports. You can compare users who completed specific actions, such as activating an account, making a purchase, or using a feature.
Mixpanel supports integrations such as Snowflake and Segment, alongside web and mobile SDKs.
Best for: SaaS and mobile app teams tracking feature adoption, conversion funnels, and user retention.
Key features
- Behavioral cohorts: Group users based on events, properties, and engagement patterns.
- Retention reports: Track how frequently users return and compare retention across different cohorts.
- Revenue analysis: Measure purchases and other revenue-related events, with custom reporting for financial metrics.
Pros
- Track user retention through custom events and cohorts
- Compare conversion funnels and user journeys
- Access core retention reports on the free plan
Cons
- Inconsistent event definitions can affect reporting accuracy
- Monthly costs increase as event volume grows
Pricing
- Free plan with 1 million events/month, retention reports, and up to five saved reports per seat
- Paid plans from $140/month for 1.5 million events, billed monthly, with pricing increasing by usage
4. Heap by Contentsquare: Best for automatically captured behavioral data
Heap is a product analytics platform within Contentsquare that automatically captures user interactions across websites and applications. It supports revenue-related segmentation when suitable transaction or account data is available, but subscription MRR cohorts aren't its main focus.
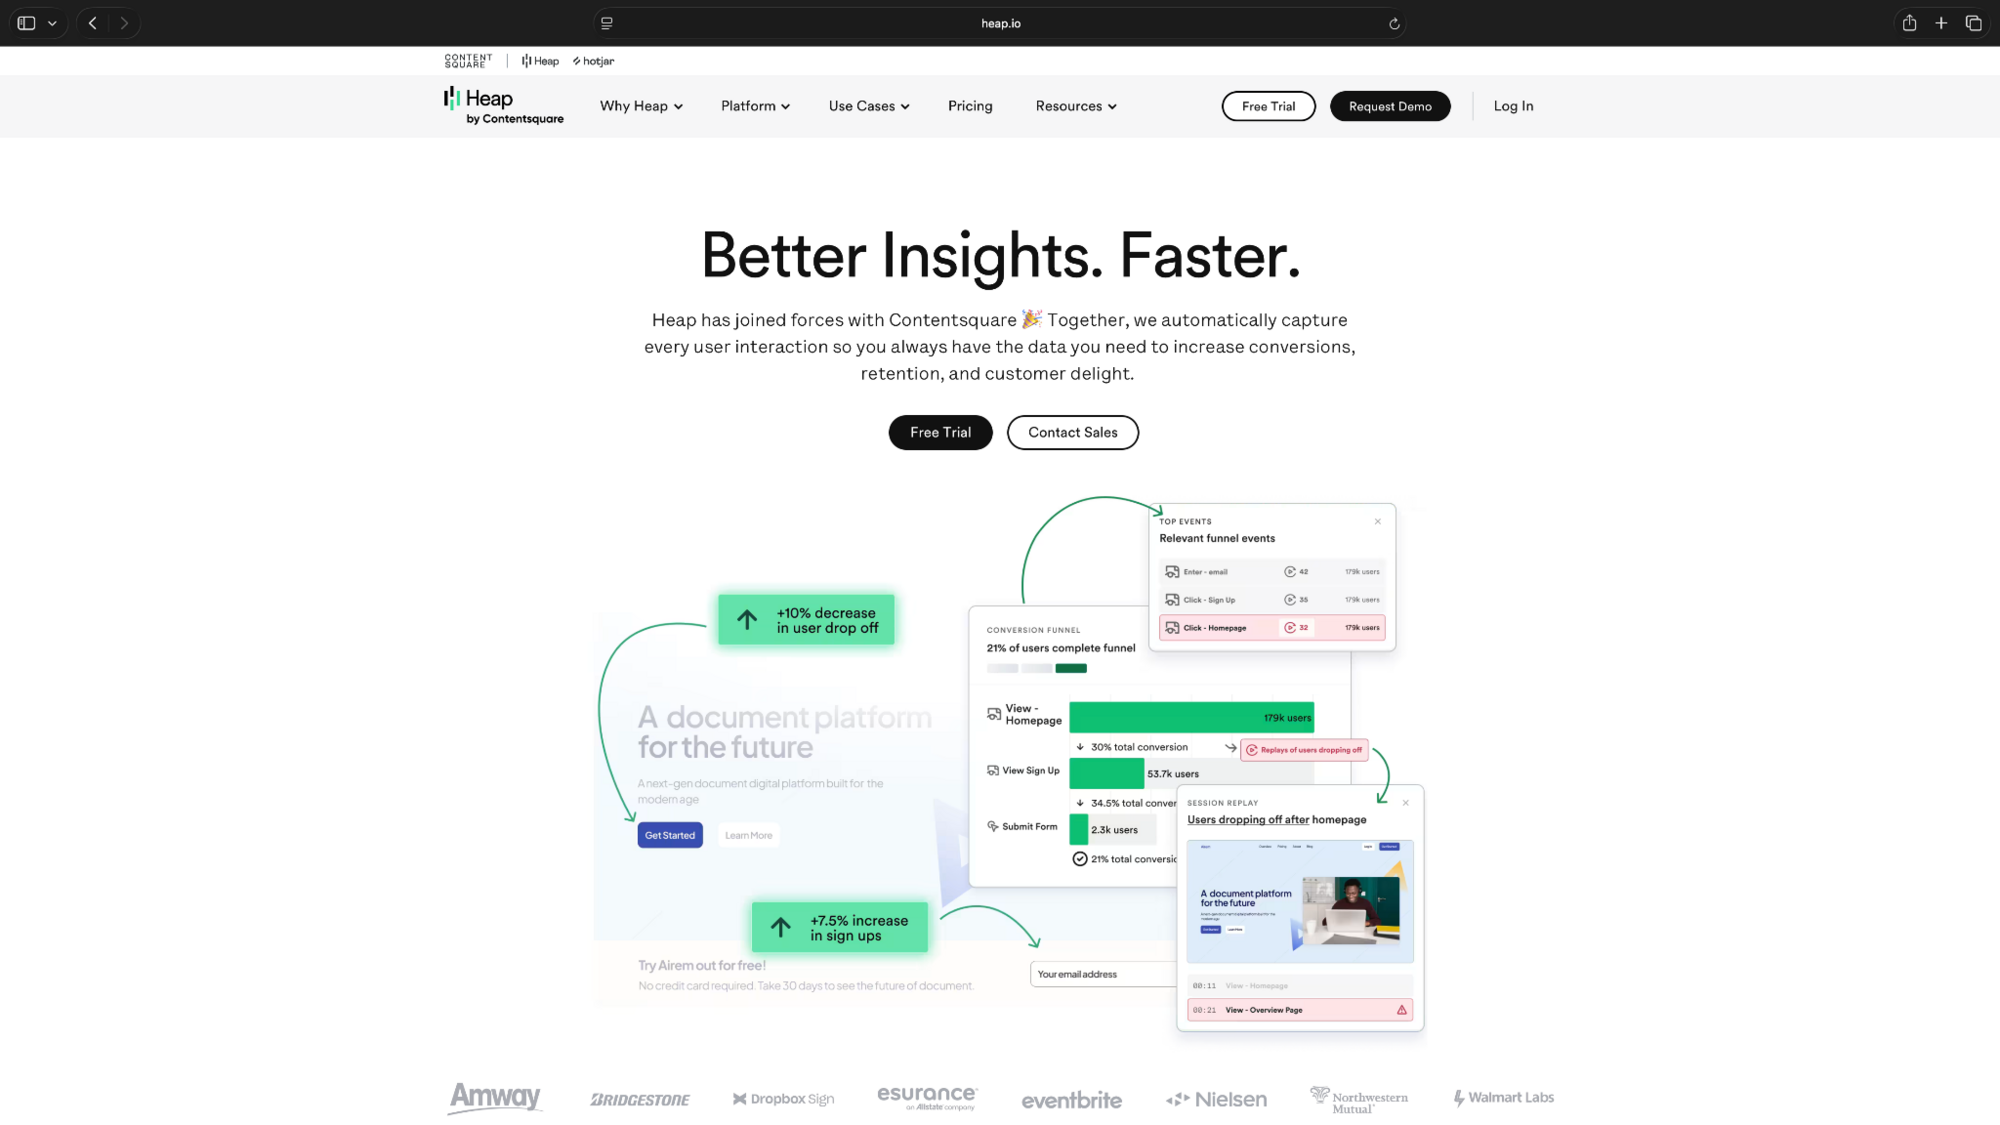
Heap’s biggest advantage is historical event capture. You can investigate behaviors you didn't originally plan to track, which helps when an unexpected retention problem appears.
Best for: Product managers who need behavioral insights with less manual event tagging.
Key features
- Acquisition and behavioral cohorts: Compare users by sign-up periods, demographics, and product interactions.
- Retention reports: Analyze weekly cohorts, returning users, and actions associated with long-term engagement.
- Data integrations: Connect account data from platforms like Salesforce to study retention across customer segments.
Pros
- Automatically captures interactions for historical analysis
- Creates behavioral cohorts with less manual event tagging
- Connects product activity with CRM data
Cons
- Advanced reports and customization require some learning
- Session-based pricing can make costs harder to predict
Pricing
- Free plan includes up to 10,000 monthly sessions, core analytics charts, and six months of data history
- Session-based pricing with a custom estimate
5. PostHog: Best for technical teams tracking product behavior
PostHog combines product analytics, session replay, feature flags, and experimentation tools in one platform. PostHog also supports SQL queries for teams that need more control over their analysis.
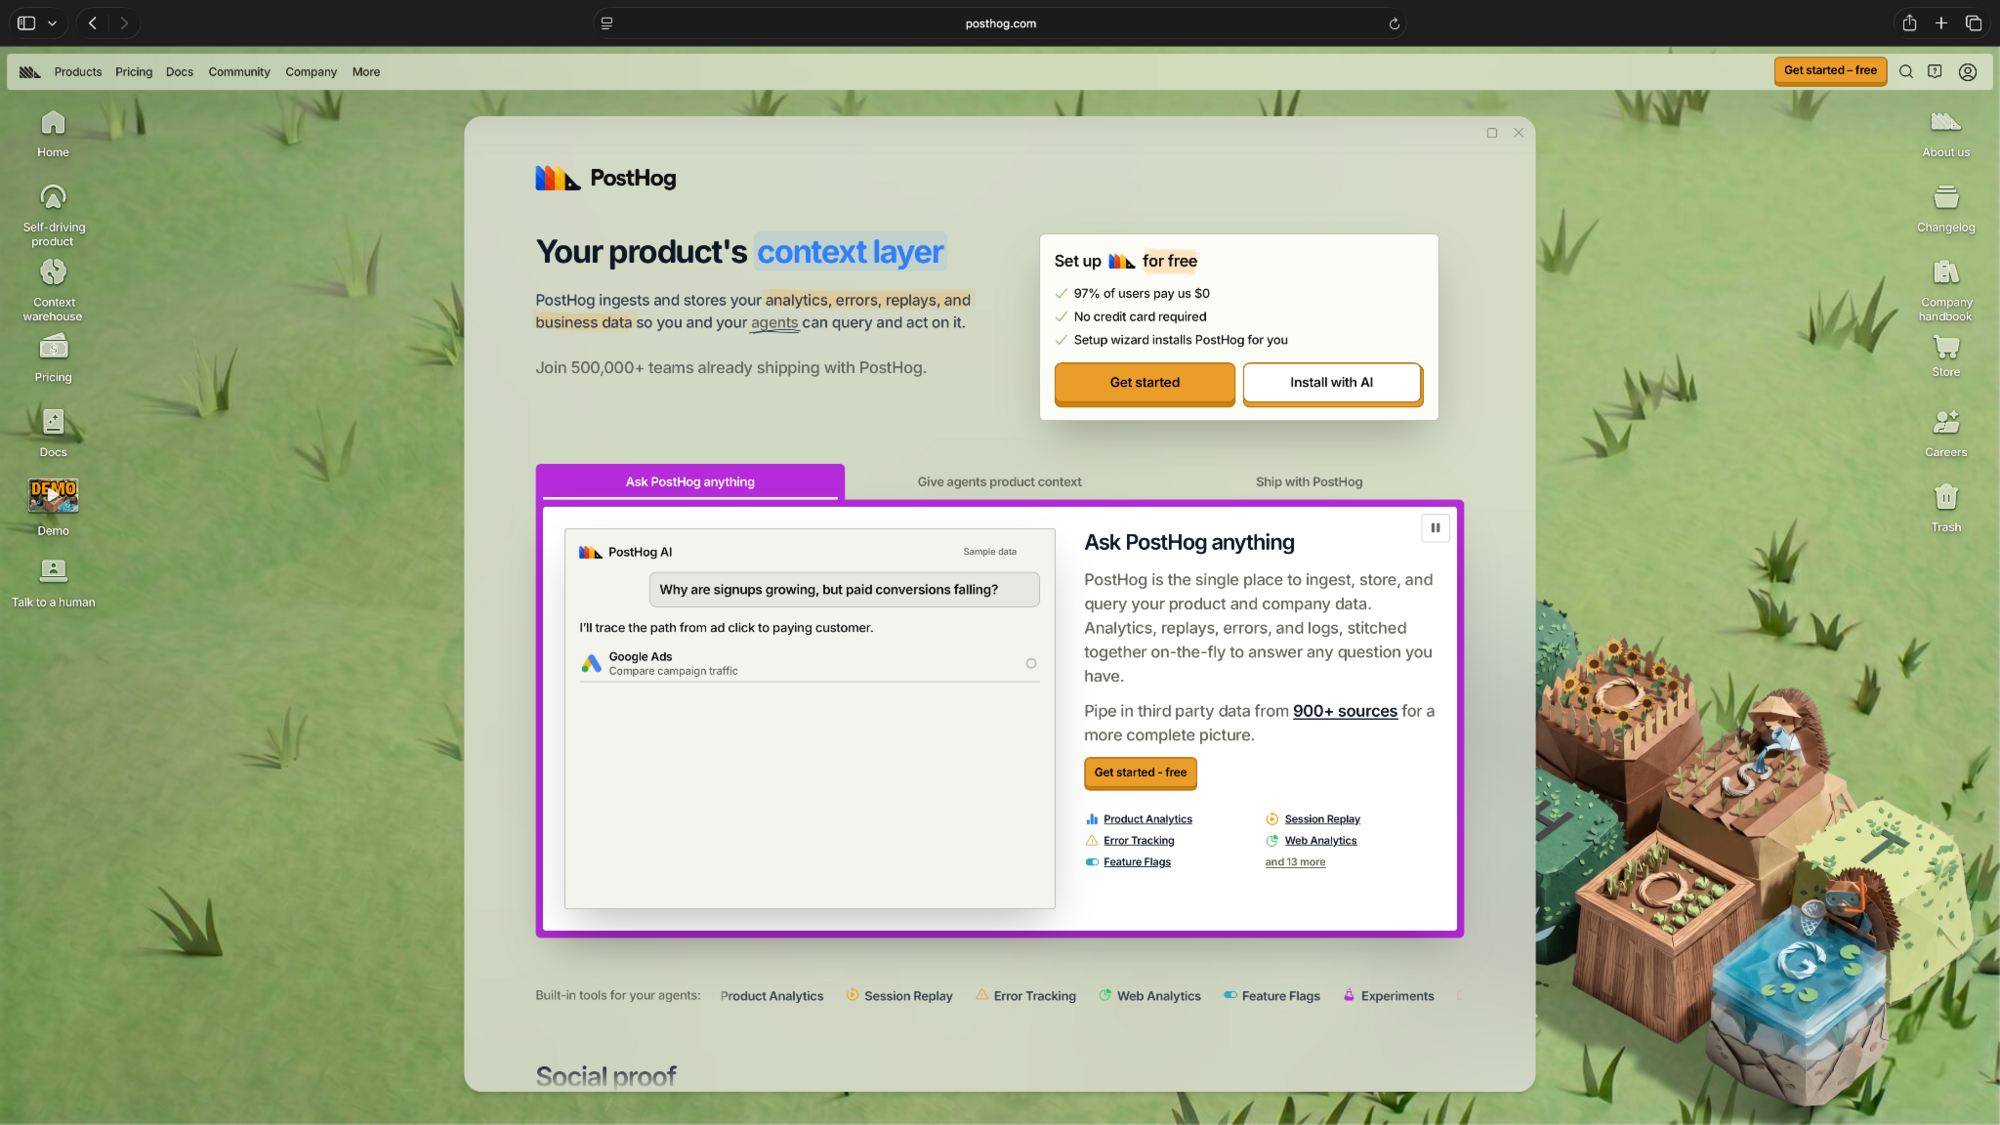
It supports cohort analysis based on user actions, making it useful for teams that want to track retention before and after product releases.
Best for: Developers and technical product teams that want analytics and experimentation in the same platform.
Key features
- Custom cohorts: Group users by acquisition events, product activity, properties, and feature exposure.
- Retention charts: Compare cohorts using retention tables, graphs, and daily, weekly, or monthly periods.
- Revenue data: Connect sources such as Stripe and Snowflake for financial analysis, although dedicated MRR cohort reporting requires additional work.
Pros
- Combine cohort analysis with session replay and experimentation
- Create custom retention reports using events and SQL
- Generous free allowance for product analytics
Cons
- The range of features can overwhelm new users
- Advanced configurations may require technical expertise
Pricing
- Free plan includes 1 million analytics events/month and 5,000 session recordings
- Pay-as-you-go pricing starts at $0.00005/additional analytics event, billed monthly, with discounts at higher volumes.
6. Google Analytics 4: Best for free website and app acquisition cohorts
Google Analytics 4 is a free analytics platform for tracking website and app activity, including user acquisition, engagement, and retention. GA4 integrates with Google Ads, Search Console, BigQuery, and Looker Studio.
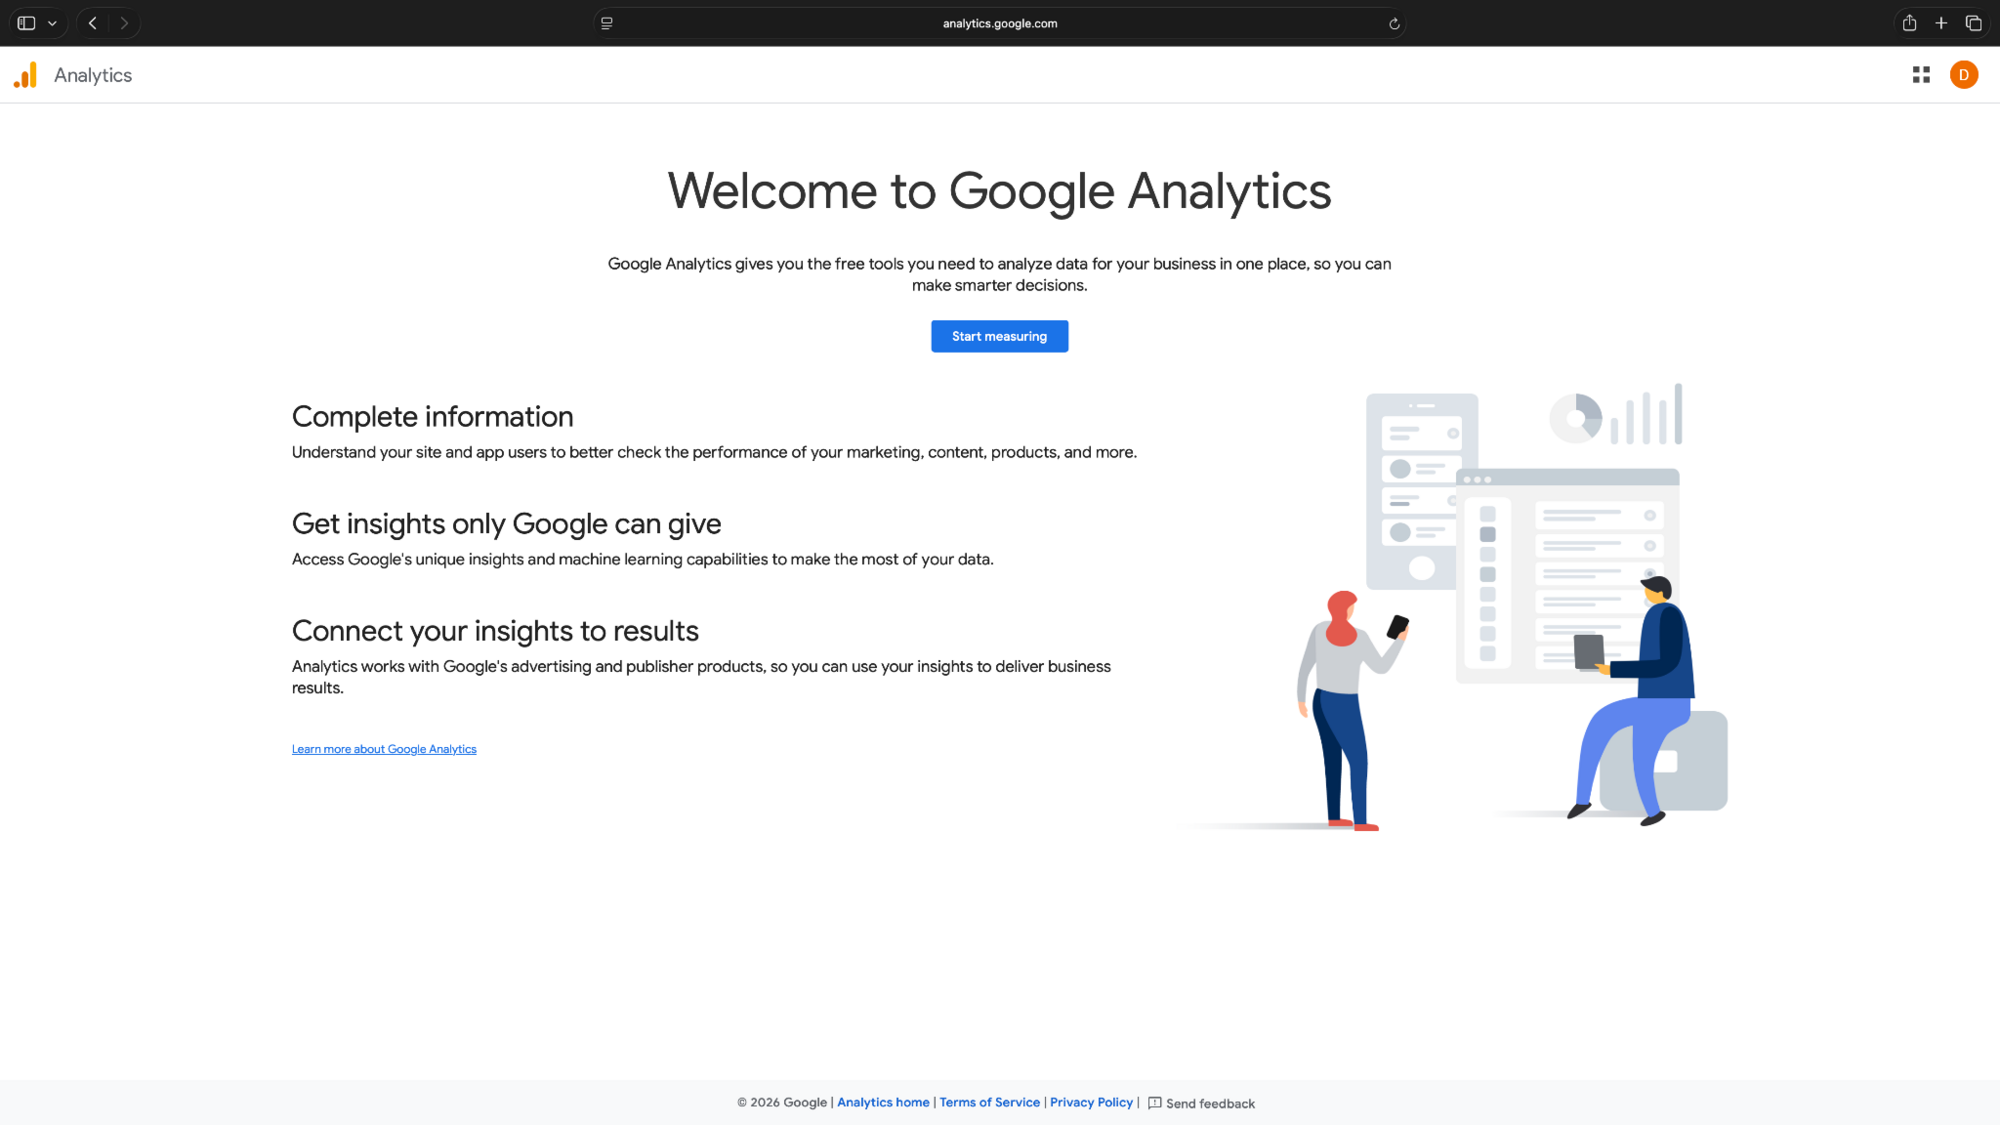
Its Cohort Exploration feature lets you compare groups based on when they first visited your website or completed a particular event.
Best for: Marketing teams that want to compare acquisition channels, website engagement, and returning visitors.
Key features
- Acquisition cohorts: Group visitors by their first visit and other inclusion criteria.
- Retention tables: Track returning users over daily, weekly, or monthly periods.
- Purchase cohorts: Compare transaction activity and revenue metrics across customer groups.
Pros
- Free cohort analysis for websites and apps
- Integrates with Google Ads, BigQuery, and Looker Studio
- Tracks acquisition, retention, and purchase behavior
Cons
- Cohort Exploration takes some setup
- Device-based identification can limit cross-device analysis
Pricing
- Free plan: Standard GA4 includes cohort explorations, retention reporting, and core website analytics.
- Paid plan: Analytics 360 offers enterprise analytics through custom pricing. Google doesn't publish a standard monthly-billed starting price.
7. ChartMogul: Best for subscription revenue and MRR cohorts
ChartMogul focuses on subscription analytics, making it useful for SaaS businesses tracking customer retention, churn, and recurring revenue. Its cohort reports group customers by their first subscription date and show how revenue and subscriber counts change over time.
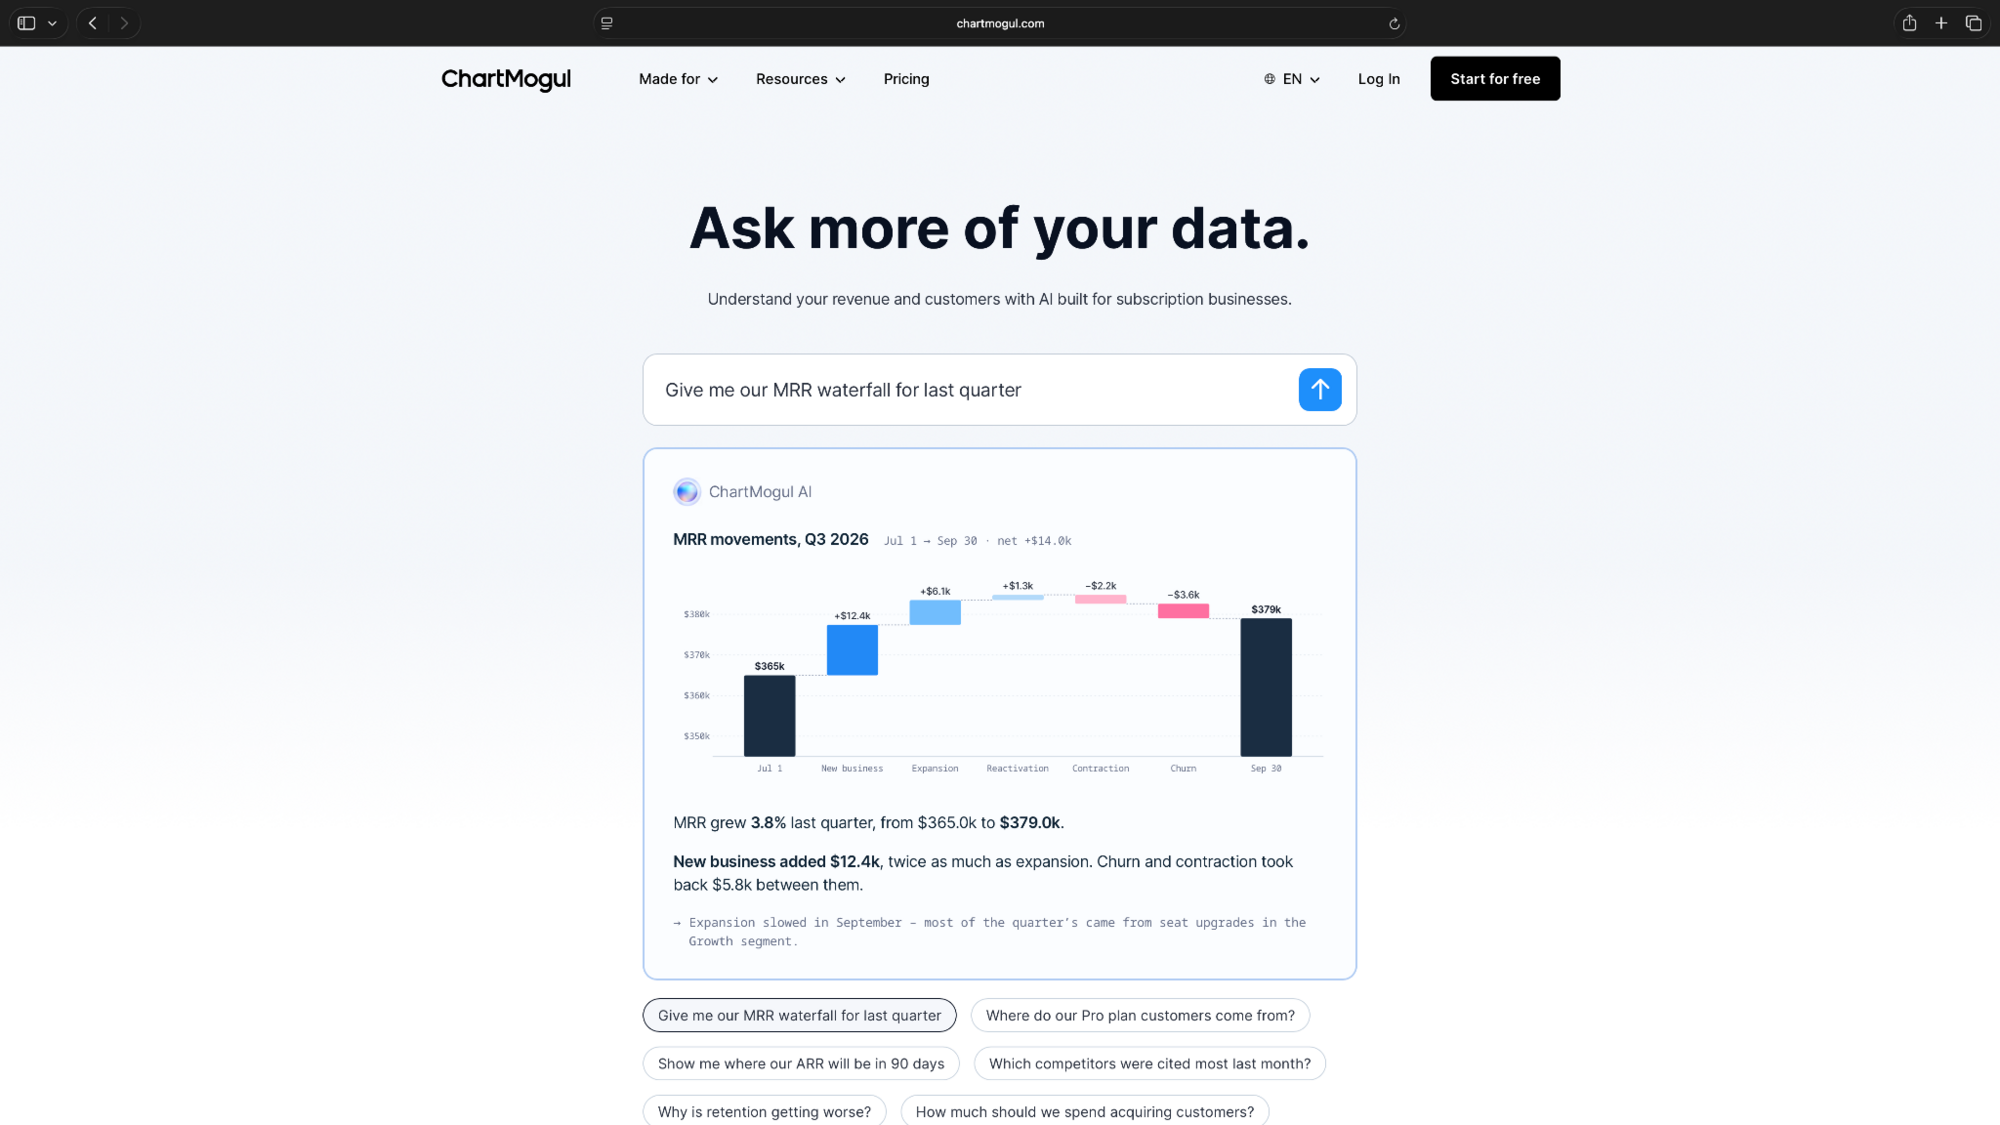
ChartMogul connects with billing platforms such as Stripe, Chargebee, and Paddle, alongside CRM and reporting integrations.
Best for: SaaS founders, finance teams, and revenue operations teams tracking subscription performance.
Key features
- Subscription cohorts: Group customers by subscription start date, pricing plan, or customer attributes.
- Retention reports: Measure customer retention, churn, and trial-to-paid conversion.
- Revenue cohorts: Track net MRR retention, expansion, contraction, and reactivation with cohort tables and curves.
Pros
- Dedicated MRR and subscription retention cohorts
- Tracks churn, expansion, and contraction revenue
- Integrates with popular subscription billing platforms
Cons
- Primarily designed for subscription-based businesses
- Pricing increases as tracked subscription revenue grows
Pricing
- Free plan for subscription businesses tracking up to $10,000 in monthly recurring revenue (MRR)
- Paid plans start from $69/month, billed monthly, and increase as the subscription revenue being tracked grows
8. Userpilot: Best for onboarding and feature adoption analysis
Userpilot combines product analytics with in-app onboarding, user engagement, and feedback tools. It helps SaaS businesses understand how new users interact with their products and whether onboarding experiences encourage them to return.

Userpilot integrates with Amplitude, Mixpanel, HubSpot, and Segment, among other tools.
Best for: SaaS product teams that want retention insights alongside onboarding and adoption tools.
Key features
- Behavioral cohorts: Segment users by product actions, attributes, and feature engagement.
- Retention analysis: Compare cohorts over time and examine how onboarding affects returning users.
- Product engagement: Use guides, checklists, and surveys alongside analytics to investigate adoption problems.
Pros
- Combines retention analytics with onboarding tools
- Tracks feature adoption and user engagement
- Supports behavioral segmentation and in-app feedback
Cons
- Cohort retention reporting requires the higher-priced Growth plan
- Advanced analytics and customization take time to learn
Pricing
- No free plan, only a free trial
- Paid plans start from $299/month, billed monthly
9. Matomo: Best for privacy-focused website cohort analysis
Matomo is a privacy-focused web analytics platform that gives businesses control over their analytics data. Its Cohorts feature helps you examine how groups of visitors behave after their first visit, including whether they return, convert, or generate revenue.
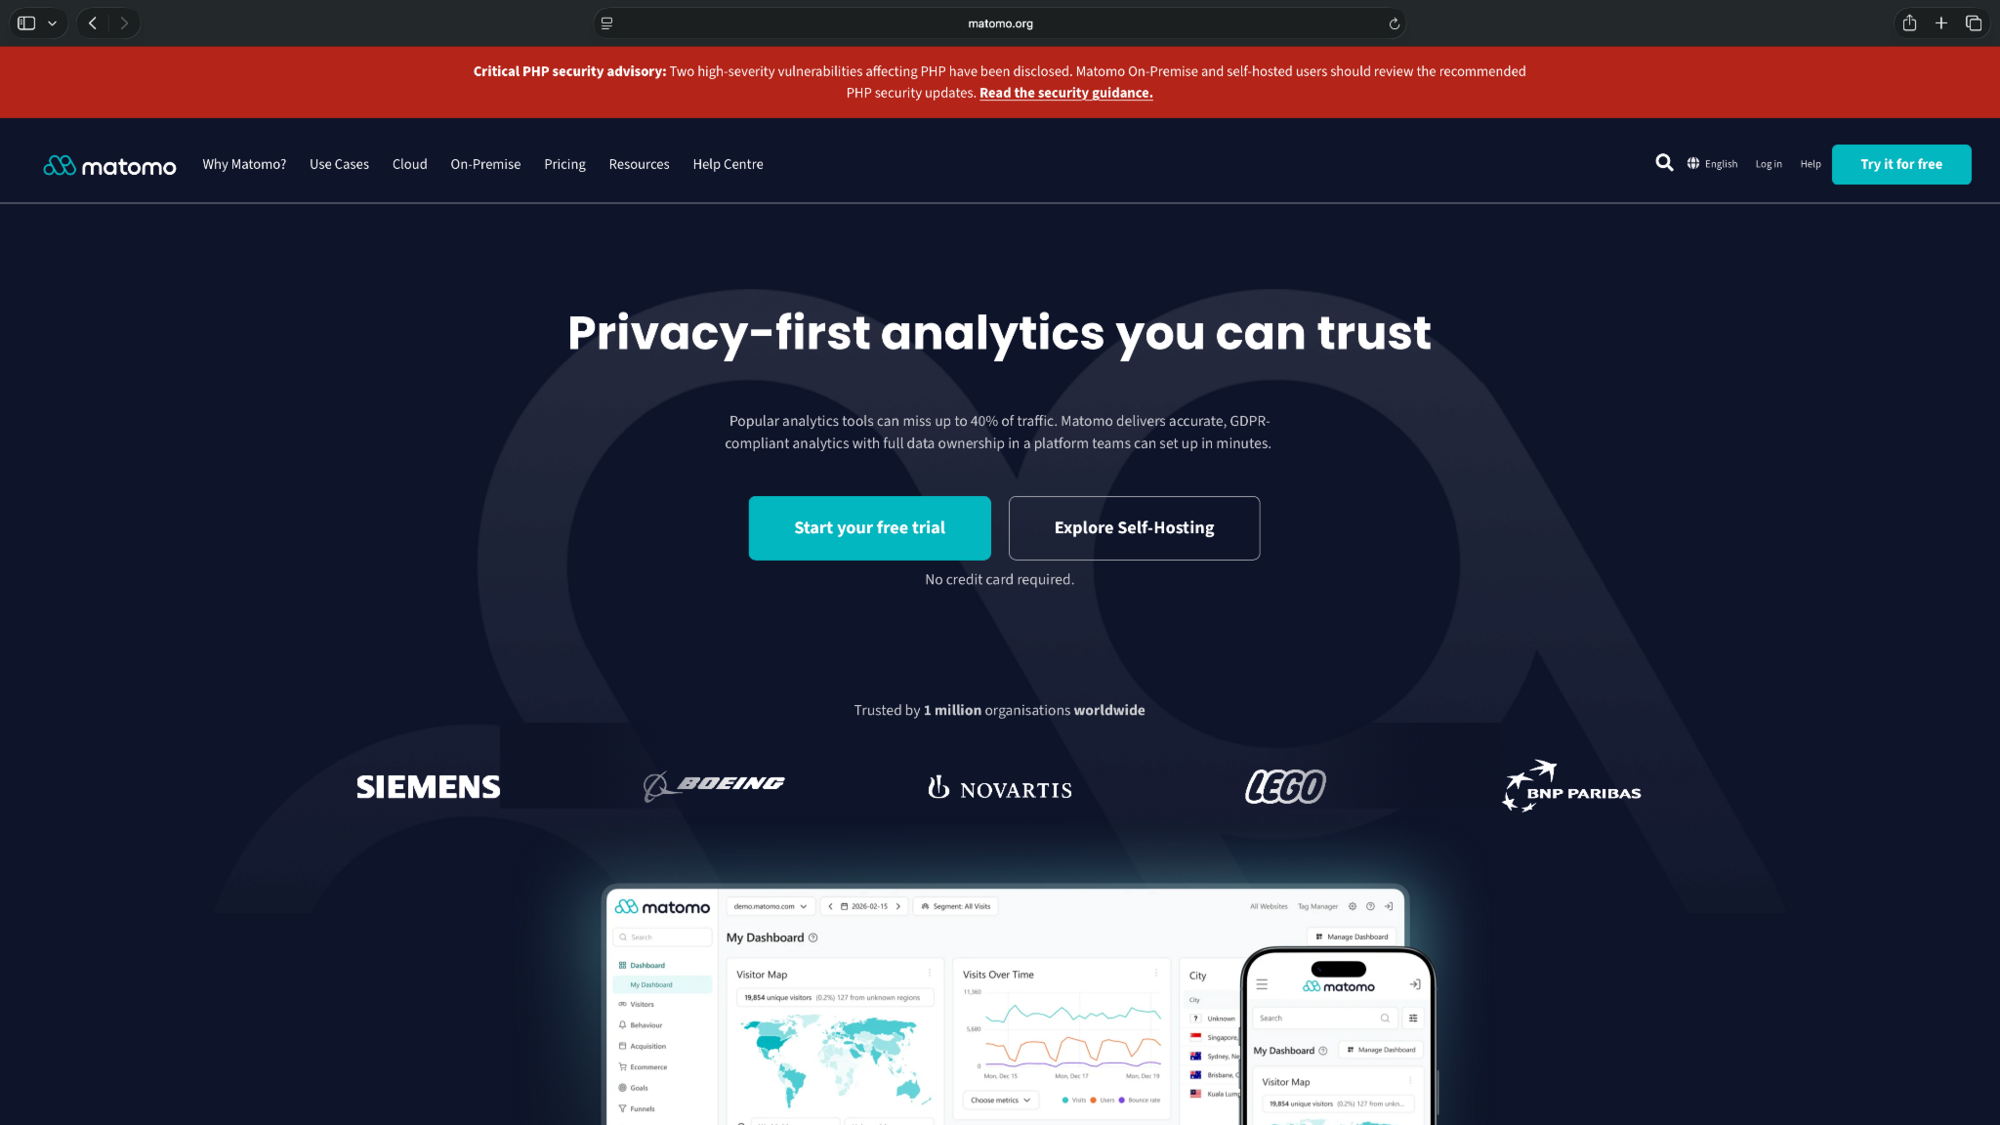
Matomo supports WordPress, Google Tag Manager, and API-based integrations.
Best for: Businesses that prioritize data ownership and privacy-focused website analytics.
Key features
- Acquisition cohorts: Group visitors by their first visit and compare their activity over time.
- Retention reports: Track returning visitors using cohort tables and time-based charts.
- Revenue cohorts: Analyze conversions, goal revenue, and e-commerce activity across visitor groups.
Pros
- Provides control over analytics data and hosting
- Offers cohort retention and conversion reports
- Supports privacy-focused analytics and flexible deployment
Cons
- Self-hosting requires technical setup and ongoing maintenance
- Cohort reporting isn't included in the free Community edition
Pricing
- Free to use self-hosted Community edition, with unlimited users and tracked hits
- Cloud Business plans start at $26/month, billed monthly, for 50,000 hits
- Self-hosted premium features have separate pricing
How to run a cohort analysis
You can run a cohort analysis in Excel or use an AI tool like Julius to generate the retention table from your data. Here's how to compare repeat purchases across monthly customer cohorts:
Step 1: Define your cohorts
Group customers by their first purchase month, such as January, February, or March 2026.
You'll need a dataset with customer IDs and purchase dates. Each customer should belong to one acquisition cohort.
Step 2: Choose your retention metric
Decide what counts as returning. For example, you could track customers who make another purchase in the following calendar month.
Calculate retention rate = returning customers ÷ original cohort size × 100.
Step 3: Build your retention table
In Excel, create columns for cohort month and months since first purchase. Use a PivotTable to count distinct customer IDs by cohort and month, then divide each count by the original cohort size.
Alternatively, upload your CSV or Excel file to Julius and use this prompt:
"Group customers by their first purchase month. Create a monthly cohort retention table showing cohort sizes and retention percentages for Months 1–6. Count each customer once per month and leave future periods blank."
Step 4: Interpret the results
If 100 customers made their first purchase in January and 42 returned in February, Month 1 retention is 42%.
Compare Month 1 across cohorts to spot improvements or declines. Keep incomplete periods blank so newer cohorts don't appear to have zero retention.
Which cohort analysis software should you choose?
The best cohort analysis software depends on your data sources, the metrics you want to track, and your budget. Here's how to narrow down your options:
- For analyzing exported data: Choose Julius if you have customer data in Excel or CSV files and want to create custom cohort reports using plain-English prompts.
- For product analytics: Amplitude and Mixpanel offer advanced behavioral cohorts for product managers, while Heap and PostHog suit teams that need automatic event capture or developer-focused analytics.
- For subscription revenue: ChartMogul tracks MRR retention, churn, and subscription cohorts. Userpilot is better suited to teams connecting onboarding with retention.
- For marketing and customer behavior: GA4 and Matomo offer different ways to analyze acquisition, purchases, and returning visitors.
Also, consider how you'll present your findings. A KPI dashboard can help your team track retention trends alongside other business metrics.
Analyze your cohort data with Julius
If you already have customer data in spreadsheets, Julius is our pick for creating custom cohort reports using plain English.
Upload your dataset, ask Julius to group customers by acquisition date or behavior, and it generates the finished cohort retention tables, charts, and a written readout — no SQL required. See how Julius handles AI data analysis.
For continuous product-event tracking, tools like Amplitude and Mixpanel may be a better fit.
You can try Julius for free.
Frequently asked questions
How do you create a cohort analysis in Excel?
You can create a cohort analysis in Excel by grouping customers by their first purchase or sign-up date. Use a PivotTable to count unique customers returning in each period, then divide those counts by the original cohort size. This gives you a retention table for comparing cohorts over time.
Do you need SQL to run a cohort analysis?
No, you don't need SQL to run a cohort analysis. Tools like Julius can analyze uploaded customer datasets using plain-English prompts. SQL is useful when you need to query large databases or create custom cohort definitions.
What are some free cohort analysis tools?
Google Analytics 4, Mixpanel, Amplitude, Julius, and PostHog offer free plans with cohort analysis capabilities, although feature and usage limits vary.
Which cohort analysis software is best for subscriptions?
ChartMogul is a strong choice for subscription businesses because it offers dedicated customer retention, churn, and net MRR retention cohorts. Julius can also analyze subscription data exported from billing platforms, provided the dataset contains the necessary customer, date, and revenue fields.
Which cohort analysis tools support advanced segmentation?
Amplitude, Mixpanel, and PostHog support advanced cohort segmentation based on user properties, events, and behavioral patterns. Julius lets you define custom cohorts using the fields available in your uploaded dataset.
Which cohort analysis software provides the most accurate results?
Cohort analysis accuracy depends on data quality, event tracking, and how you define retention. Platforms like Amplitude and Mixpanel offer detailed behavioral tracking, while Julius lets you analyze prepared datasets. Check customer IDs, date ranges, and calculation methods before relying on any cohort report.