

Creating graphs from data is easy until you need a chart for a presentation, a detailed statistical plot, or an interactive dashboard. Each requires different features, and the software you choose affects how much work goes into the final chart.
We shortlisted 10 graph-making software tools in 2026 and compared their chart types, usability, pricing, and export options. Whether you want AI to create charts from spreadsheets or prefer to customize every detail, these tools will fit your needs.
10 best graph-making software tools: TL;DR
- Julius AI: Best for creating charts from spreadsheets using AI
- Canva: Best for presentation-ready charts and graphics
- Visme: Best for branded charts and reports
- Datawrapper: Best for interactive charts in articles
- RAWGraphs: Best for specialized data visualizations
- Google Sheets: Best for free spreadsheet charts
- Microsoft Excel: Best for statistical charts and business reports
- Tableau Public: Best for free interactive dashboards
- Infogram: Best for interactive infographics
- Adobe Express: Best for simple charts and social graphics
How we evaluated these graph-making tools
We reviewed official product documentation and pricing pages to verify features, plan limits, and export capabilities. We then evaluated each graph-making tool using the criteria most likely to affect your workflow, budget, and final output.
Here are the factors that mattered the most:
- Chart variety: The range of available charts, including standard options such as bar and line charts, as well as specialized plots, maps, and dashboards.
- Ease of use: How quickly a beginner can import data, create a graph, and adjust labels, colors, axes, and other settings.
- Pricing and free plans: The cost of paid plans, what is included in free versions, and restrictions on projects, exports, storage, or collaboration.
- Export and sharing options: Whether you can download charts as PNG, JPG, PDF, SVG, or other formats, as well as publish or embed interactive visualizations.
- Best use cases: Whether each tool is better suited to presentations, branded reports, statistical analysis, online articles, social graphics, or interactive dashboards.
- Platform support: Whether the tool works in a browser, on desktop, or on mobile, and whether it supports collaborative workflows.
- Customization: The level of control available for chart design, branding, annotations, interactivity, and data presentation.
Top 10 graph-making software: Quick comparison
| Tool | Free plan | Platform | Chart types | Best for |
| Julius AI | Limited | Web | Bar, scatter, heatmap | AI chart creation |
| Canva | Yes | Web, mobile | Bar, pie, line | Presentations |
| Visme | Limited | Web | Bar, donut, scatter | Branded reports |
| Datawrapper | Yes | Web | Line, scatter, maps | Online articles |
| RAWGraphs | Free | Web, local | Alluvial, treemap | Specialized charts |
| Google Sheets | Yes | Web, mobile | Bar, pie, histogram | Spreadsheet charts |
| Microsoft Excel | Web version | Web, desktop | Scatter, histogram | Statistical charts |
| Tableau Public | Free | Web, desktop | Maps, dashboards | Interactive dashboards |
| Infogram | Limited | Web | Bar, area, maps | Infographics |
| Adobe Express | Yes | Web, mobile | Bar, line, pie | Social graphics |
The 10 best graph-making software tools in 2026
1. Julius AI: Best for creating graphs from spreadsheets using AI
Julius AI lets you create charts by asking questions about your data in plain English. Upload an Excel or CSV file, ask Julius to plot monthly sales, and refine the chart through follow-up prompts. It can also clean and analyze data before creating visualizations.

You can turn your findings into slides using the AI Presentation Maker.
- Chart types: Bar, line, pie, scatter, histogram, heatmap
- Platform: Web
- Exports: Chart downloads on paid plans; data as CSV or Excel
Pros
- Creates charts through plain-English prompts
- Analyzes and cleans data before visualization
- Supports follow-up prompts to refine charts
Cons
- Free plan has limited daily credits
- Fewer manual design controls than dedicated design tools
Pricing
- Free to use with limited daily credits
- Paid plans start from $20/month, billed monthly
2. Canva: Best for presentation-ready charts
Canva helps you turn spreadsheet data into visually appealing charts for presentations, reports, and marketing materials. You can choose a template, import data, and customize colors, fonts, and labels.
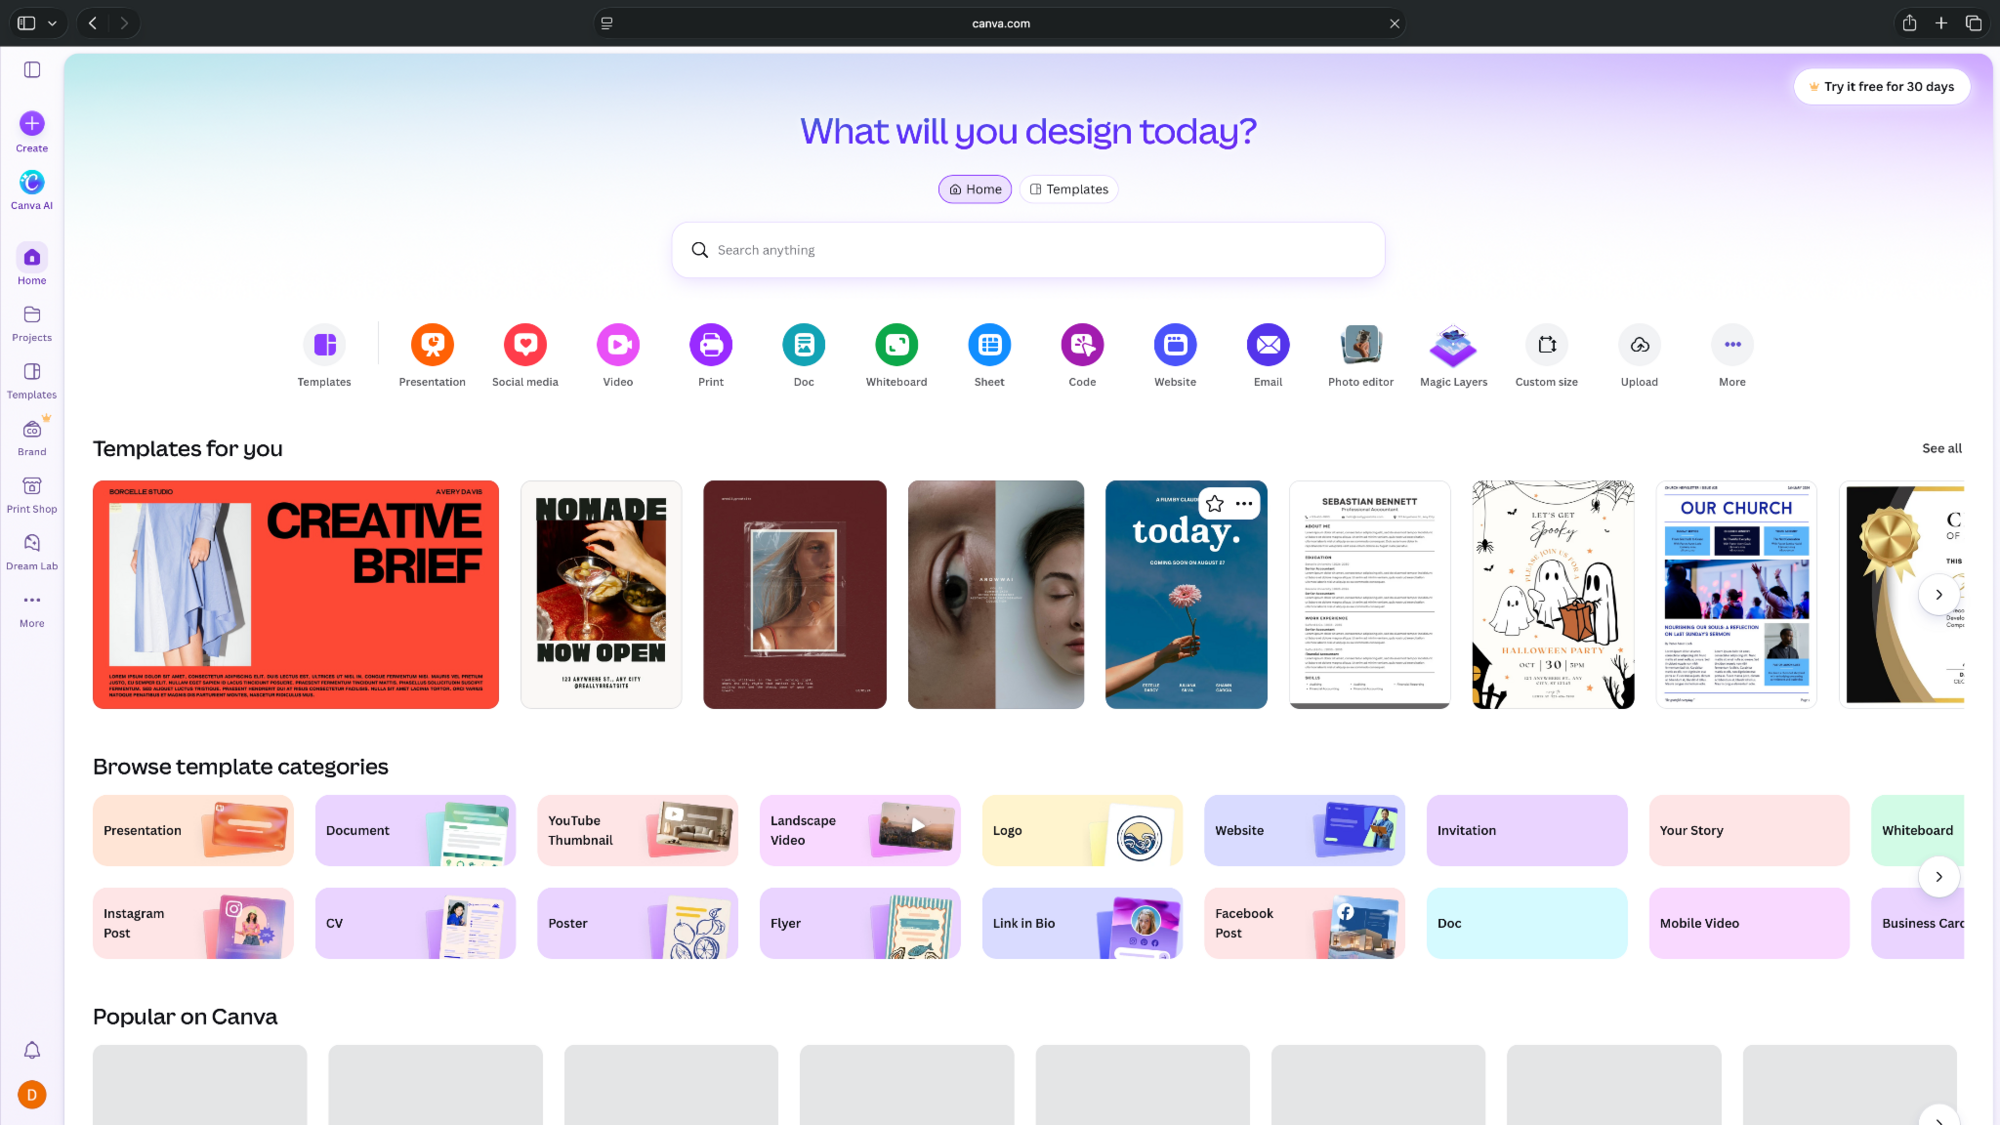
Canva also supports AI-generated charts from prompts and uploaded CSV files.
- Chart types: Bar, line, pie, scatter, histogram, bubble
- Platform: Web and mobile
- Exports: PNG, JPG, PDF; SVG on paid plans
Pros
- Extensive chart templates and design assets
- Easy customization of colors, labels, and fonts
- Charts can be added directly to presentations
Cons
- Limited statistical analysis capabilities
- Premium assets and advanced features require paid plans
Pricing
- Free to use with basic chart tools and templates
- Paid plans start from $18/month, billed monthly
3. Visme: Best for branded charts and reports
Visme combines chart creation with presentation and report design. You can create charts from data, customize their appearance, and add them to branded reports or interactive presentations.

It's particularly useful for marketing teams that need consistent designs across multiple visuals.
- Chart types: Bar, line, pie, donut, scatter, area
- Platform: Web
- Exports: JPG, PNG, PDF on Starter; PPTX and HTML5 on Pro
Pros
- Customizable templates for reports and presentations
- Supports interactive charts and animations
- Offers tools for creating branded content
Cons
- Free plan restricts downloads
- Advanced branding and export features require higher plans
Pricing
- Free plan with limited templates, design assets, and no project downloads
- Paid plans start from $29/user/month, billed monthly
4. Datawrapper: Best for interactive charts and articles
Datawrapper lets you create charts, maps, and tables through a no-code editor. It's especially useful for journalists, researchers, and businesses publishing data-driven content online.
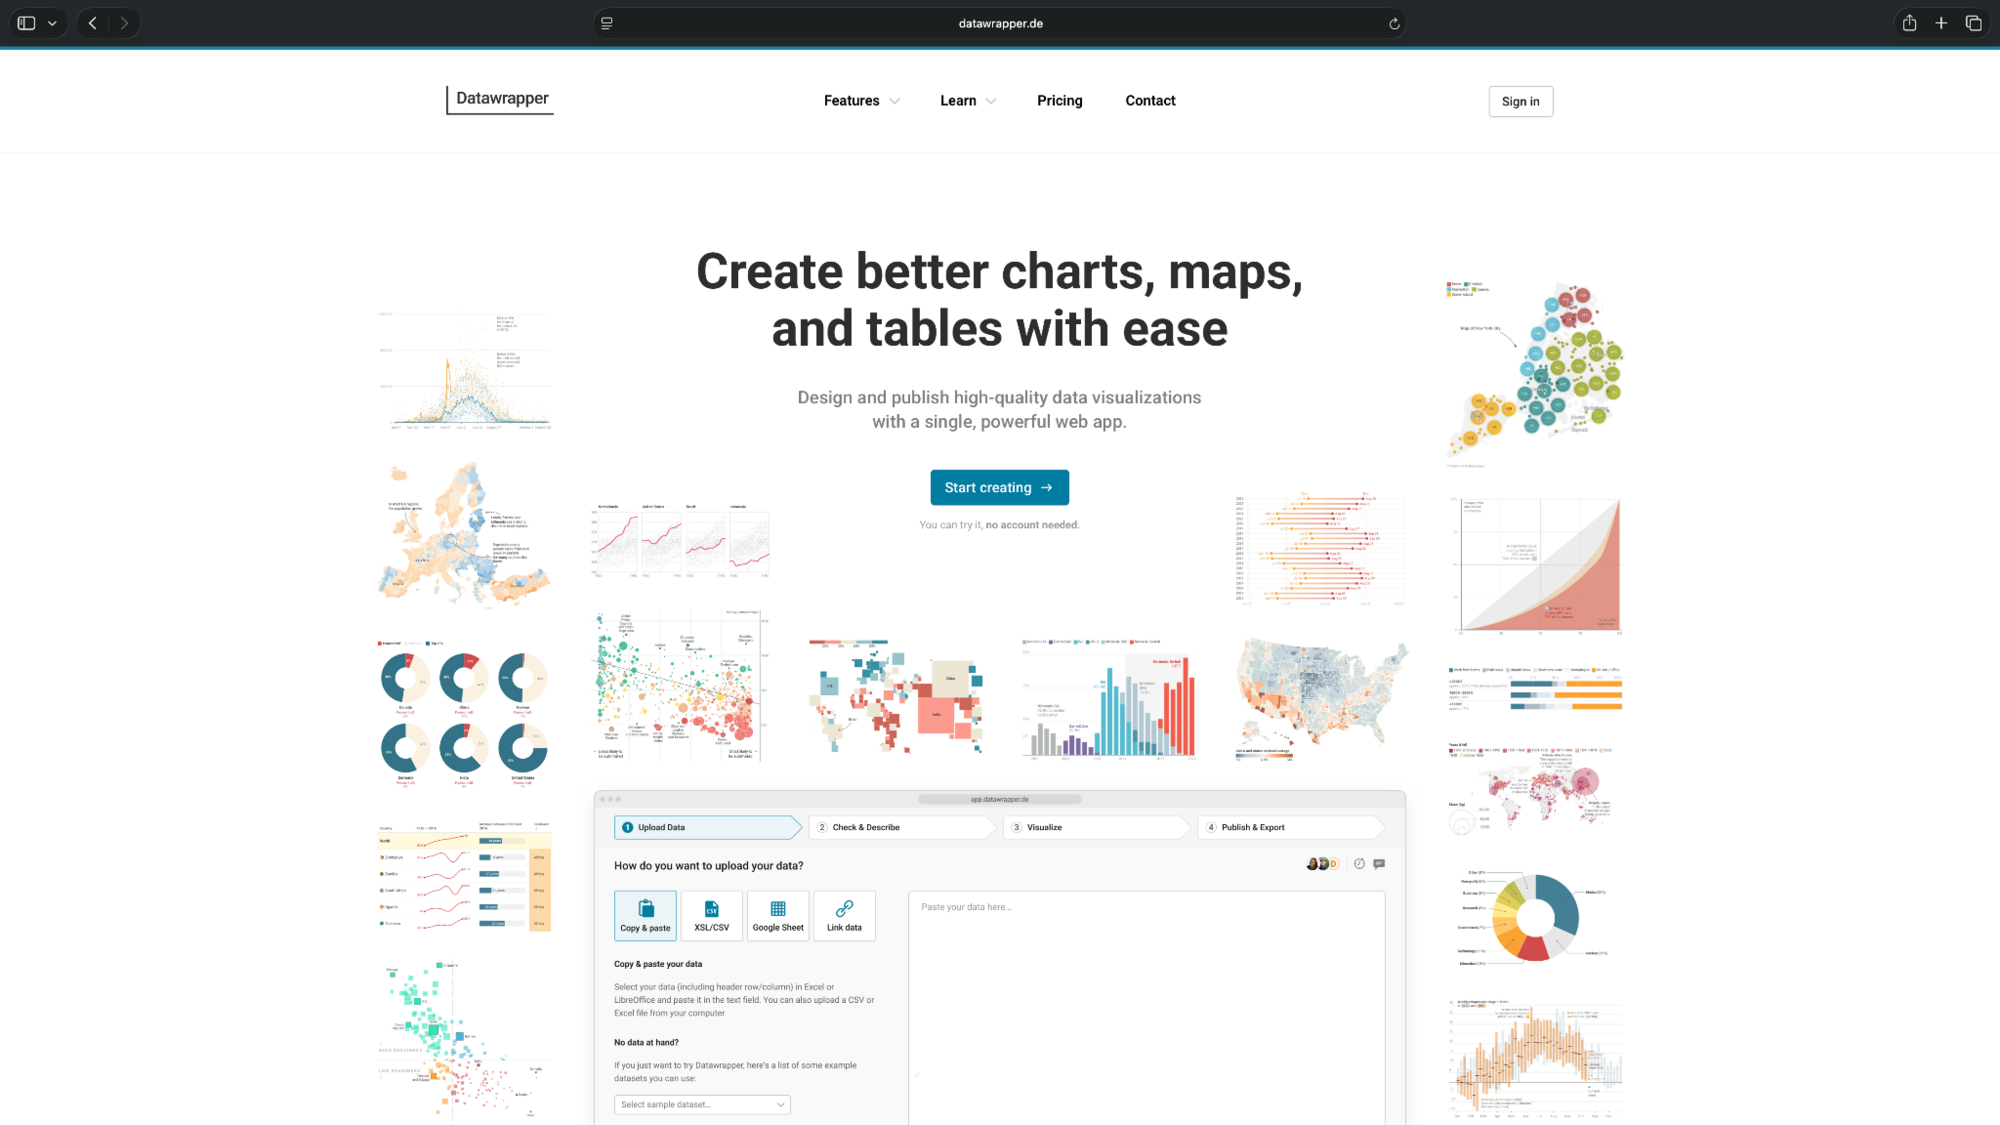
You can upload data, customize labels and annotations, and embed interactive charts directly into articles.
- Chart types: Bar, line, scatter, maps, tables
- Platform: Web
- Exports: PNG free; PDF and SVG on Pro
Pros
- No coding skills required
- Creates interactive charts for websites and articles
- Unlimited chart publishing and PNG exports on the free plan
Cons
- Free charts include Datawrapper attribution
- Some chart types and export formats require paid plans
Pricing
- Free plan with unlimited charts, maps, and tables with PNG exports
- Paid plans start from $25/user/month, billed monthly
5. RAWGraphs: Best for specialized data visualizations
RAWGraphs is a free, open-source graph-making tool designed for visualizing complex datasets. It supports uncommon chart types that you won't find in most spreadsheet applications.
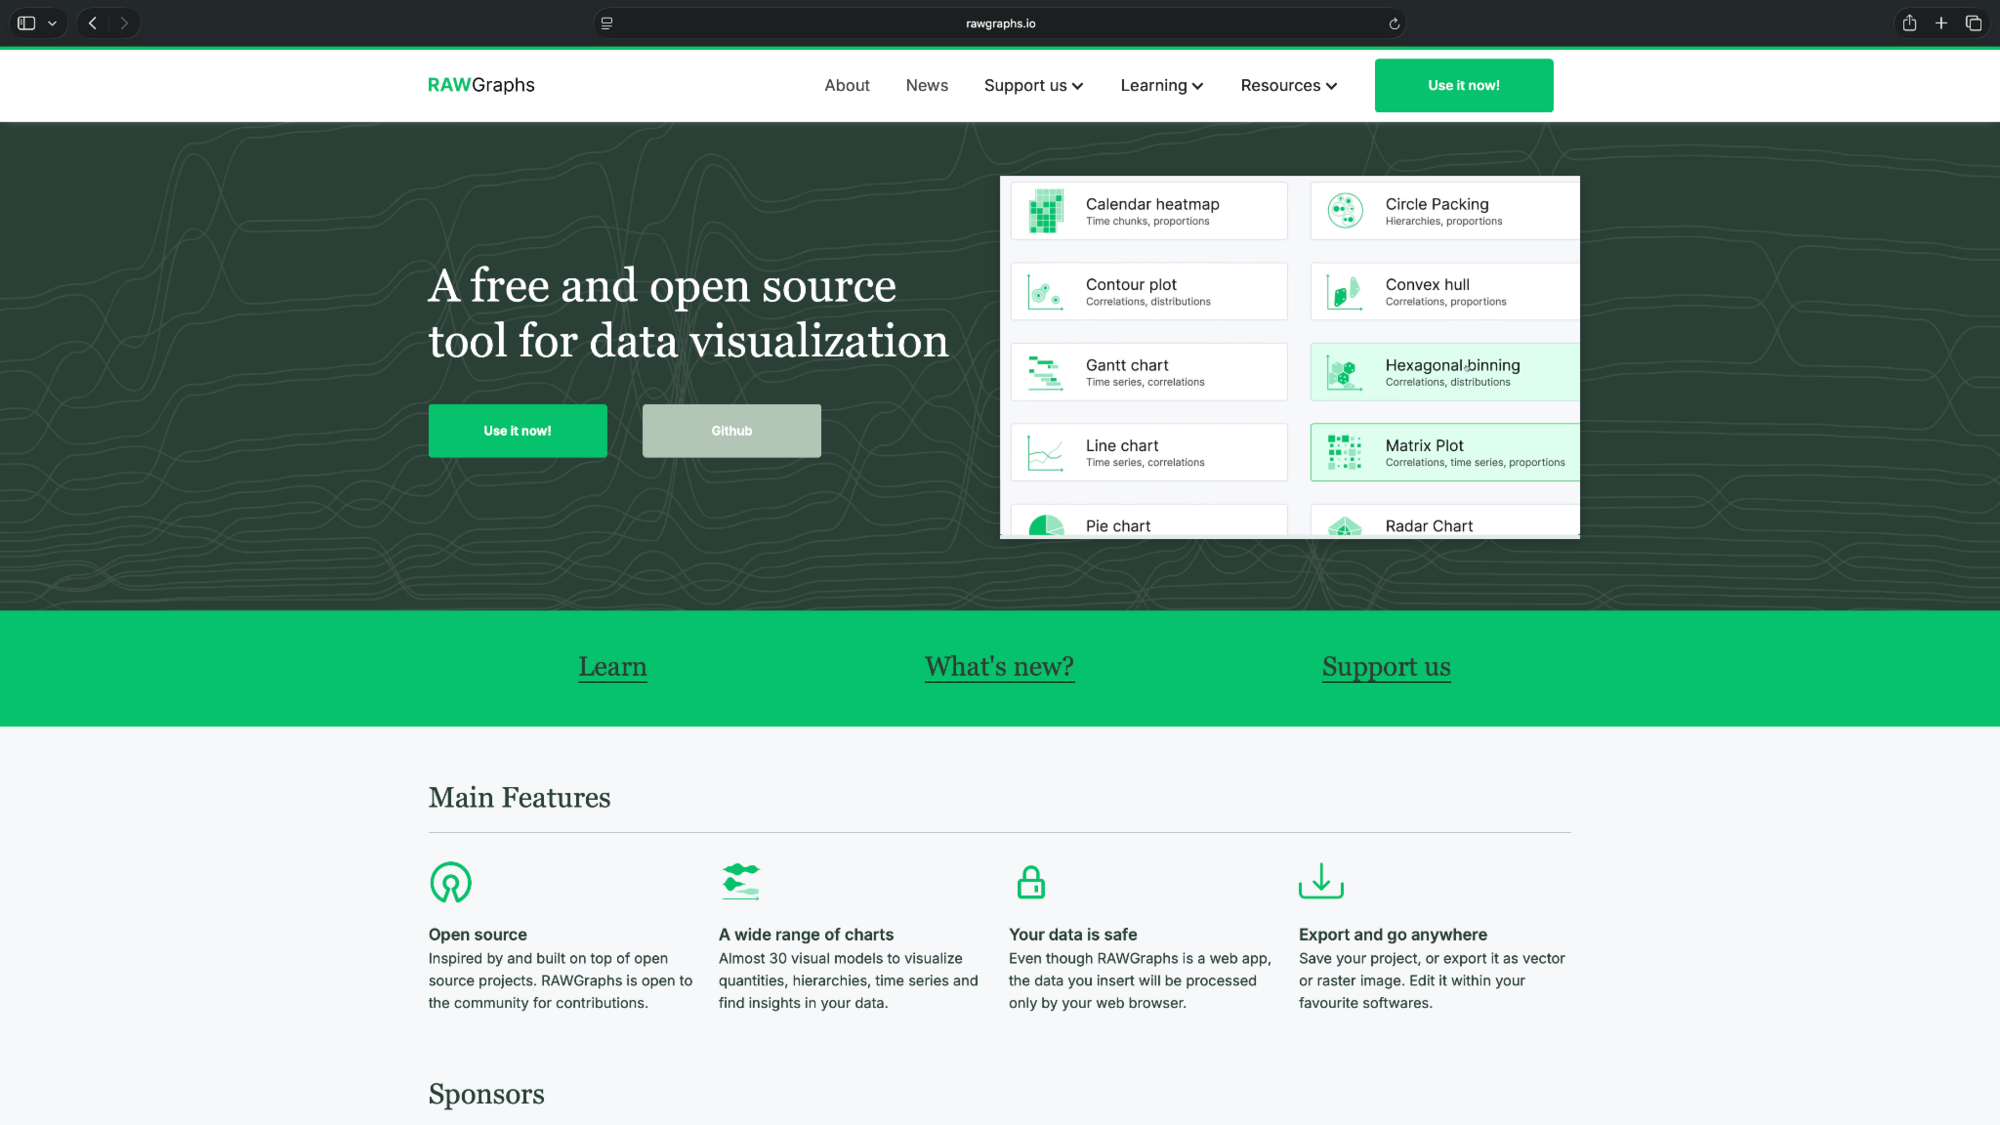
You can import tabular data, map columns to visual elements, and customize the output for further editing.
- Chart types: Alluvial diagrams, treemaps, circle packing, violin plots
- Platform: Web; can also run locally
- Exports: SVG and PNG
Pros
- Supports specialized chart types
- Exports editable SVG graphics
- Free and open-source with no subscription required
Cons
- Has a learning curve for beginners
- Limited interactive dashboard capabilities
Pricing
- Open-source and free to use for all chart types and export options
6. Google Sheets: Best for free spreadsheet charts
Google Sheets lets you create charts directly from spreadsheet data. Select your cells, choose a chart type, and customize the axes, labels, and colors.
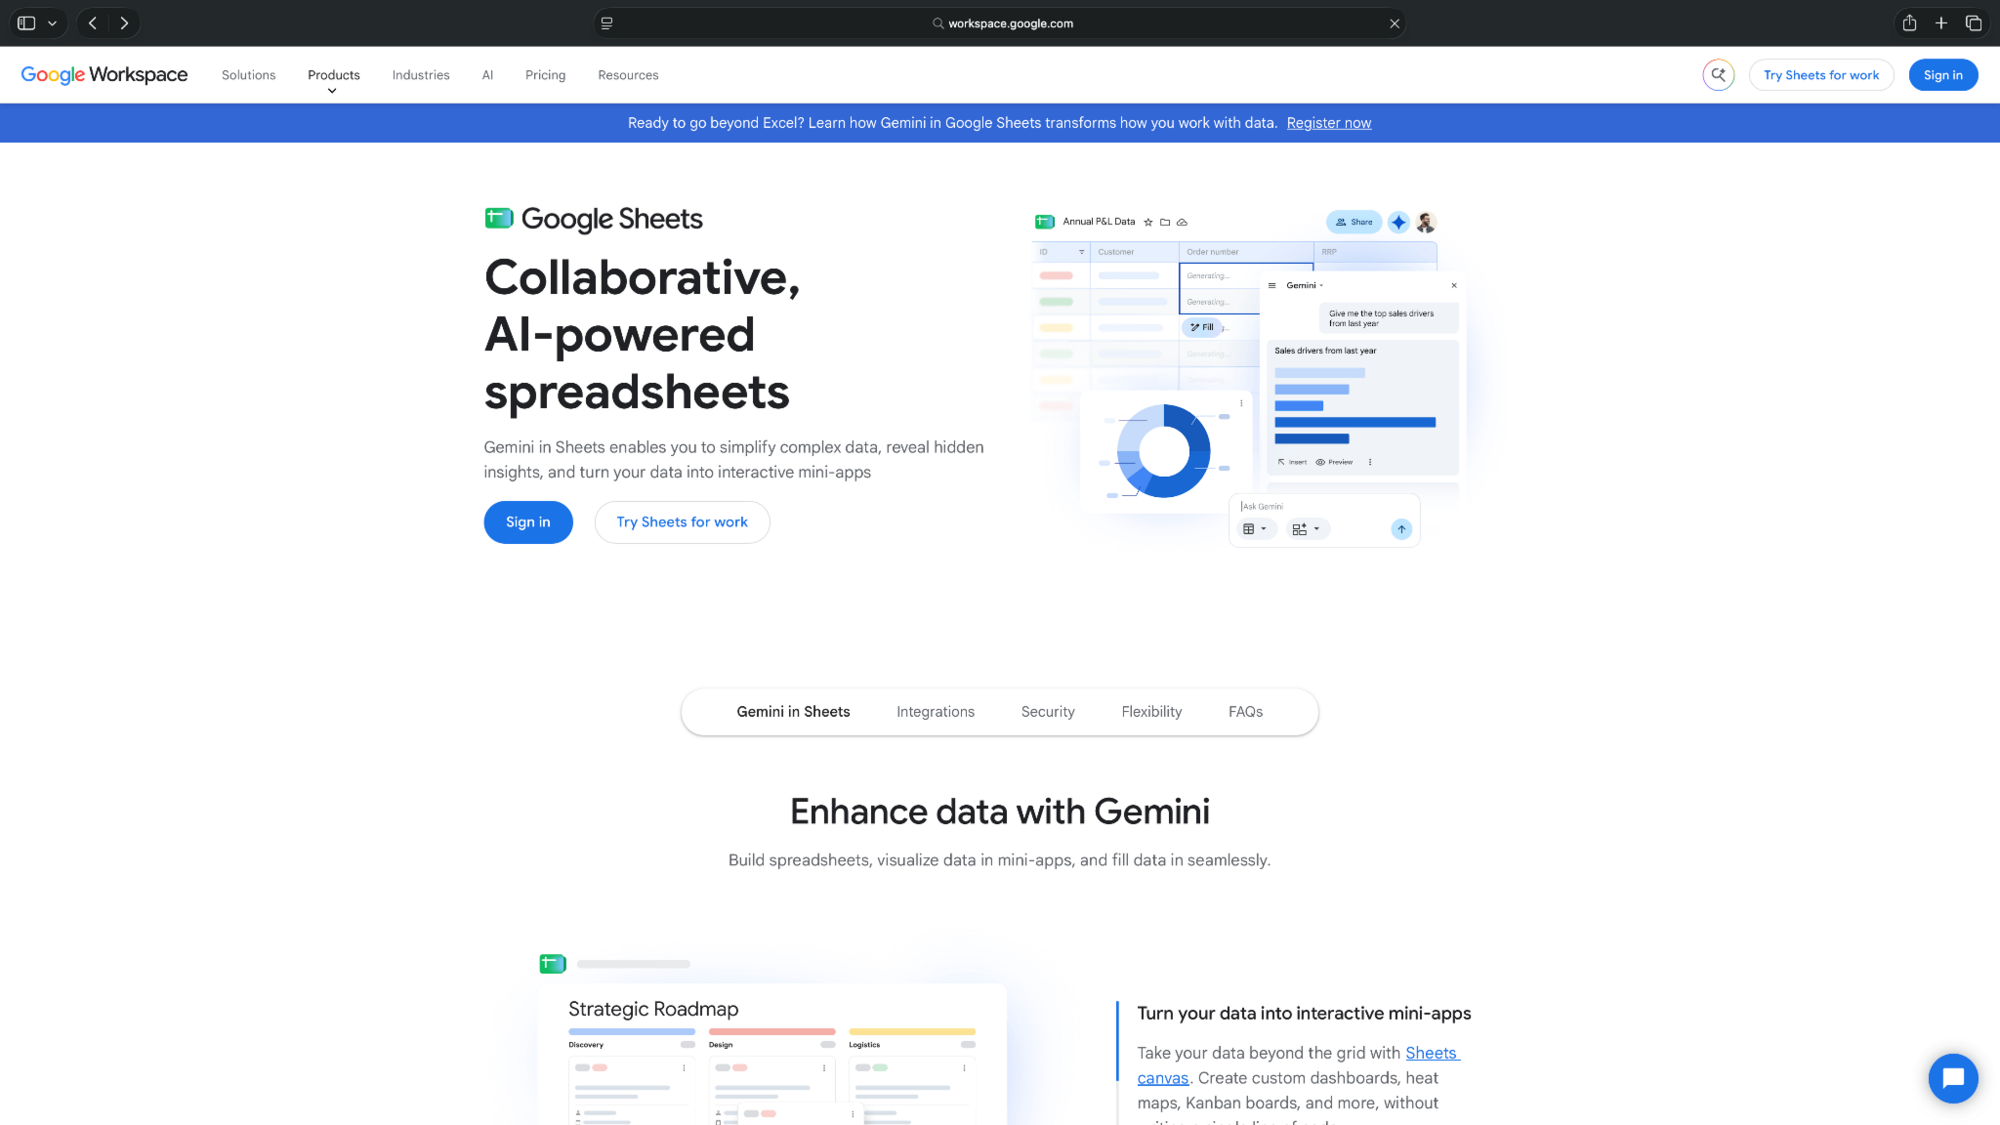
It's a good option for teams already using Google Workspace, especially when several people need to work on the same dataset.
- Chart types: Bar, line, pie, scatter, histogram
- Platform: Web and mobile
- Exports: PNG, SVG, PDF
Pros
- Free chart creation and exports
- Supports collaborative spreadsheet editing
- Integrates with other Google Workspace apps
Cons
- Limited chart design customization
- Advanced AI features require an eligible paid plan
Pricing
- Free to use for chart creation and exports with a Google account
- Google Workspace Business Starter begins at $8.40/user/month, billed monthly
7. Microsoft Excel: Best for statistical charts and reports
Microsoft Excel offers a wide range of charts for analyzing spreadsheet data. Alongside standard bar and line charts, it supports histograms, scatter plots, and box-and-whisker charts.
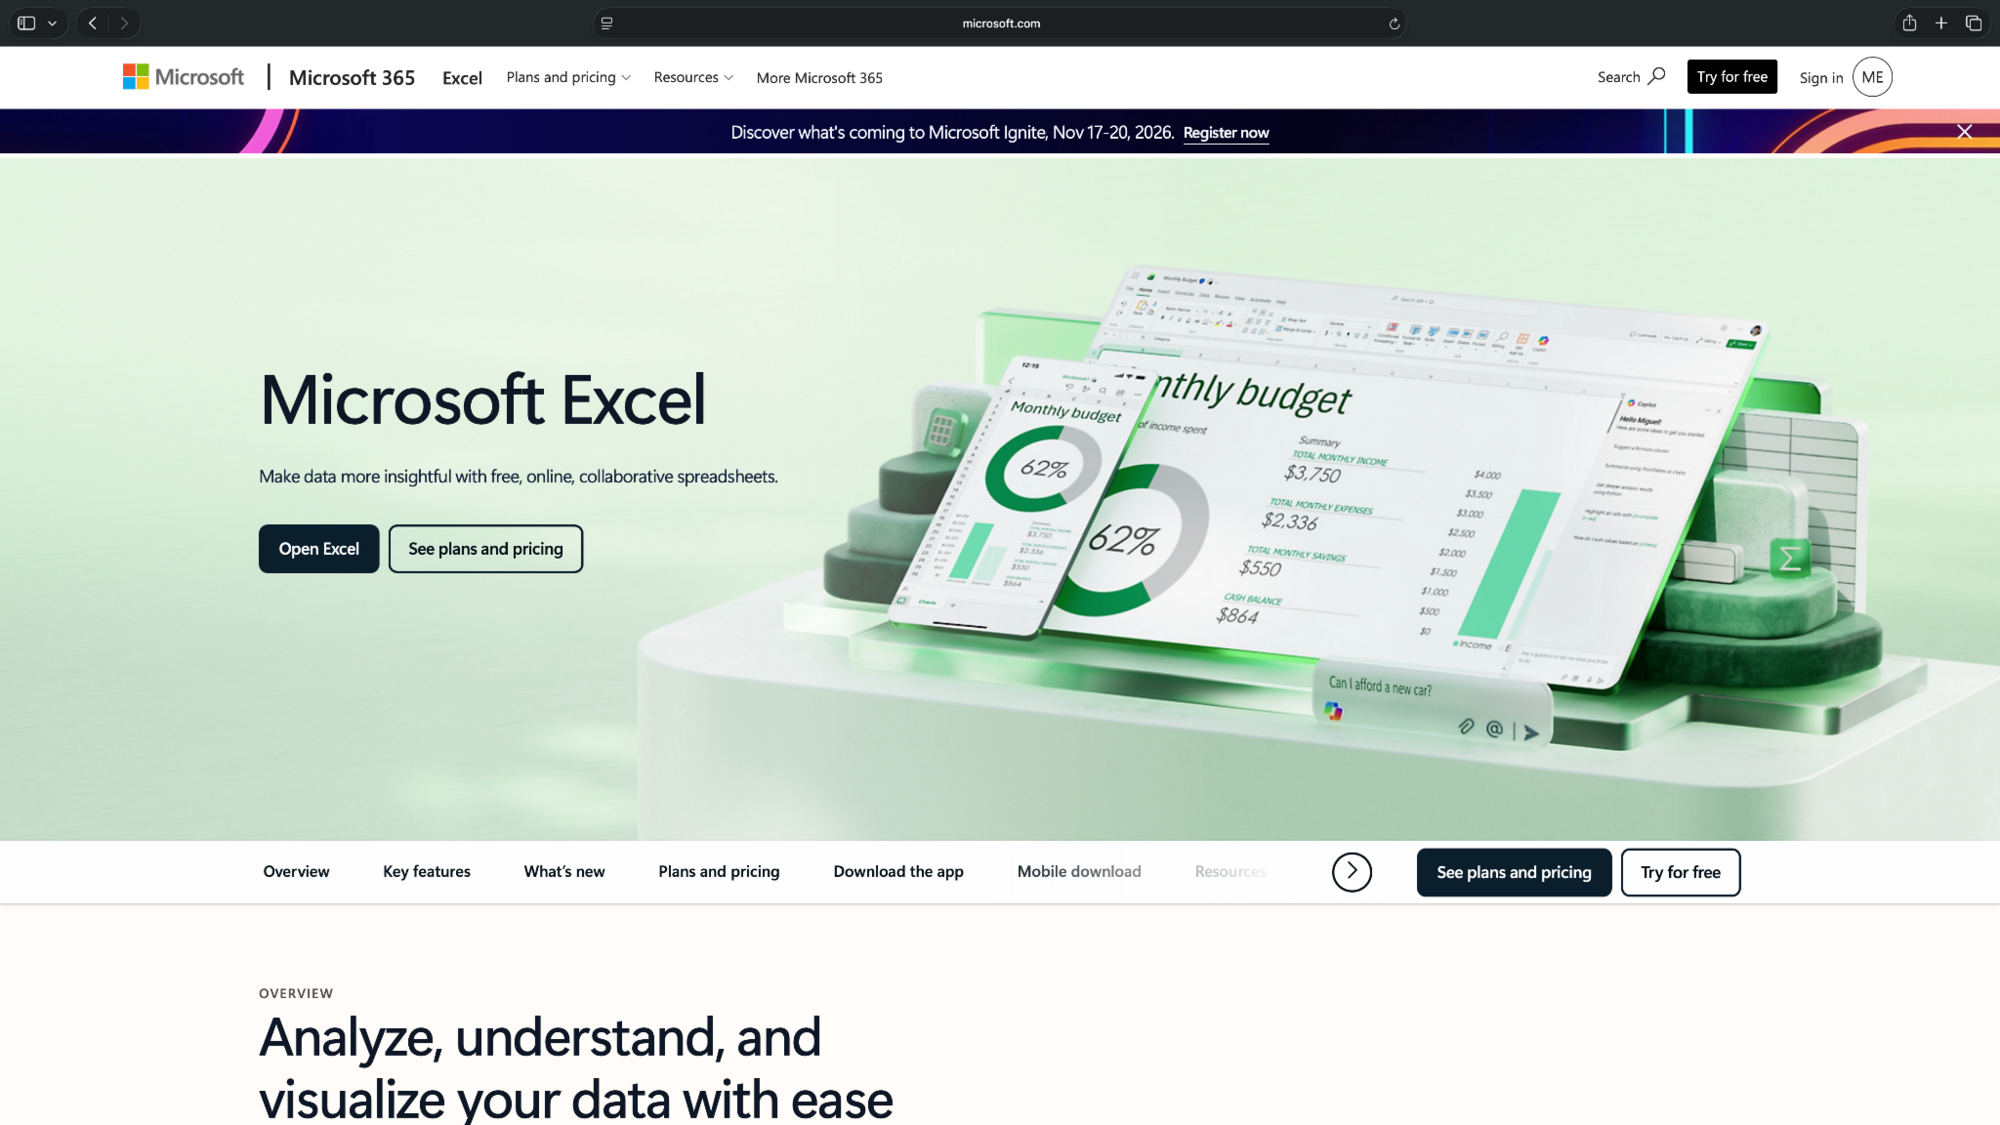
- Chart types: Bar, line, scatter, histogram, box-and-whisker
- Platform: Web, desktop, mobile
- Exports: PNG, JPG, SVG on supported desktop versions
Pros
- Supports statistical and business chart types
- Built-in formulas help analyze data before plotting
- Works with PowerPoint for reports and presentations
Cons
- Some advanced features require desktop Excel
- Chart customization can take time for beginners
Pricing
- Free to use for the web with support for basic chart creation
- Paid Microsoft 365 plans start from $9.99/month, billed monthly
8. Tableau Public: Best for free interactive dashboards
Tableau Public lets you create interactive graphs and dashboards using publicly shareable data. It supports visual exploration through filters, charts, and connected views.
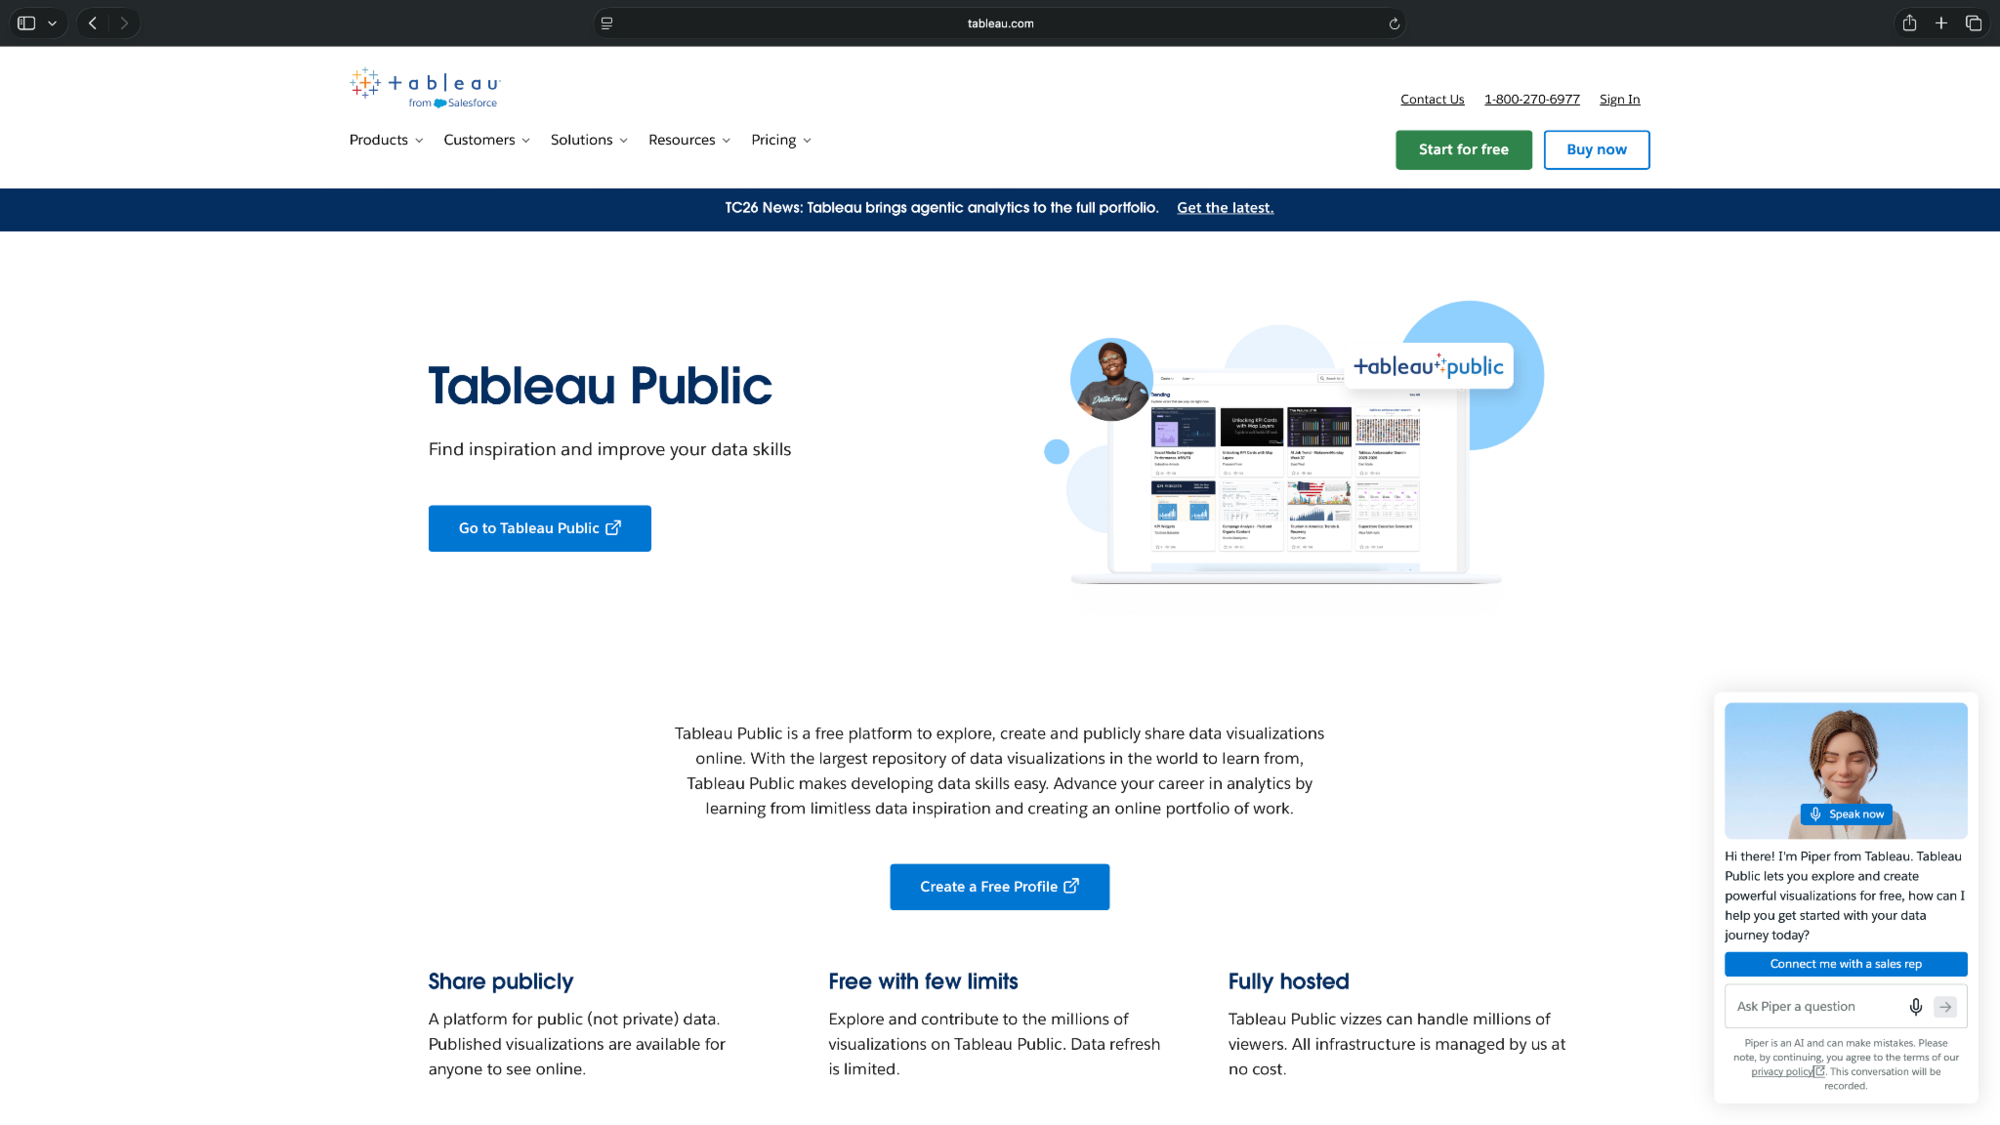
You can build visualizations in your browser or use Tableau's free desktop application.
- Chart types: Bar, line, scatter, maps, dashboards
- Platform: Web and desktop
- Exports: Public links, embeds, and image downloads
Pros
- Creates interactive dashboards and charts
- Supports multiple visualization types and filters
- Free public hosting and sharing
Cons
- Published visualizations and underlying data are publicly accessible
- Limited data refresh options
Pricing
- Free to use, with public sharing and limited data refresh
9. Infogram: Best for interactive infographics
Infogram helps you create interactive charts, infographics, and presentations. It offers more than 35 chart types on its free plan, along with templates for presenting data online.
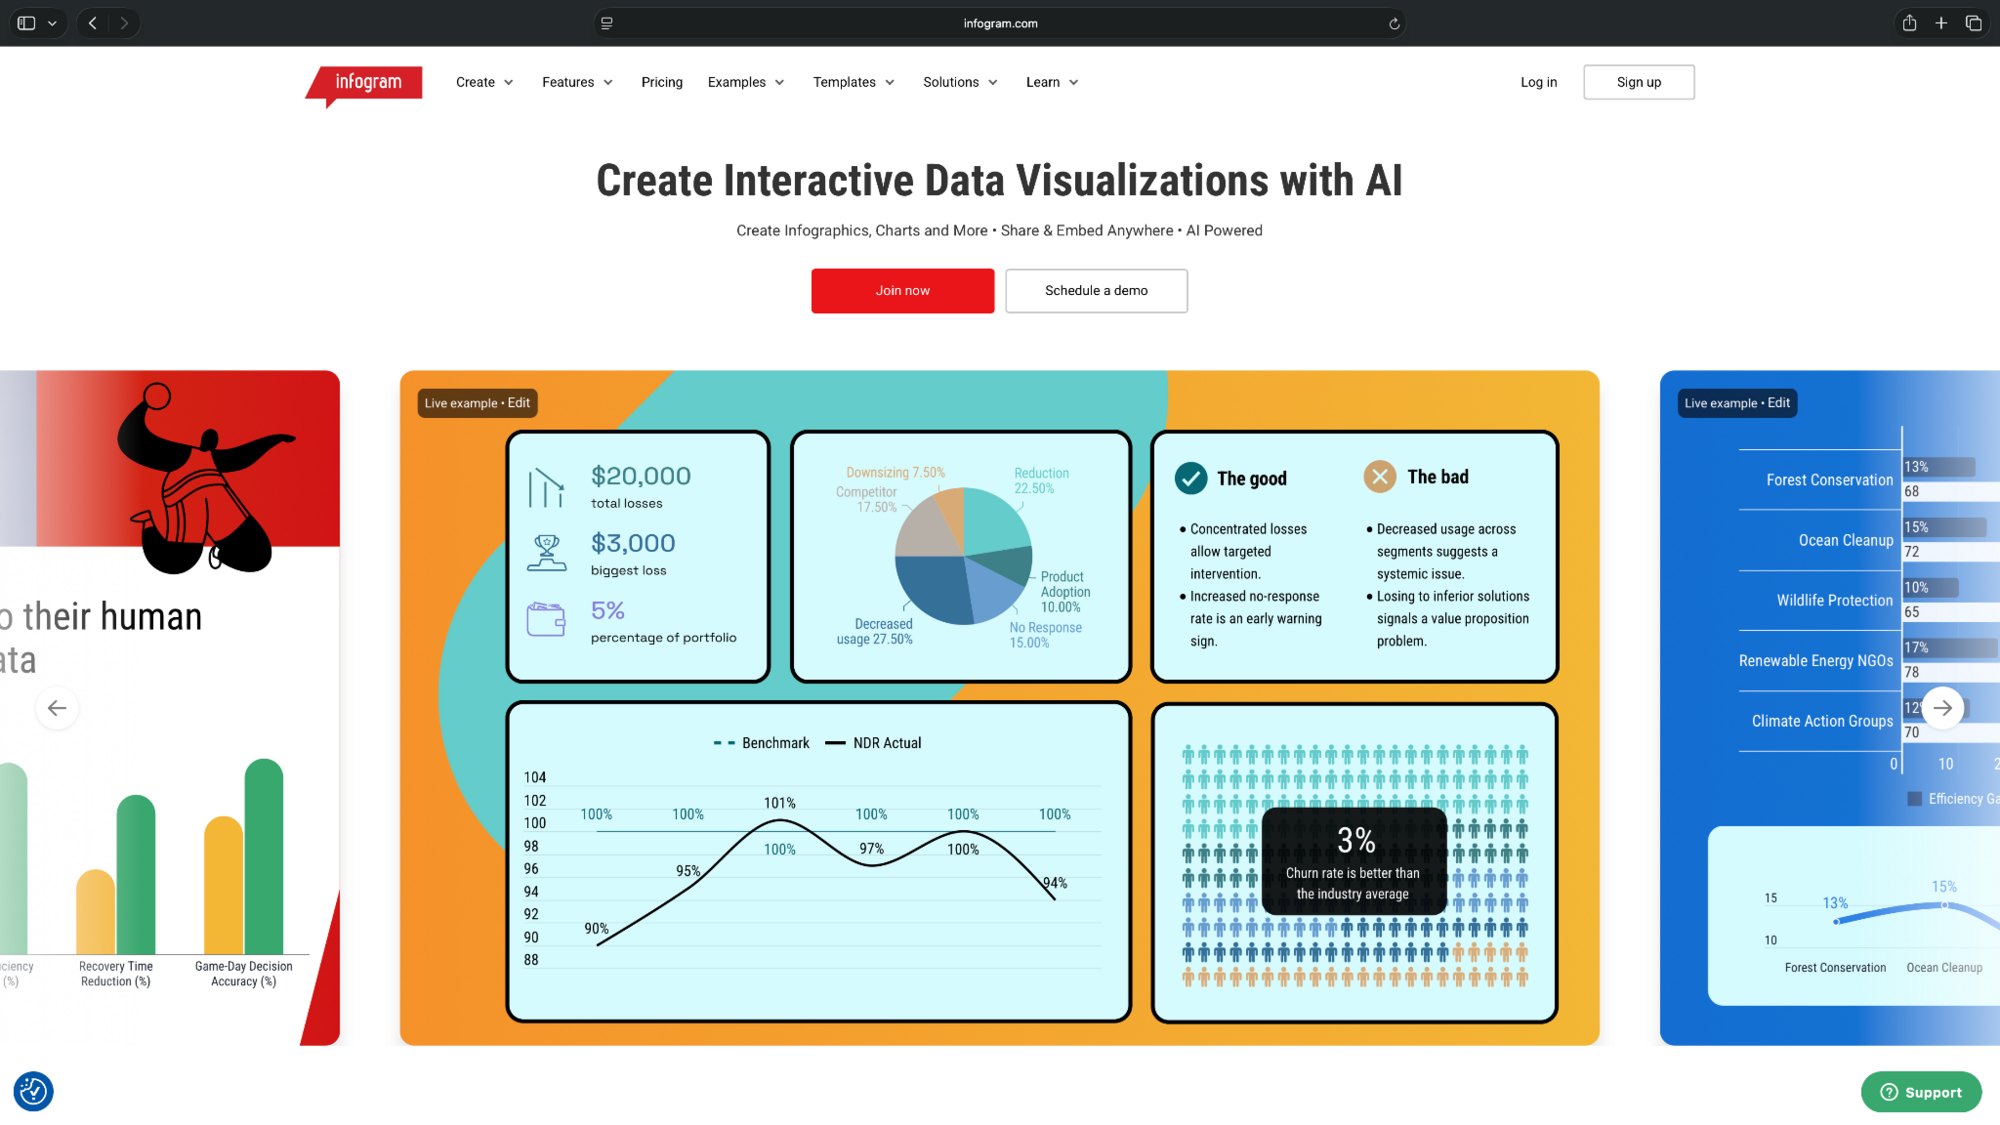
You can also add animations and publish interactive visualizations to the web.
- Chart types: Bar, line, pie, area, maps
- Platform: Web
- Exports: PNG, JPG, PDF, GIF, and MP4 on paid plans
Pros
- Supports 35+ interactive chart types
- Offers customizable infographic templates
- Allows interactive charts to be published online
Cons
- Project downloads require a paid plan
- Free projects have public-sharing restrictions
Pricing
- Free to use with up to 10 projects and 5 pages per project
- Paid plans start from $25/month, billed monthly
10. Adobe Express: Best for simple charts and social graphics
Adobe Express makes it easy to create charts for presentations, social posts, and marketing materials. Choose a chart template, enter your data, and customize its appearance using fonts, colors, and design elements.

It's most suitable for straightforward visuals where design is the priority.
- Chart types: Bar, line, pie
- Platform: Web and mobile
- Exports: PNG, JPG, PDF
Pros
- Beginner-friendly chart templates
- Easy customization with design elements
- Works on mobile devices for quick edits
Cons
- Limited statistical charting features
- Some design assets and tools require Premium
Pricing
- Free to use with basic design tools, limited premium assets, and 5GB of storage
- Adobe Express Premium plans start from $9.99/month, billed monthly
How to choose graph-making software for charts and graphs
The right graph-making software depends on your data, chart requirements, and where you'll share the finished visualization. Consider these scenarios to decide:
For quick charts in slides and reports
Canva, Visme, and Adobe Express offer templates and design controls for presentations. Julius is a good fit when you need to analyze spreadsheet data before creating different types of charts or graphs.
For scientific plotting and statistical analysis
Excel supports common statistical plots, while RAWGraphs offers specialized visualizations. Julius can also analyze uploaded datasets and generate plots using natural-language instructions.
For interactive dashboards
Tableau Public works for dashboards using publicly shareable data. Datawrapper and Infogram suit interactive charts embedded in websites and reports.
Final verdict
Julius is a good choice for creating charts from spreadsheets using AI, especially when you need to analyze the data first.
For presentation design, Canva and Visme offer more visual control. Google Sheets works well for everyday charts, while Tableau Public suits interactive dashboards.
Try Julius for free.
Frequently asked questions
Can ChatGPT make graphs?
Yes, ChatGPT can create graphs from uploaded CSV and Excel files. It supports charts such as bar, line, pie, and scatter plots, with interactive versions available for some chart types.
What is the best app for creating graphs?
Julius, Canva, and Google Sheets are good apps for creating graphs, depending on your data and workflow.
Canva works well for presentation graphics, while Google Sheets is suitable for simple charts that teams can edit collaboratively. Julius is a good option for AI-powered charts from spreadsheets.
What is a good free plotting software?
Google Sheets, RAWGraphs, and Tableau Public are good free plotting software.
RAWGraphs is free and supports specialized plots. Google Sheets works for common charts, while Tableau Public lets you visualize data and create interactive dashboards that can be shared publicly.
Can Canva make graphs?
Yes, Canva can create bar, line, pie, scatter, and other charts. You can enter data, customize the chart's appearance, and add it directly to presentations or marketing materials.