

A case study presentation walks your audience from a problem to a measurable result. It moves through five beats: context, problem, approach, results, and takeaways.
I've built these for client pitches and sat through plenty from the audience seat. The decks that land put everything into the results slide. Get that part right, and the rest of the deck holds together.
What is a case study presentation?
A case study presentation is a slide-based story that proves a result happened. Real numbers back the claim, walking the audience through a specific problem, what got done about it, and what changed.
According to the Content Marketing Institute, around 75% of B2B marketers use case studies and customer stories in their content. Build one, and you're working in a format many business audiences already expect and recognize.
The 5 parts of a case study presentation
The five components of a case study are context, problem, approach, results, and takeaways. Each one builds on the last:
- Context and background: Set the scene in a slide or two, naming the subject and what their situation looked like before. Keep this tight, since an opening slide only needs enough backstory to make the rest of the deck make sense.
- The problem: Name the specific challenge, and attach a number to it when possible. "Reporting took 3 days every week" carries more weight than "reporting was slow," and a quantified problem makes the results slide hit harder later.
- The approach: Explain what got done and why it beat the alternatives. One or two slides covers it. Skip the play-by-play and give the room the logic behind the decision.
- The results, with real numbers: Show the outcome in hard numbers, a before-and-after, a chart, a percentage moved. This is the slide the deck exists for, and vague wins like "things improved" undercut everything said before it.
- Takeaways and next steps: Close with the lesson learned and what happens next, like a recommendation or an invitation to ask questions. This is the handoff to Q&A, so it should end on the one point worth repeating.
Before you begin, know what your scenario asks for
Interviews, client pitches, and academic projects each call for different emphasis. Here's how each one shifts your approach:
- Interview: Lead with your role and decisions, since the interviewer is judging how you think. Keep it to 5 or 6 slides.
- Client pitch: Tie the case to the prospect's situation and show ROI in numbers they care about. It's the same discipline that goes into a proposal presentation.
- Academic project: Show your data sources and walk through your analysis, applying the same rigor you'd bring to structuring a research presentation.
How to build your case study presentation: step-by-step (with example)
Once you know the 5 parts, building the deck comes down to sequence. Here's the process I use, walked through with one example of a marketing team that cut its reporting time from 3 days to 3 hours.
5 steps take you from a story to a finished deck:
1. Pick the story and confirm you can share it
Pick a case with a clear before-and-after. Make sure you have permission to share the details, especially client names and numbers, before you build anything around them.
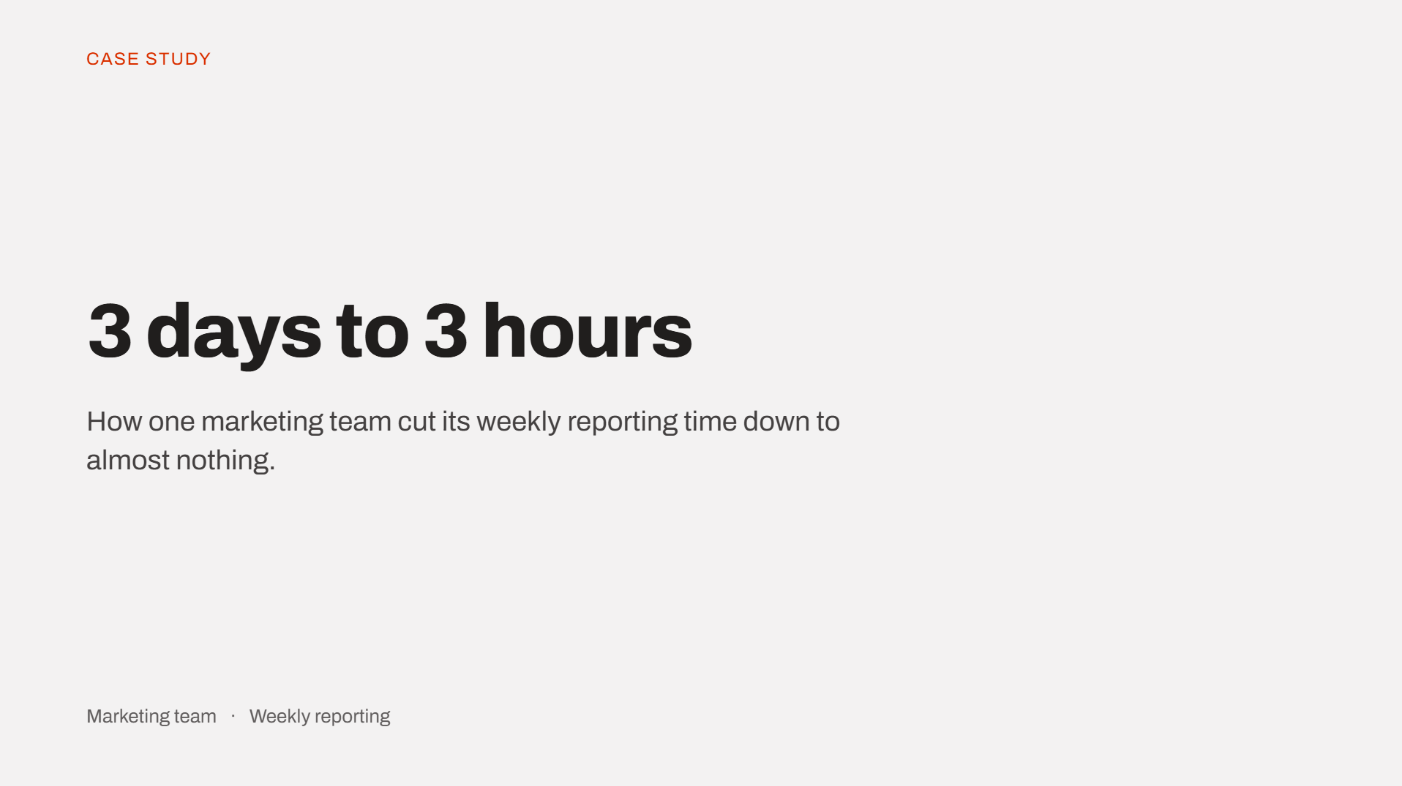
For our marketing team, that means checking with them first. Is the drop from 3 days to 3 hours in weekly reporting time fair game to share, along with the company name?
Once they confirm, that detail heads the title slide, with the headline stating the result up front.
2. Gather the data and proof
Pull the real metrics, quotes, and screenshots that back up the result. This is the step many people skip, and it's why so many decks lean on adjectives when they should lean on evidence.
For our team, that's a screenshot of the messy weekly spreadsheet 4 people used to pull numbers from 5 different dashboards by hand. That becomes the context slide.
3. Draft one idea per slide
Map your content to the 5-part arc, with one idea per slide. Write each slide's headline as the point being made, so it carries the message even without narration.
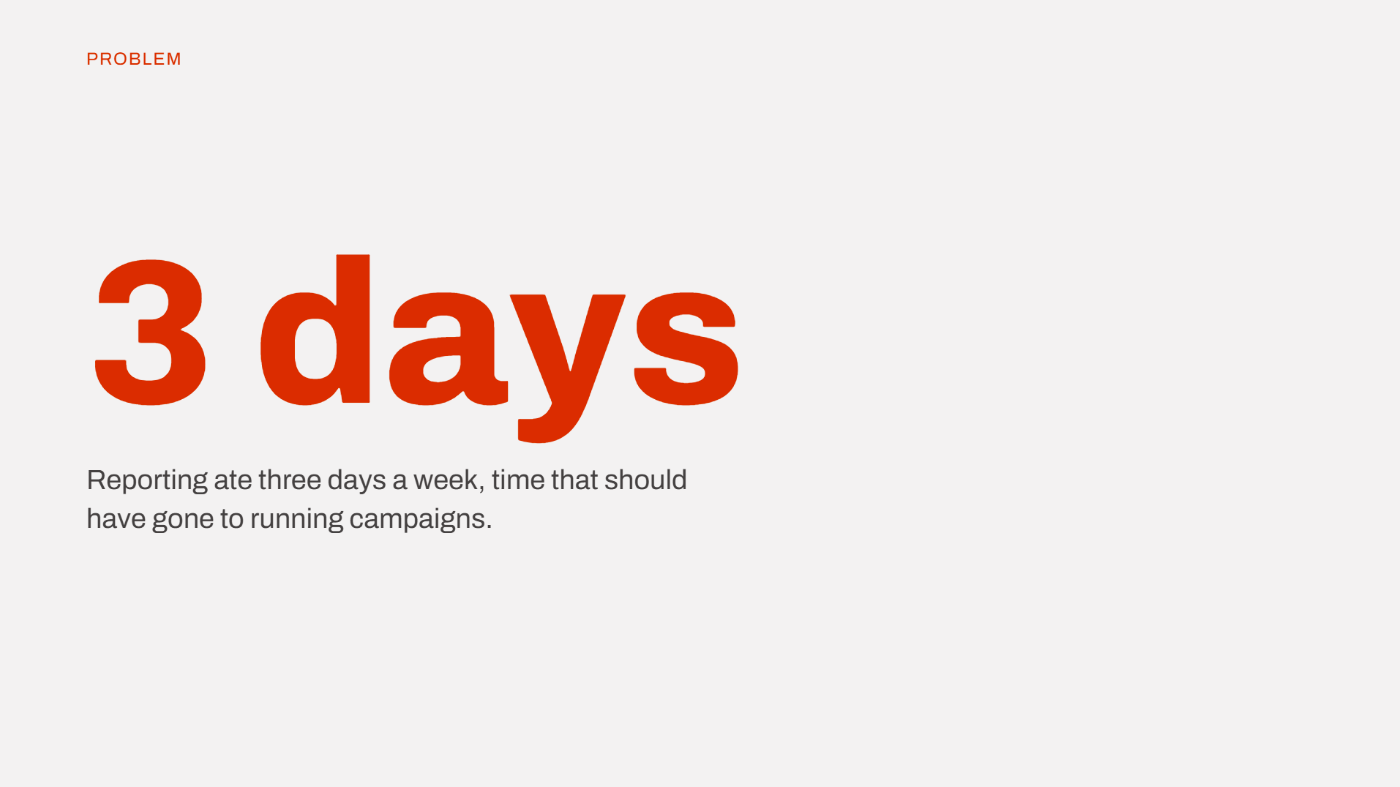
For our team, the problem slide leads with the one number that matters. Reporting ate 3 days a week.
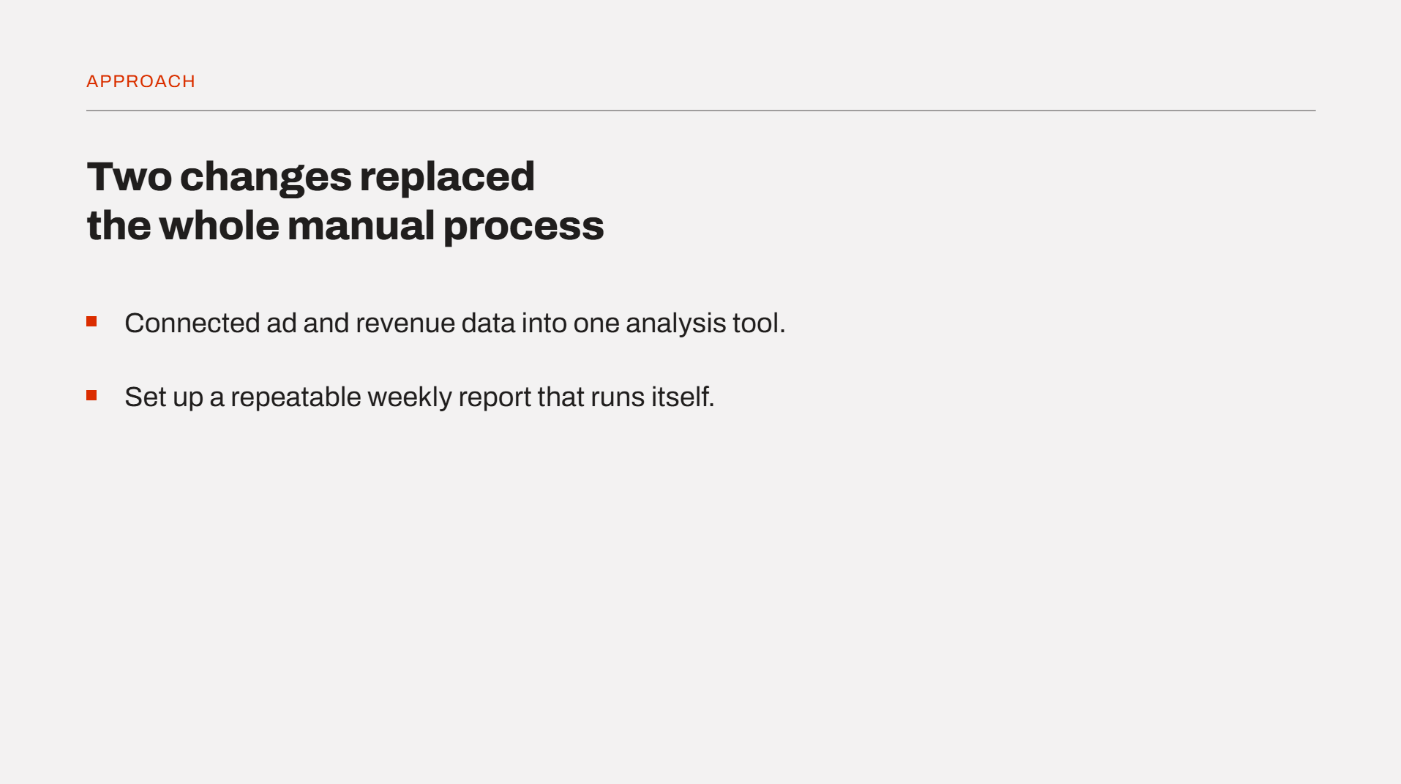
The approach slide covers what they did about it in 2 bullets. They connected their ad and revenue data to one analysis tool and set up a repeatable weekly report.
4. Design for clarity
Keep it clean with one chart per point, readable fonts, and consistent colors.
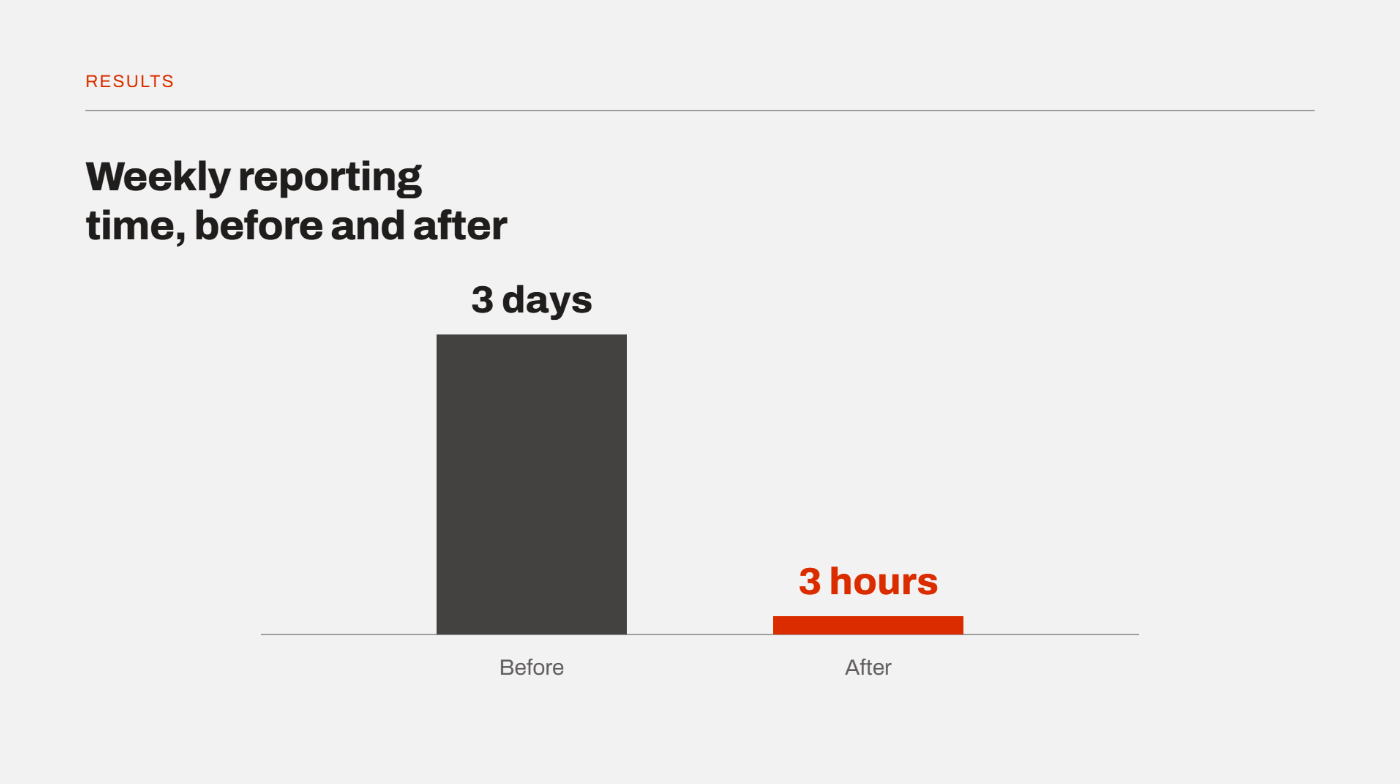
For our team, that shows up most on the results slide, a simple before-and-after bar chart showing reporting time dropping from 3 days to 3 hours. One chart, one point, nothing else competing for attention.
💡 Tip: Not confident in your design instincts? Check our guide on slide design basics before you start.
5. Tighten and rehearse
Cut anything that isn't context, problem, approach, results, or a takeaway. Run it out loud and time it. You'll find your rough spots the first time you say the thing.
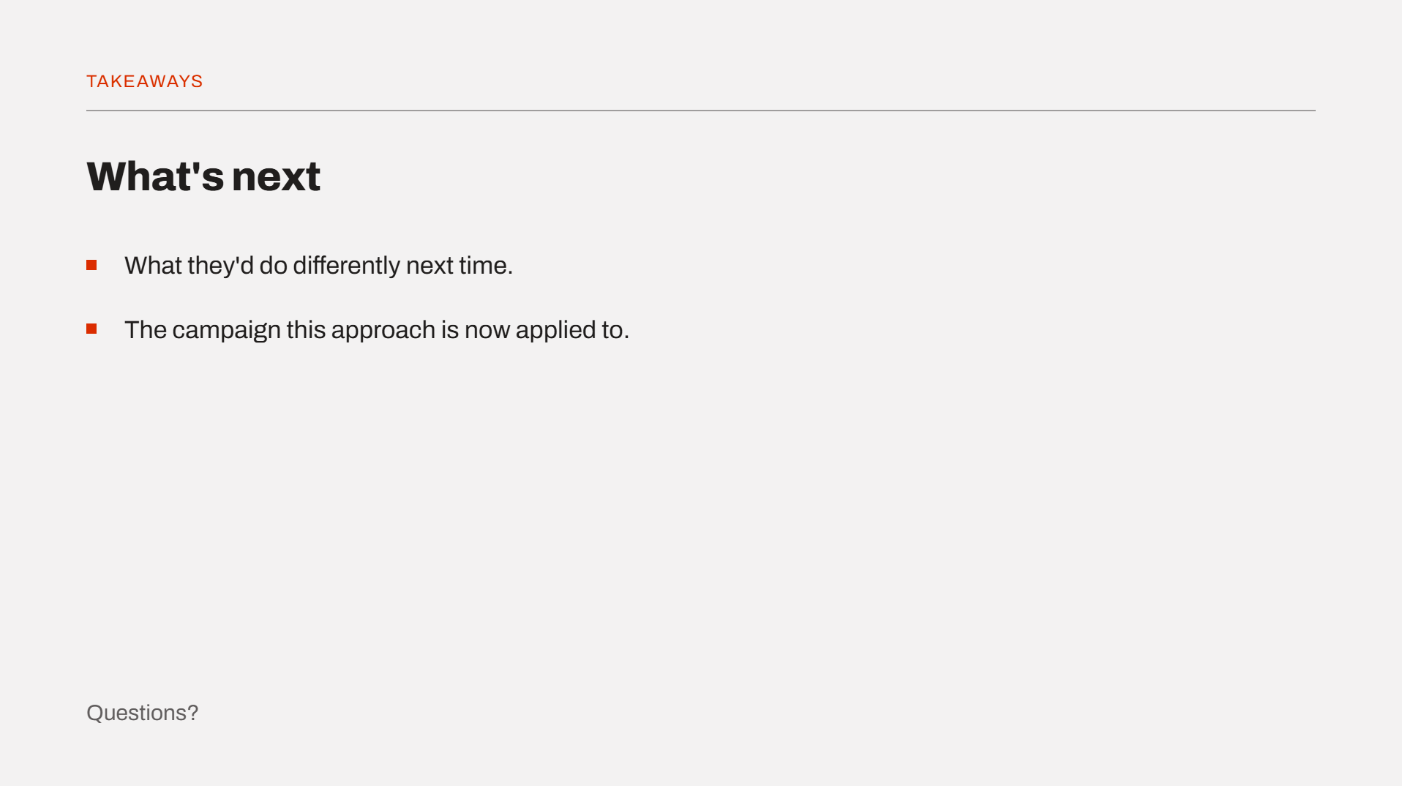
For our team, that discipline lands hardest on the takeaways slide, what they'd do differently and the campaign they're applying it to going forward. It closes by opening the floor for questions.
Download a copyable case study presentation template
Each row below maps to one slide, so you can build your deck section by section.
💡 Tip: Short on time? A condensed, one-slide version works for executive overviews, or for dropping a case study inside a bigger presentation. Problem goes on the left, approach in the middle, results on the right, enough for someone who wants the whole story in 30 seconds.
Get the free template
How to present a case study
A finished deck only covers half the job. Presenting it well is what keeps the room paying attention:
- Timing: Aim for 5 to 10 minutes on the core story, about a minute per slide. If your slot is shorter, cut slides before you cut the results.
- Narrate, don't read: Let the slide carry the headline and the visual, then narrate the story around it. Reading the slide word for word can lose the room fast.
- Make the subject the hero: The customer, the team, or the project did the work. You're the guide who helped them get there, so tell it that way.
- Handle questions well: Prepare for the top 3 questions before you walk in, and bring each answer back to your results.
Common mistakes to avoid
Showing tasks instead of outcomes trips up more decks than anything else. A slide that lists what got done still leaves the room asking so what.
Here are a few mistakes you’ll want to avoid:
- Overcrowding slides: Too much text or too many visuals overwhelms the room. I keep one point per slide, and cut anything that doesn't earn its place.
- Weak visuals: A blurry chart or an unrelated stock image undercuts credibility fast. I've swapped out a slide 10 minutes before presenting because the chart just didn't hold up.
- Skipping the takeaway: Ending on results without a lesson or next step leaves the room unsure what to do with what they just saw.
- Rushing the pace: Moving too fast loses people. I time my rehearsals out loud for this exact reason, since the first read-through always runs faster than the real thing.
Do the analysis and build the deck in Julius
Every case study presentation rises or falls on the results slide, and a results slide is only as strong as the analysis behind it. Many wrestle those numbers out of spreadsheets and dashboards first, which is where the hours disappear. Then there's a second bottleneck nobody talks about: turning that finished analysis into an actual deck. Julius closes both gaps.
Julius is an AI data analysis tool that turns a plain-English question into the analysis you need, then turns that analysis straight into a deck too.
Here’s how Julius can help:
- Data search: Ask a question, and Julius finds the data for you. It can pull public datasets from the web, or tap the Financial Datasets partnership for structured data on 17,000+ companies. There’s no upload needed either way.
- Connect: Pull live numbers straight from Postgres, Snowflake, BigQuery, and more.
- Upload: Bring your own files when the data is private or internal, CSVs and spreadsheets work the same way.
- Build the deck: Hand the finished analysis to Julius's AI Presentation Maker, so your numbers and your slides come from the same place.
Ready to turn your raw numbers into a deck that holds the room? Try Julius for free.
Frequently asked questions
What are the 5 components of a case study?
The 5 components of a case study are context, problem, approach, results, and takeaways. Together they carry your audience from the starting situation to a measurable outcome and a clear lesson.
How long should a case study presentation be?
A case study presentation usually runs 6 to 10 slides and 5 to 10 minutes. Tailor the length to your slot and audience, and cut setup slides before you cut your results.
Should I use one slide or a full deck?
Use a single slide for quick executive overviews or when the case study sits inside a bigger presentation. Use a full multi-slide deck for detailed pitches, workshops, or client reviews where you need room to show the work.
What makes a good case study topic?
A good case study topic has measurable results, a relatable problem, a clear before-and-after, and permission to share the details. If you can't name the number or show the names, pick a different case.
What tools can I use to make a case study presentation?
You can build the slides in PowerPoint, Google Slides, or Canva, and prepare the results and charts in a data-analysis tool. The deck tool handles the design, and the data tool handles the proof behind your results slide.