

Learning how to use Excel starts with staring down a wall of empty cells and buttons. It looks like it can do everything, which makes it hard to know where to start.
I've built budgets, project trackers, and reporting dashboards in Excel for years, and I've taught beginners starting from a completely blank sheet. Excel runs on a handful of ideas, and once they click, the rest falls into place.
I’ll walk you through the interface, formulas, functions, charts, and shortcuts, in an order that builds on itself. By the end, you'll have the basics down and a plan for getting better from there.
Getting to know the Excel interface (start here)
Before you type anything, it helps to know what you're looking at. Learning how to use Excel gets much easier once these four words make sense:
- Workbook: The whole file. When you save your work, you're saving a workbook (it ends in .xlsx).
- Worksheet: A single tab inside the workbook, also called a sheet or spreadsheet. One workbook can hold many worksheets, and you can switch between them using the tabs at the bottom.
- Cell: One box in the grid. It can hold a number, text, or a formula. Everything in Excel happens inside cells.
- Cell reference: The address of a cell. Columns are letters (A, B, C), rows are numbers (1, 2, 3), so the first cell is A1. The box in the top-left that shows the current address is the Name Box.
The ribbon, the strip of tabs and buttons across the top, is the other thing worth a look before you dive in. You only need to recognize five tabs to start:
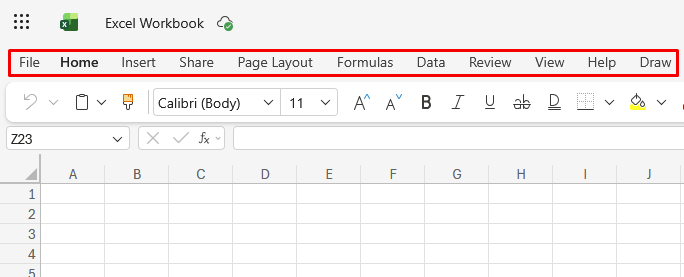
- Home: Everyday formatting, copy and paste, sort and filter.
- Insert: Charts, tables, and pictures.
- Formulas: The full function library.
- Data: Sorting, filtering, and importing data.
- View: Freezing panes and switching how the sheet displays.
To select a single cell, click it. To select a range, click and drag, or hold Shift and press the arrow keys. To select the entire sheet, click an empty cell and press Ctrl+A (if your cursor is inside a data range, press it twice).
How to enter and edit data
Click a cell, type a number or some text, and press Enter to move down or Tab to move right. A few shortcuts make editing faster from the start:
- Enter: Moves down to the next cell.
- Tab: Moves right to the next cell.
- F2: Edits the active cell in place (or double-click it).
- Alt+Enter: Adds a second line inside the same cell.
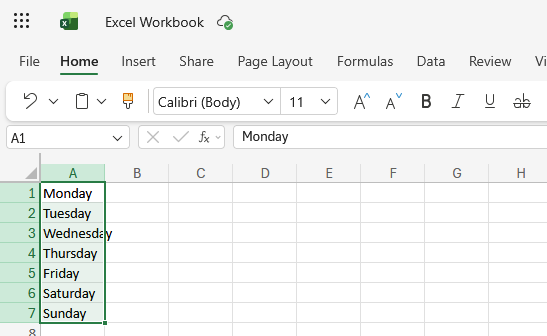
The fill handle, the small square at the bottom-right corner of a selected cell, is one of my favorite Excel shortcuts. Type "Monday" in one cell, grab the handle, drag down, and Excel fills in the rest of the week.
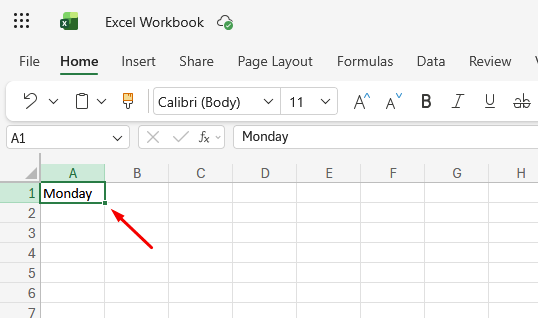
I use this same trick for numbers, dates, and simple patterns, and it saves a surprising amount of typing once it becomes a habit.
Numbers looking weird? Here’s the fix
Long numbers can trip you up in Excel. Type a 16-digit number, like a card number, into a cell, and Excel keeps only the first 15 digits. Anything past that gets rounded to zero, so the stored value itself changes. The cell may then show something like 1.5E+16.
To stop this from happening, select the cells first, open Format Cells, and set the category to Text before you type. This tells Excel to keep every digit exactly as you type it.
💡 Tip: Set the format before you enter long ID numbers, phone numbers, or anything with leading zeros. Formatting after the fact won't bring back digits Excel already dropped.
How to format your spreadsheet
Formatting is what turns a grid of numbers into something a person can read. Most of it lives on the Home tab:
Adding or removing rows and columns
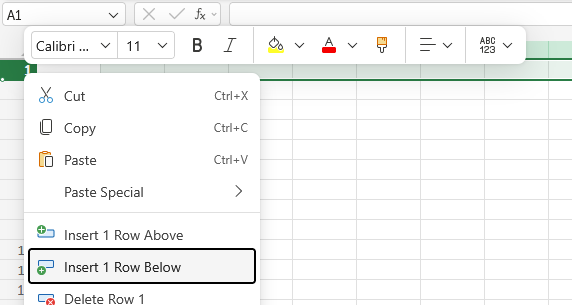
Right-click a row number or column letter and choose Insert. Excel pushes everything down or to the right and leaves you a blank row or column to work in. Delete works the same way.
Borders and shading
You'll find both borders and shading in the Font group on the Home tab.
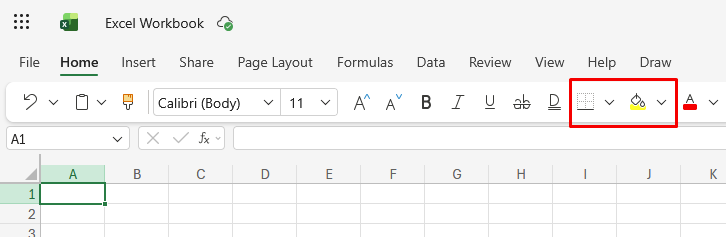
Select your cells, click the arrow next to the Borders button for a line style, or the Fill Color button to shade cells. A header row with light shading and a bottom border reads far more clearly than plain text.
Number formats
You'll find these in the Number group on the Home tab. They tell Excel what a number means. The same value can show as 1500, $1,500.00, 150000%, or a date, depending on the format you pick. Currency, percentage, and date are the three you'll reach for most.
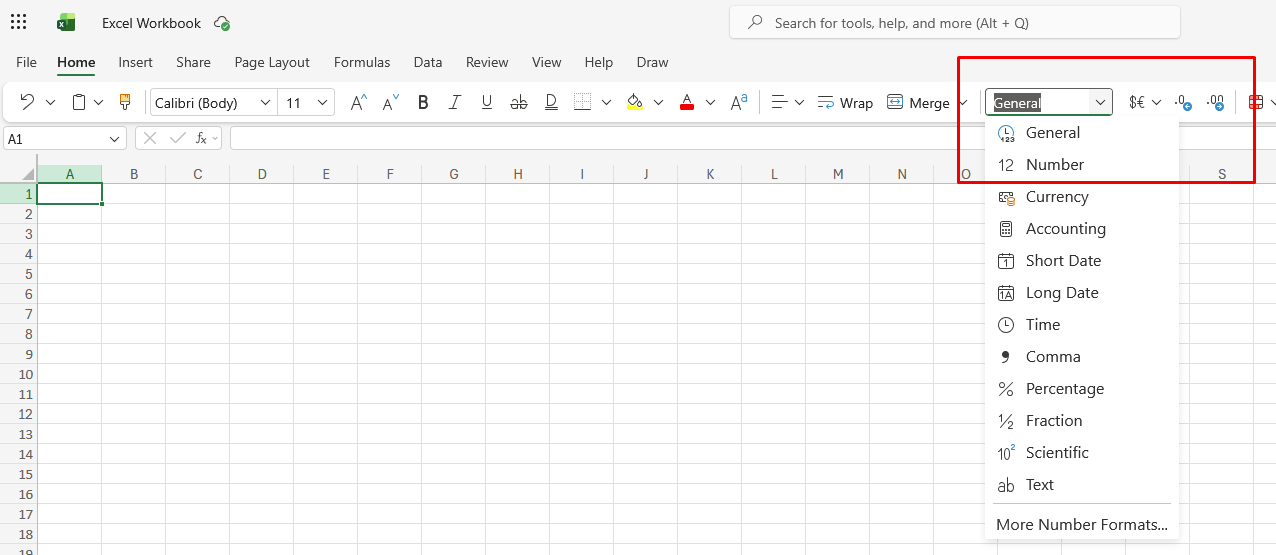
💡 Tip: Formatting only changes how the number looks. The value Excel stores stays the same, so your formulas keep working.
Column width and wrapped text
Widen a column by double-clicking the line between two column letters, which auto-fits it to the content. Wrap Text (on the Home tab) keeps long labels inside one cell without spilling over.
A caution on merging cells
Merging looks tidy, but it breaks sorting and filtering later and makes selections behave oddly. When you just want a label centered over several columns, use Format Cells, then Alignment, then "Center Across Selection." You get the same look without the headaches.
How to write formulas in Excel
Formulas are where Excel stops being a fancy table and starts doing the work for you. Every formula starts with an equals sign:
The basic math operators
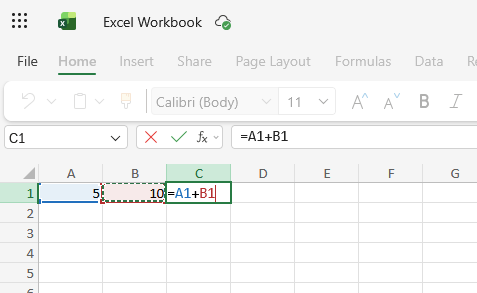
- Addition (+): Adds two values together.
- Subtraction (-): Subtracts one value from another.
- Multiplication (*): Multiplies two values.
- Division (/): Divides one value by another.
- Exponent (^): Raises a value to a power.
Order of operations
Excel follows the standard order of operations. Parentheses come first, then exponents, then multiplication and division, then addition and subtraction.
Excel multiplies before it adds, so =2+3*4 works out to 14.
If you want addition to happen first, wrap that part in parentheses. For example, =(2+3)*4 gives you 20.
💡 Tip: Wrap a calculation in parentheses even when it doesn't change the result. It makes the formula easier to read later, and you won't have to work out the order in your head each time.
Relative and absolute references
This is the concept that trips up most beginners, and I still see it catch people who've used Excel for years. When you copy a formula down a column, the references move with it. Copy =A1*B1 down one row, and it becomes =A2*B2, which is usually what you want.
But sometimes, you need one value to stay fixed. Say a tax rate lives in cell E1, and your sale amount is in A1. Lock the cell with dollar signs so the tax rate doesn't change. For example, =A1*$E$1 keeps the A1 part moving as you copy, while $E$1 stays pointed at the tax rate no matter where you paste the formula.
💡 Tip: Click the cell while you're writing a formula so Excel drops the reference in for you. It cuts down on typos.
7 Excel functions every beginner should know
Functions are prebuilt formulas. You call one by name, hand it a range of cells, and Excel does the math for you. Excel has hundreds of them, but these seven cover most of what you'll reach for early on:
| Function | What it does | Example |
| SUM | Adds up a range of numbers | =SUM(A1:A10) |
| AVERAGE | Finds the mean of a range | =AVERAGE(A1:A10) |
| COUNT | Counts how many cells in a range hold a number | =COUNT(A1:A10) |
| IF | Checks a condition and gives one of two answers | =IF(B2>100,"Over","Under") |
| VLOOKUP or XLOOKUP | Searches a table and pulls back matching information from another column | =VLOOKUP(A2,D:F,3,FALSE) |
| CONCAT | Joins text from multiple cells into one | =CONCAT(A2," ",B2) |
| TRIM | Removes extra spaces from text | =TRIM(A2) |
A few of these are worth a closer look:
IF
IF checks whether something is true or false, then gives a different answer for each case.
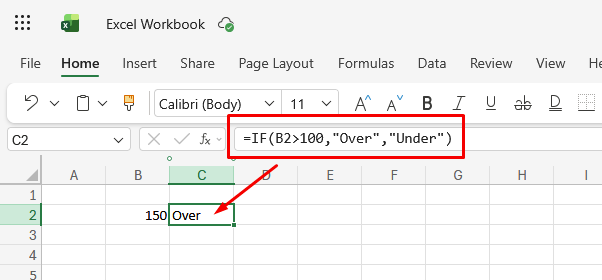
=IF(B2>100,"Over","Under") shows "Over" when B2 holds a number greater than 100, and it shows "Under" when B2 holds 100 or less.
Try IF on something small first, so you can see exactly how it reacts before you trust it in a bigger sheet.
VLOOKUP or XLOOKUP
VLOOKUP searches down the first column of a range you pick, finds a match, then pulls back a value from another column in that same row.
In =VLOOKUP(A2,D:F,3,FALSE), the range is D:F, so Excel numbers those columns starting at 1 for column D. That makes D column 1, E column 2, and F column 3. The 3 in the formula tells Excel to pull the value from F, since F sits in the third position inside that range.
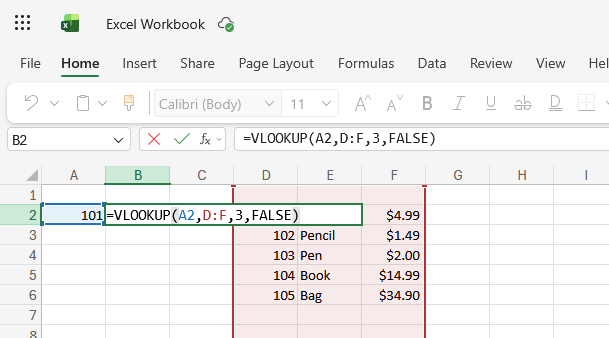
Count columns from the left edge of whatever range you pick, and the number will land where you expect it to.
FALSE at the end of the formula tells Excel to look for an exact match and nothing else. If Excel can't find one, it returns an error instead of guessing.
Leave FALSE out, or swap in TRUE, and Excel will grab the closest match it can find, which can hand you the wrong value without any warning.
XLOOKUP does the same job with fewer quirks on newer versions of Excel. Use that first if your version has it.
💡 Tip: Start typing a function name after the equals sign, and Excel shows you a menu with the arguments it expects. Press Tab to accept the highlighted one.
How to sort and filter your data
Sorting rearranges your rows, while filtering hides the ones you don't need to see right now. They both help you make sense of a long list without touching a formula:
Sorting your data
Click any cell in the column you want to sort, then go to the Data tab and click A-Z for ascending order or Z-A for descending order.
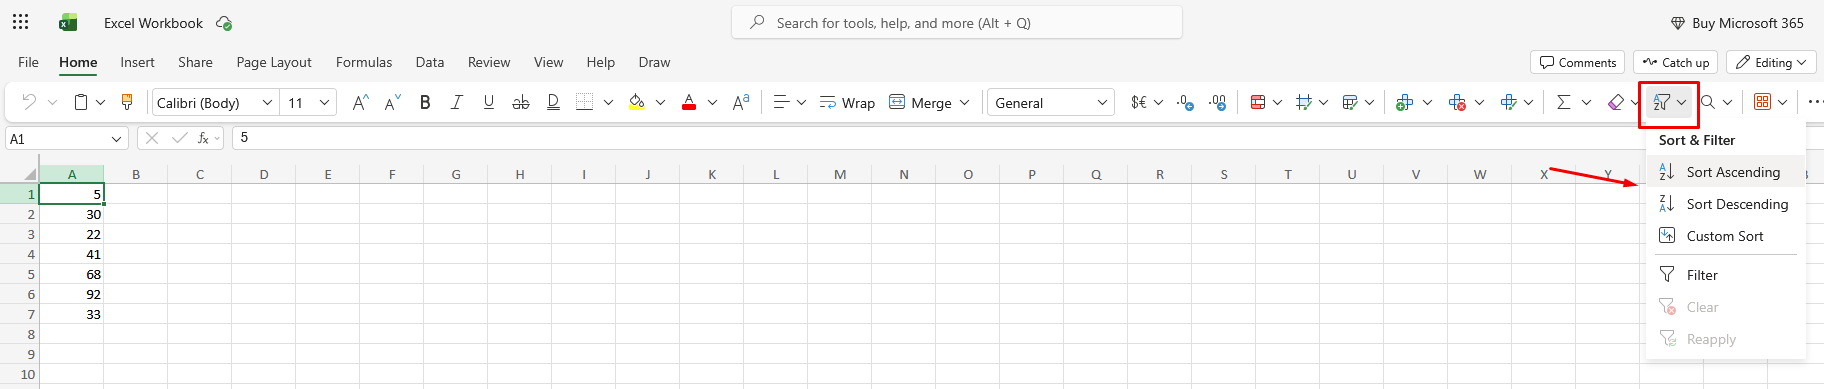
Excel sorts the entire table by that column and keeps every row intact, so a name and its matching numbers stay together.
Sometimes one column isn't enough. Say you want to sort a sales list by region first, then by revenue within each region. On the Data tab, click Sort (Custom Sort in Excel for web) instead of the quick A-Z buttons, and Excel opens a dialog where you can add multiple levels.
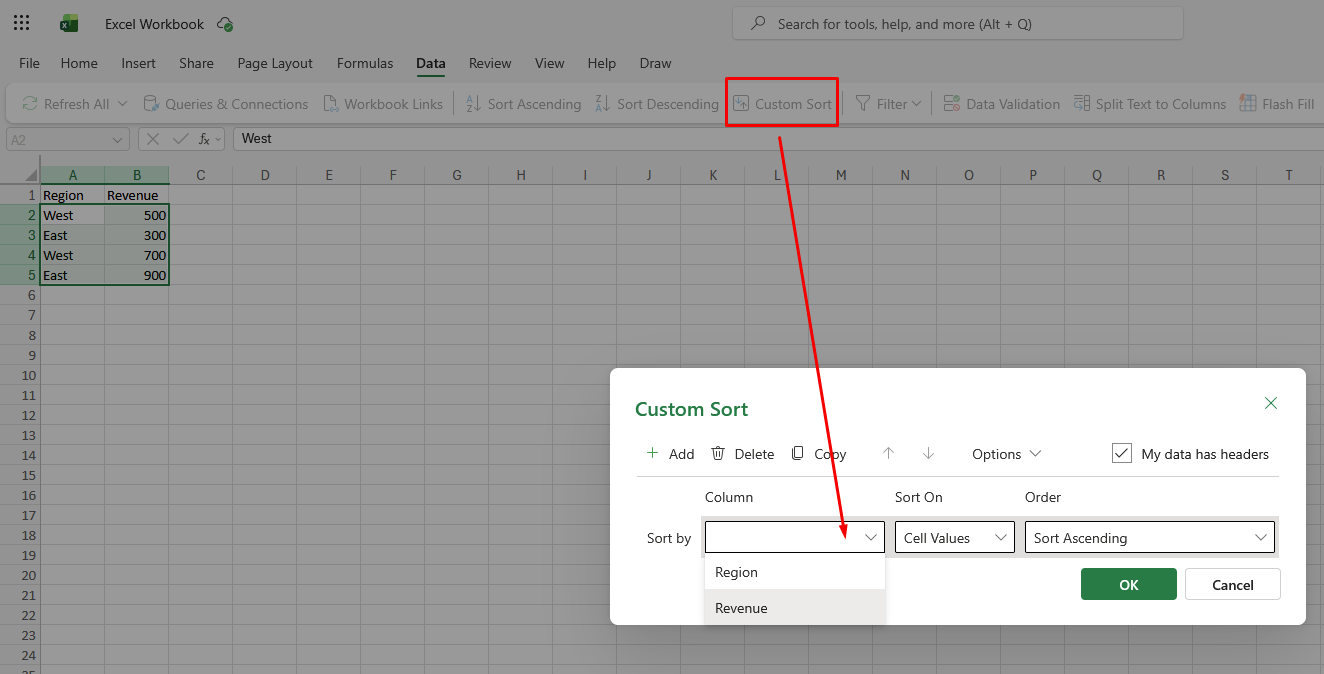
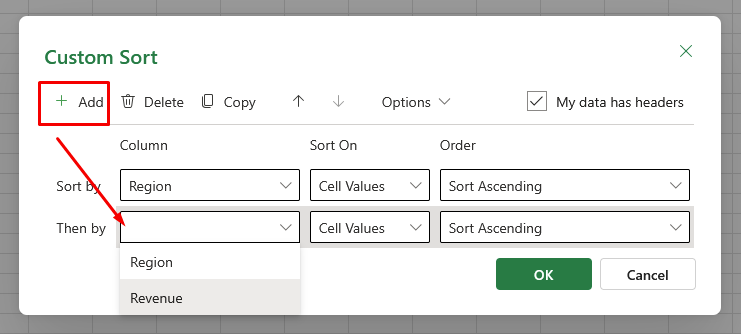
Set the first row to sort by Region, then click Add and set the new row to sort by Revenue. Excel sorts your rows by region first, then breaks ties inside each region by revenue.
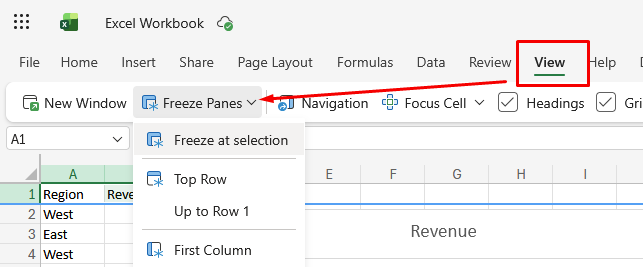
For big sheets that scroll past the top row, freeze panes so your headers stay put. On the View tab, choose Freeze Panes, and you can keep your header rows visible while you scroll through hundreds of rows.
Filtering your data
Click any cell in your table, then go to the Data tab and click Filter.
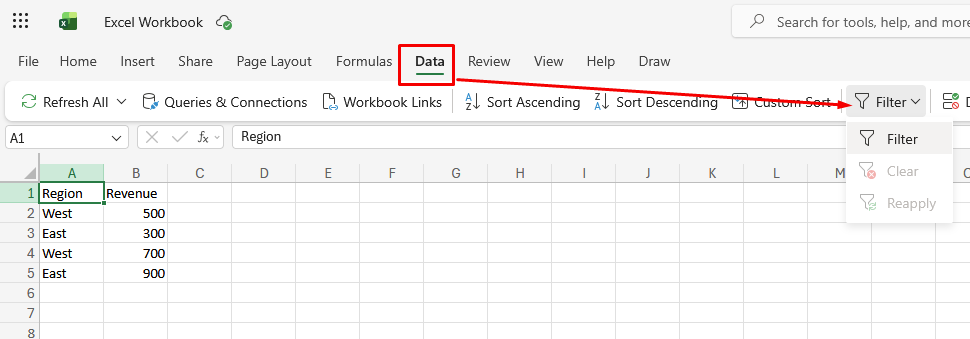
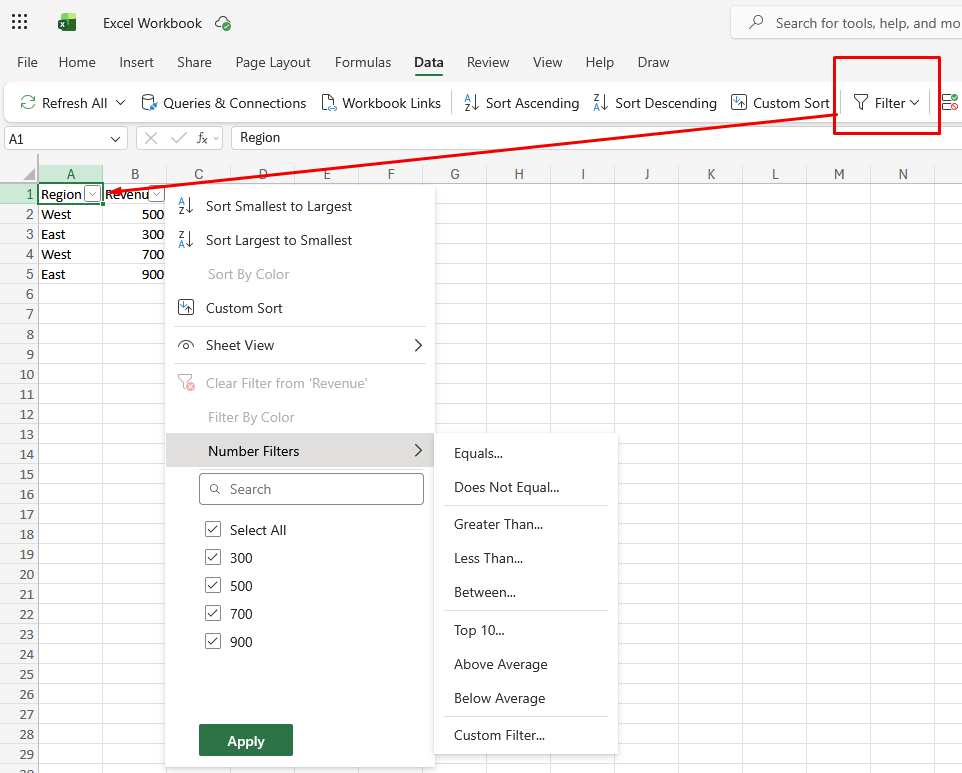
Excel adds a small dropdown arrow to each column header. Click one of those arrows, and you can check off the exact values you want to see, or open Number Filters (Text Filters for a text column) to set a condition like "greater than" or "contains."
To bring hidden rows back without removing the filter setup, click Clear in the Sort & Filter group on the Data tab. If you want to remove the dropdown arrows entirely, click Filter again on the Data tab. This also brings every hidden row back.
💡 Tip: A funnel icon on a column header means a filter is active there. Glance at your headers to see which columns are currently narrowed down.
How to create a chart in Excel
A chart turns rows of numbers into something you can read at a glance. Excel builds charts straight from the data you already have on the sheet:
Selecting your data
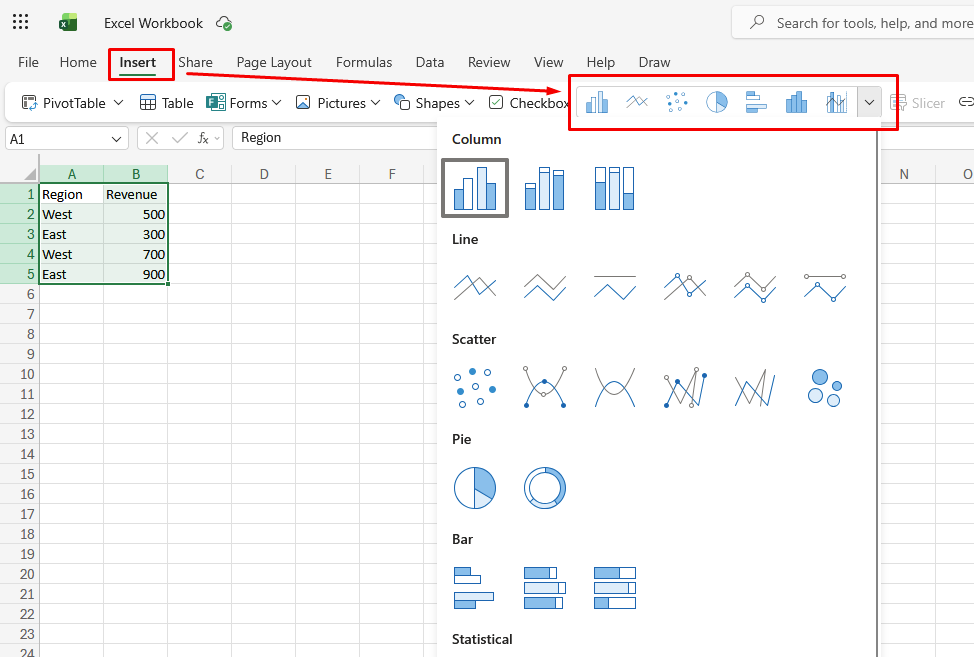
Highlight the range you want to chart, including the header row. If your data sits in two side-by-side columns, like Region and Revenue, select both columns together so Excel knows which labels go with which numbers.
Inserting the chart
Go to the Insert tab and look at the Charts group. On desktop, click Recommended Charts and pick one from the preview. In Excel for web, click a chart type icon directly, like Column or Pie, or choose a style from the gallery that opens when you click on the arrow.
Editing the chart
Click anywhere on the chart. On desktop, two new tabs appear on the ribbon: Chart Design and Format.
In Excel for web, you get one Chart tab instead, with the same kinds of options combined together, chart title, axis titles, legend, data labels, and formatting.
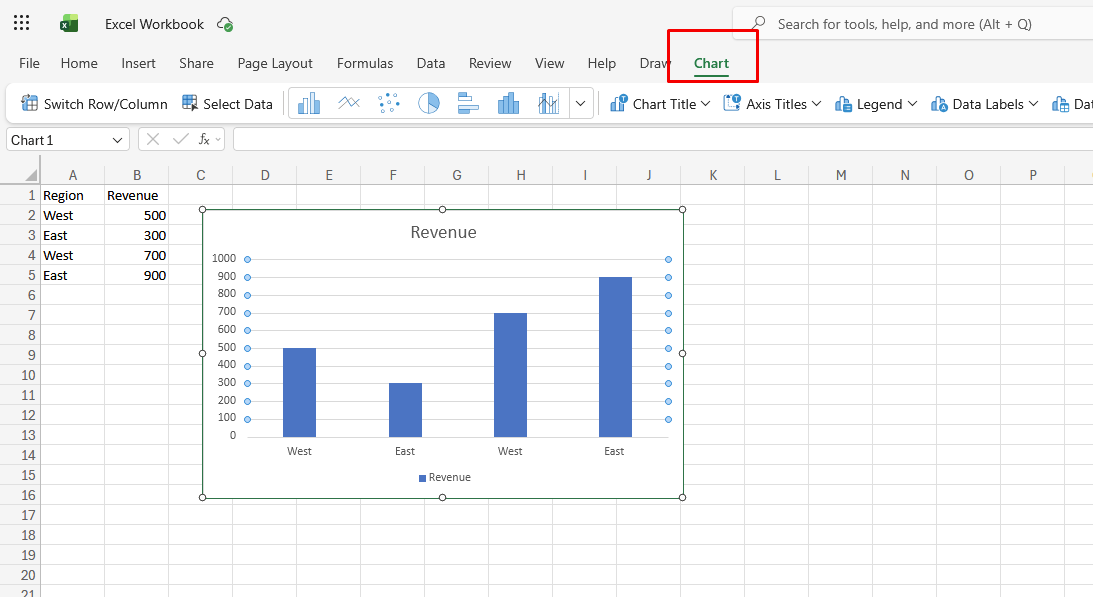
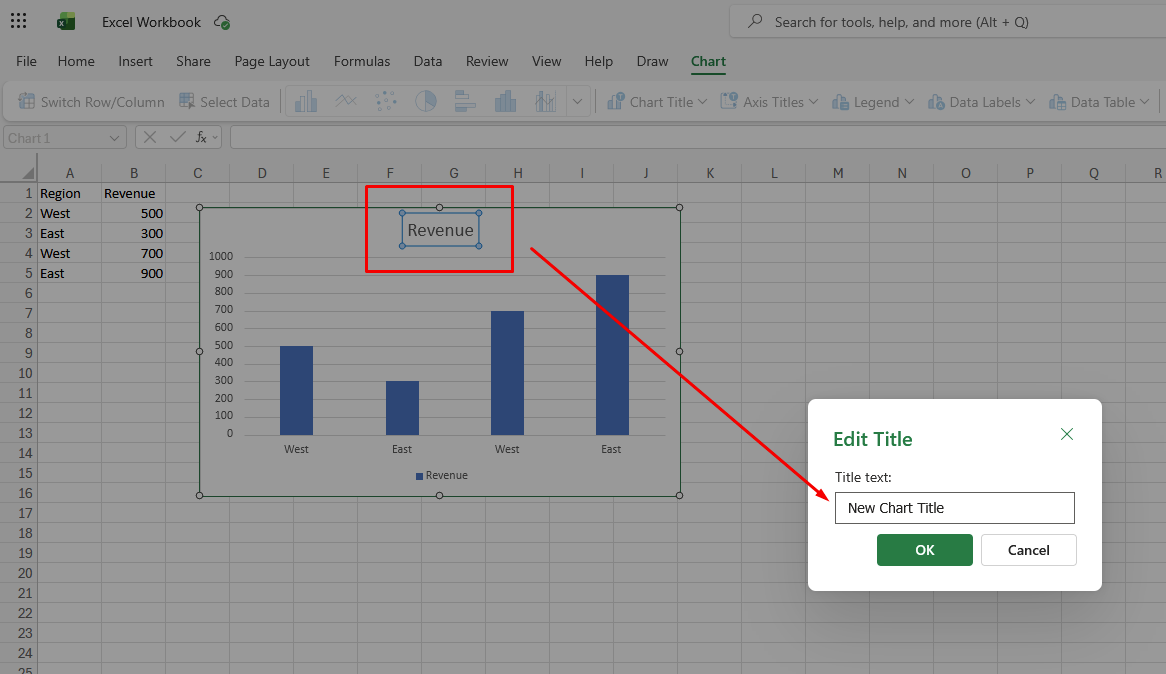
To rename the chart title, double-click it and type over the placeholder text. To resize the whole chart, click and drag one of the corner handles.
Click a data point on the chart, and Excel usually highlights the cells it came from on the sheet, as long as your chart sits on the same worksheet as its source data. It's a fast way to trace a number back to its source.
I default to a column chart for comparing categories and a line chart for showing change over time. Pie charts look appealing, but they get hard to read past five or six slices, so I save them for short lists.
💡 Tip: If you want to go beyond the basics, like adding trendlines or exporting a chart to PDF, check out our full guide to creating charts in Excel.
Keyboard shortcuts and function keys worth knowing
You can do everything in Excel with the mouse, but a few shortcuts pay for themselves in the first week:
| Shortcut | What it does |
| Ctrl+S | Saves your workbook |
| Ctrl+Z / Ctrl+Y | Undo / redo (Ctrl+Y also repeats your last action, similar to F4 below) |
| Ctrl+C / Ctrl+V | Copy / paste |
| Ctrl+Shift+L | Toggles filters on the current range |
| Alt+= | Inserts an AutoSum |
| Ctrl+Arrow key | Jumps to the edge of your data |
The function keys along the top of your keyboard do a surprising amount of work in Excel once you know what they do. Here's the short version:
| Key | What it does in Excel |
| F1 | Opens Help |
| F2 | Edits the active cell (cursor jumps into it) |
| F4 | Toggles absolute references ($) while editing a formula; repeats your last action otherwise |
| F5 | Opens Go To |
| F7 | Runs the spell check |
| F9 | Recalculates all formulas |
| F11 | Creates a chart from the selected data on a new sheet |
| F12 | Opens Save As |
Learn a shortcut only after you can do the same task the slow way with the mouse. Understanding what the shortcut does sticks better than memorizing the keys cold.
💡 Tip: If a task repeats the exact same way every week, record it once as a macro and let Excel replay those steps for you automatically.
How to save, share, and print your work
Save early and often with Ctrl+S.
The first time, Excel asks where to put the file and what to name it. Stick with the default .xlsx format unless you specifically need a .csv (a plain text version that drops formatting and formulas, useful for moving data into other tools).
If your file lives on OneDrive or SharePoint, Excel autosaves as you go.
To share, use the Share button in the top-right to invite people to co-edit, or just send the file.
To print, press Ctrl+P, then check the preview.
Two settings save most print headaches: set a Print Area (Page Layout tab) so you only print the range you want, and choose Fit Sheet on One Page from the Scaling dropdown in the print preview so your columns don't spill onto a second sheet.
How to learn Excel on your own
You don't need a course to get good at Excel. You need an order to learn things in and a real reason to practice. Here's the path I'd follow, roughly in this sequence:
- The interface and vocabulary (workbook, worksheet, cell, reference).
- Entering and editing data.
- Formatting so your sheets are readable.
- The seven core functions from earlier in this guide.
- Sorting and filtering.
- Charts.
- PivotTables, once you're comfortable with the basics.
- Shortcuts, layered in as you go.
The trick is to practice on something you actually care about. Rebuild your monthly budget, a workout log, or a tracker for a project you're running. You'll hit real problems, look up the answers, and remember them because they mattered.
Be realistic about the timeline. A few focused hours get you functional, enough to build a clean sheet and run basic formulas. Feeling comfortable, including PivotTables and lookups, often takes a few weeks of regular use.
When you're ready for a bigger project, try building an Excel dashboard to pull formatting, formulas, and charts together in one place.
Go from a question to the answer without the manual work
Learning how to use Excel is worth it. But when data prep, lookups, and formula-wrangling eat the hours you wanted to spend on the actual answer, an AI tool can handle that part for you.
Julius is an AI-powered data analysis tool. You ask questions in plain English, and it analyzes your data, then builds the charts to match, no formulas required. We built Julius for the moment when you know the question but don't want to hand-build every step to get there.
Here's how Julius helps:
- Data search: Julius can search the web for public datasets or pull structured financial data for more than 17,000 companies through its Financial Datasets integration, so you can start with a question, no upload needed.
- Plain-English queries: Describe what you want to know, and Julius writes and runs the analysis for you.
- Built-in visualization: Julius returns the analysis with charts on the spot, so you're not jumping into another tool to build them.
- One-click sharing: Turn an analysis into a report you can send without extra formatting.
Ready to spend less time wrangling cells and more time on the answer? Try Julius for free today.
Frequently asked questions
What are the 7 basic Excel formulas?
The 7 most useful functions for beginners are SUM, AVERAGE, COUNT, IF, VLOOKUP, CONCAT, and TRIM. SUM, AVERAGE, and COUNT handle everyday math on a range, and IF makes decisions. VLOOKUP matches values across a table, while CONCAT and TRIM clean up and combine text. Learn these first to handle most common spreadsheet tasks.
Is Excel hard to learn?
No, Excel isn’t hard to learn at a basic level. A few focused hours are enough to build a clean sheet, enter data, and run simple formulas. Reaching fluency with lookups and PivotTables takes a few weeks of regular use, but you become useful long before you become an expert.
Can AI do my Excel work for me?
Yes, AI can handle a growing share of Excel work, especially analysis, charting, and answering questions about your data. Tools like Julius let you ask a question in plain English and get the analysis and visuals back without writing formulas. It won't replace knowing your way around a spreadsheet, but it can take repetitive prep off your plate.