
Overview
In the realm of statistical analysis, the one-sample t-test stands as a pivotal tool, particularly when it comes to comparing a single sample mean against a known or hypothesized value. This test is part of the broader t-test family, which is renowned for comparing mean scores in various scenarios. Unlike its counterparts—the independent and dependent-sample t-tests—the one-sample t-test focuses solely on one group, offering unique insights into how it stacks up against a predetermined benchmark.
Understanding the One-Sample T-Test
The essence of the one-sample t-test lies in its ability to compare the mean of a single sample to a specific value. This value could be a population mean or any other theoretically established figure. The test essentially determines if the observed sample mean significantly deviates from this set value, either being greater or lesser.
In contrast, the independent sample t-test compares means of two distinct groups, answering questions like, “Do boys and girls differ in their SAT scores?” The dependent sample t-test, on the other hand, compares matched scores or measurements, such as pre and post scenarios, answering questions like, “Do pupils’ grades improve after receiving tutoring?”
Practical Applications of the One-Sample T-Test
The one-sample t-test finds its utility in various scenarios, such as:
1. Testing Against a Predetermined Value: Researchers might want to test if the average age of retirement in a population is indeed 65. By sampling individuals entering retirement and comparing their retirement age against the value of 65, the one-sample t-test can validate or refute this assumption.
2. Benchmark Testing: Organizations might want to test if their average production time aligns with industry benchmarks. The one-sample t-test can ascertain if there's a significant deviation from these benchmarks.
3. Replication Studies: In cases where an experiment is replicated, the one-sample t-test can compare the results of the replication against the original study's findings to check for consistency.
Conducting the One-Sample T-Test in SPSS
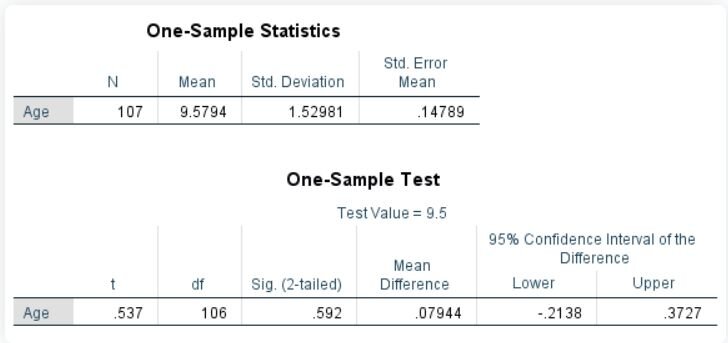
To illustrate, let's consider a scenario where we want to determine if the average age of a student population significantly differs from 9.5 years. The steps in SPSS would be:
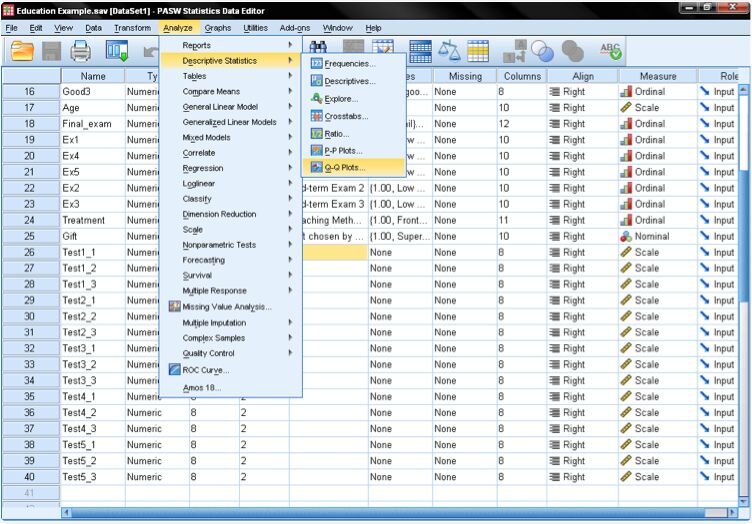
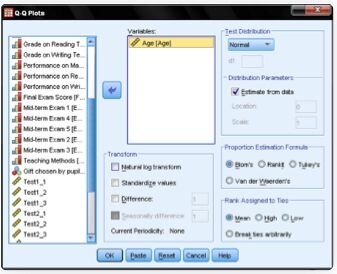
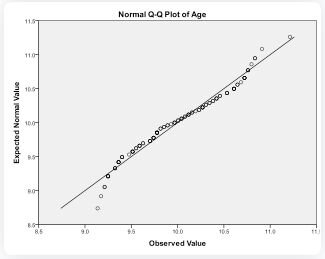
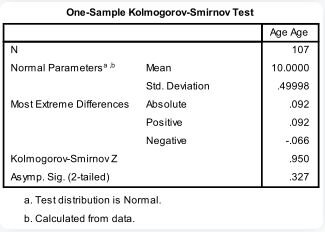
1. Check for Normality: Using a Q-Q Plot and a Kolmogorov-Smirnov test, we first ascertain if the variable (age) is normally distributed.
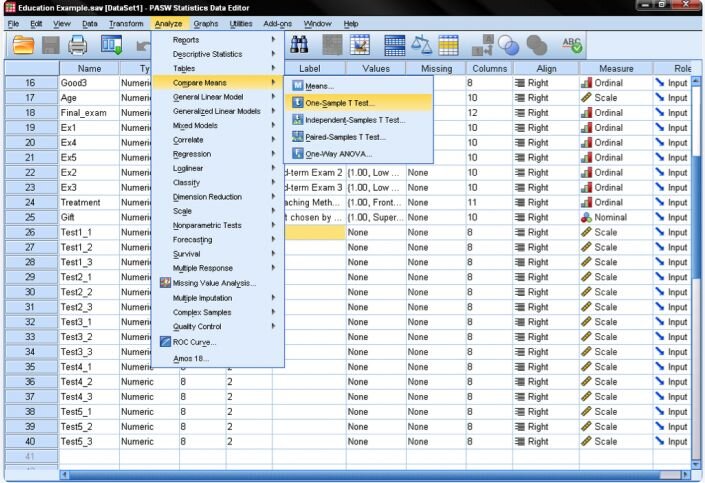
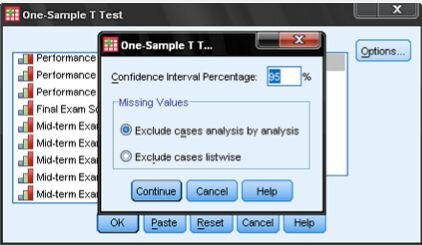
2. Setting Up the Test: In SPSS, navigate to Analyze > Compare Means > One-Sample T Test. Add the test variable (age) and enter the Test Value (9.5).
3. Interpreting Results: The output will provide the p-value. If the p-value is greater than the significance level (typically .05), the null hypothesis (that the mean age is 9.5) cannot be rejected.
Conclusion: How Julius Can Assist
The one-sample t-test is a robust tool for comparing a single sample mean against a predetermined value. Its simplicity and precision make it a go-to method for researchers and analysts across various fields. For those looking to delve deeper into data analysis and interpretation, Julius offers a platform that simplifies these processes. With intuitive tools and guidance, Julius can help users conduct and interpret one-sample t-tests, ensuring accurate and insightful results for their research or business needs.