Loved by 2,000,000+ users and trusted by individuals at



Featured in


Analyze data and turn insights into action
Ask questions, create visualizations, and turn findings into presentations or websites.
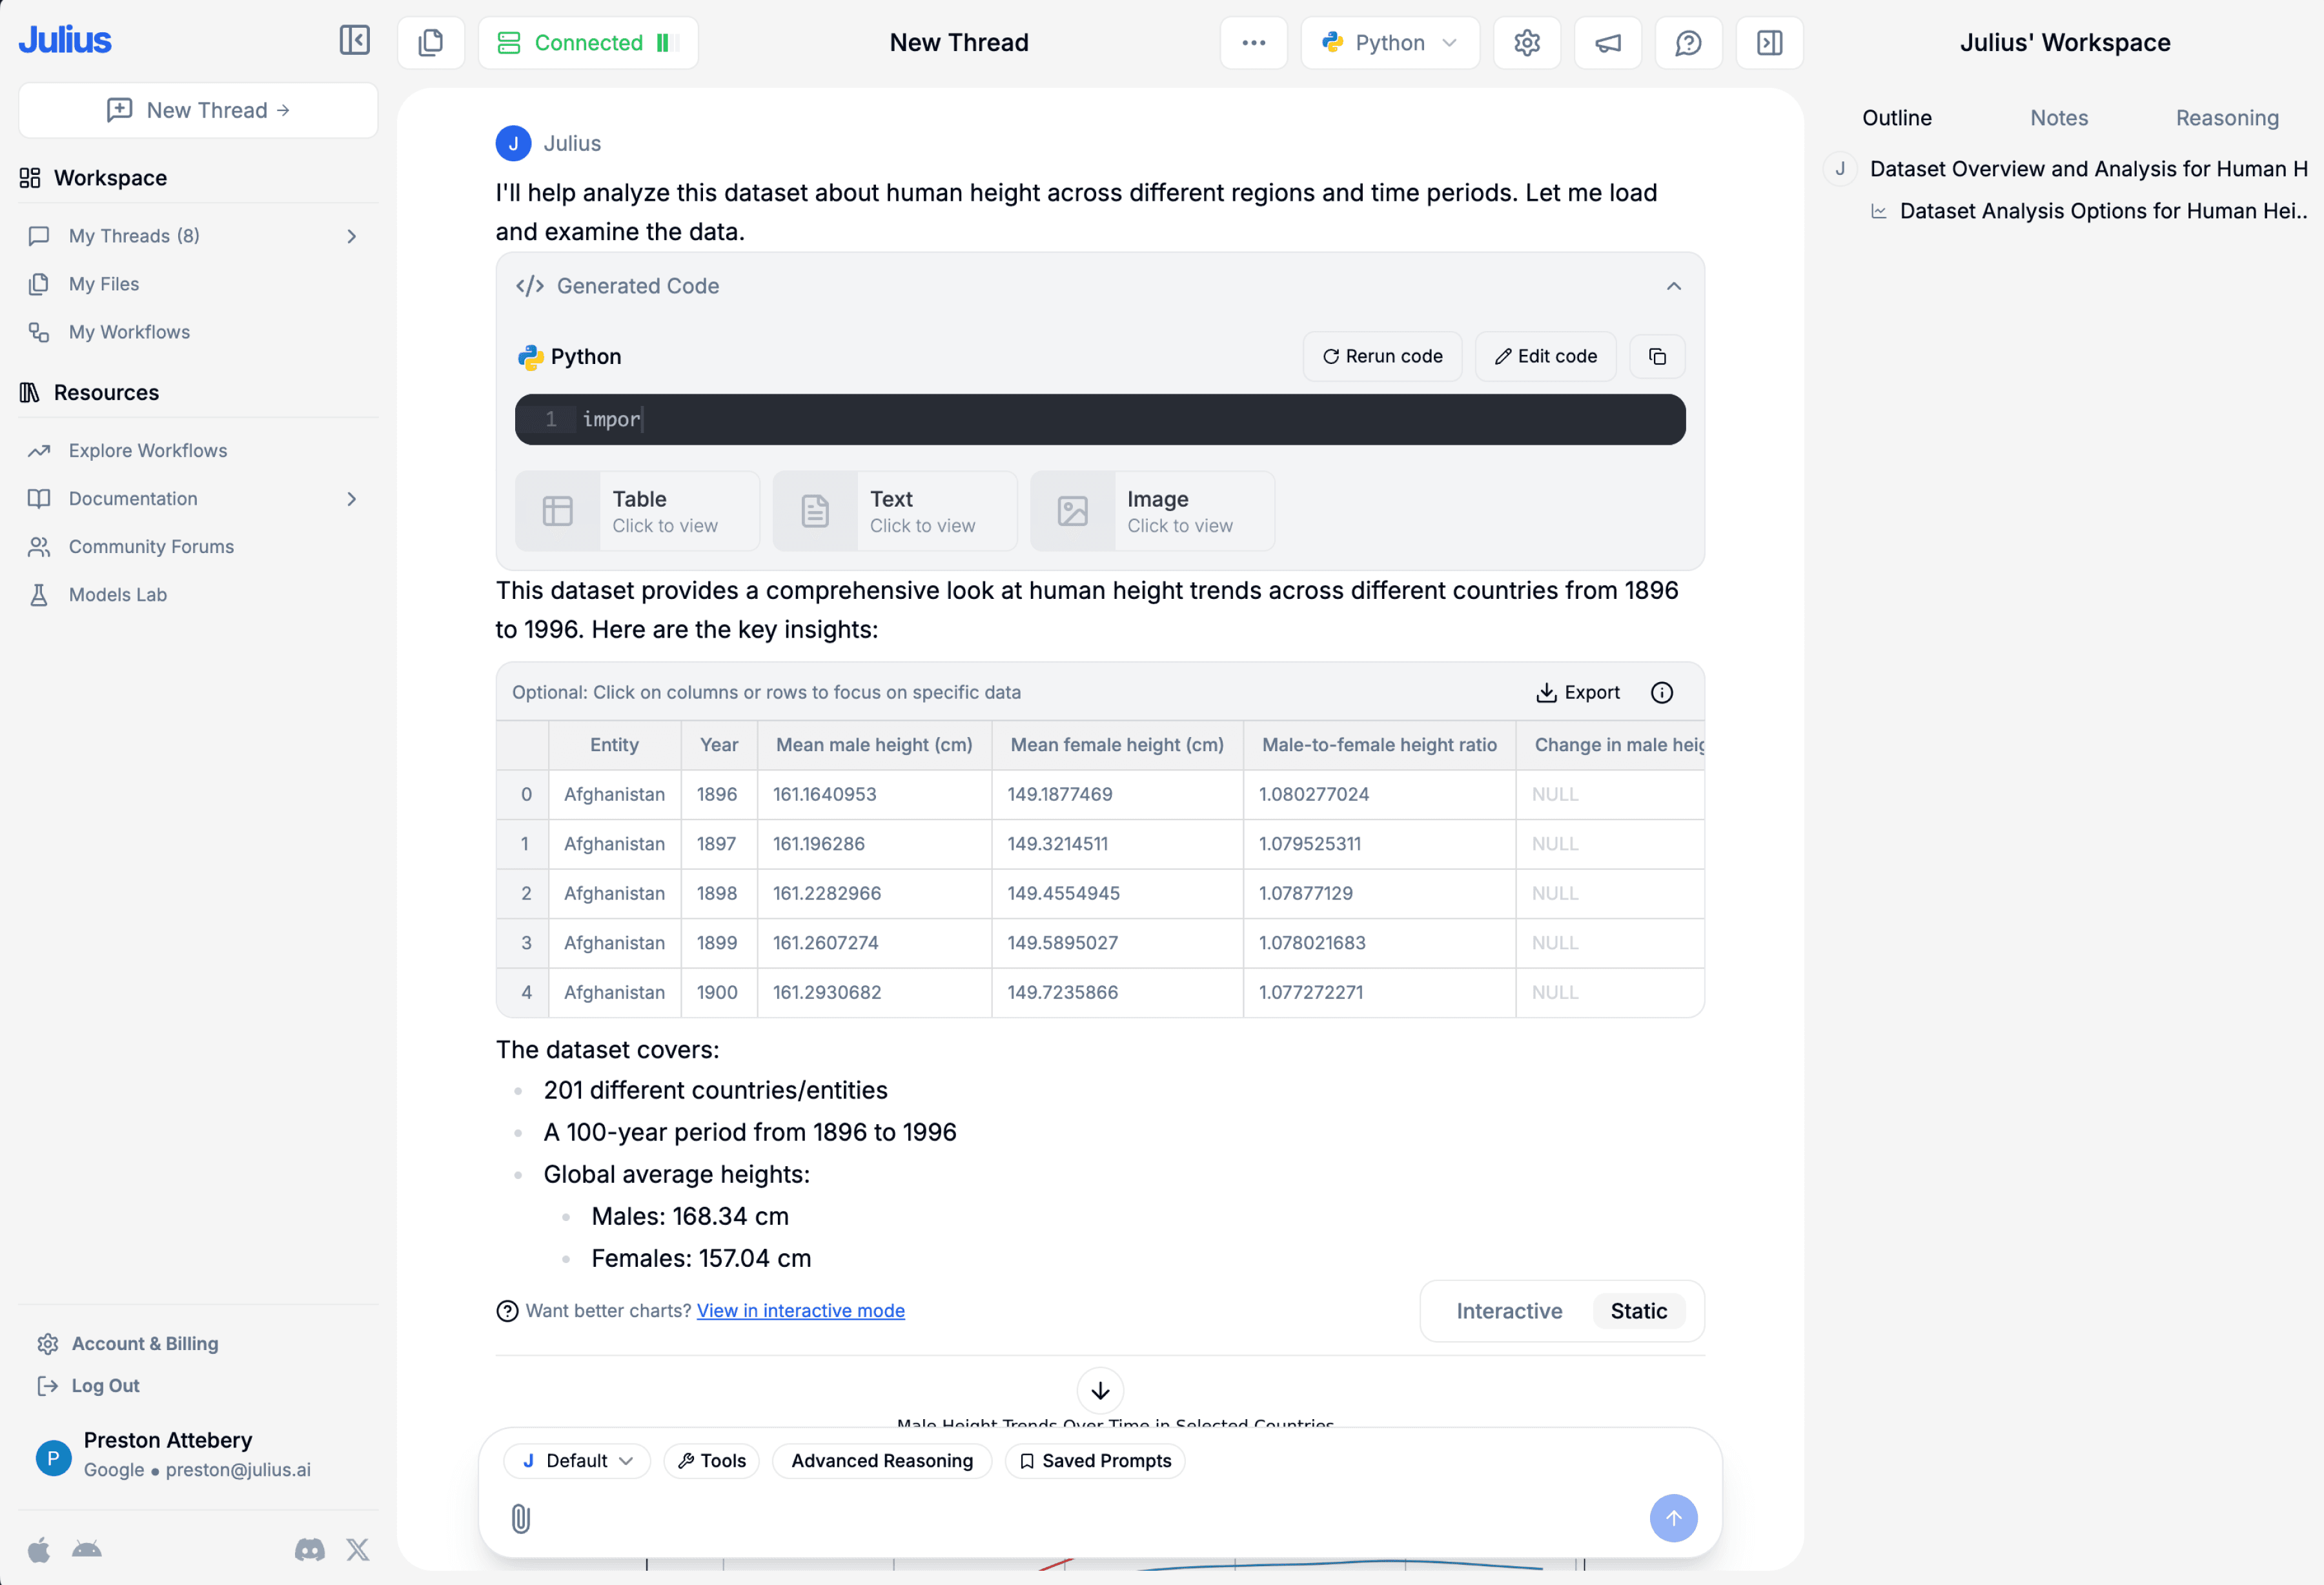
Analyze data with AI
Ask questions and get clear answers in seconds.
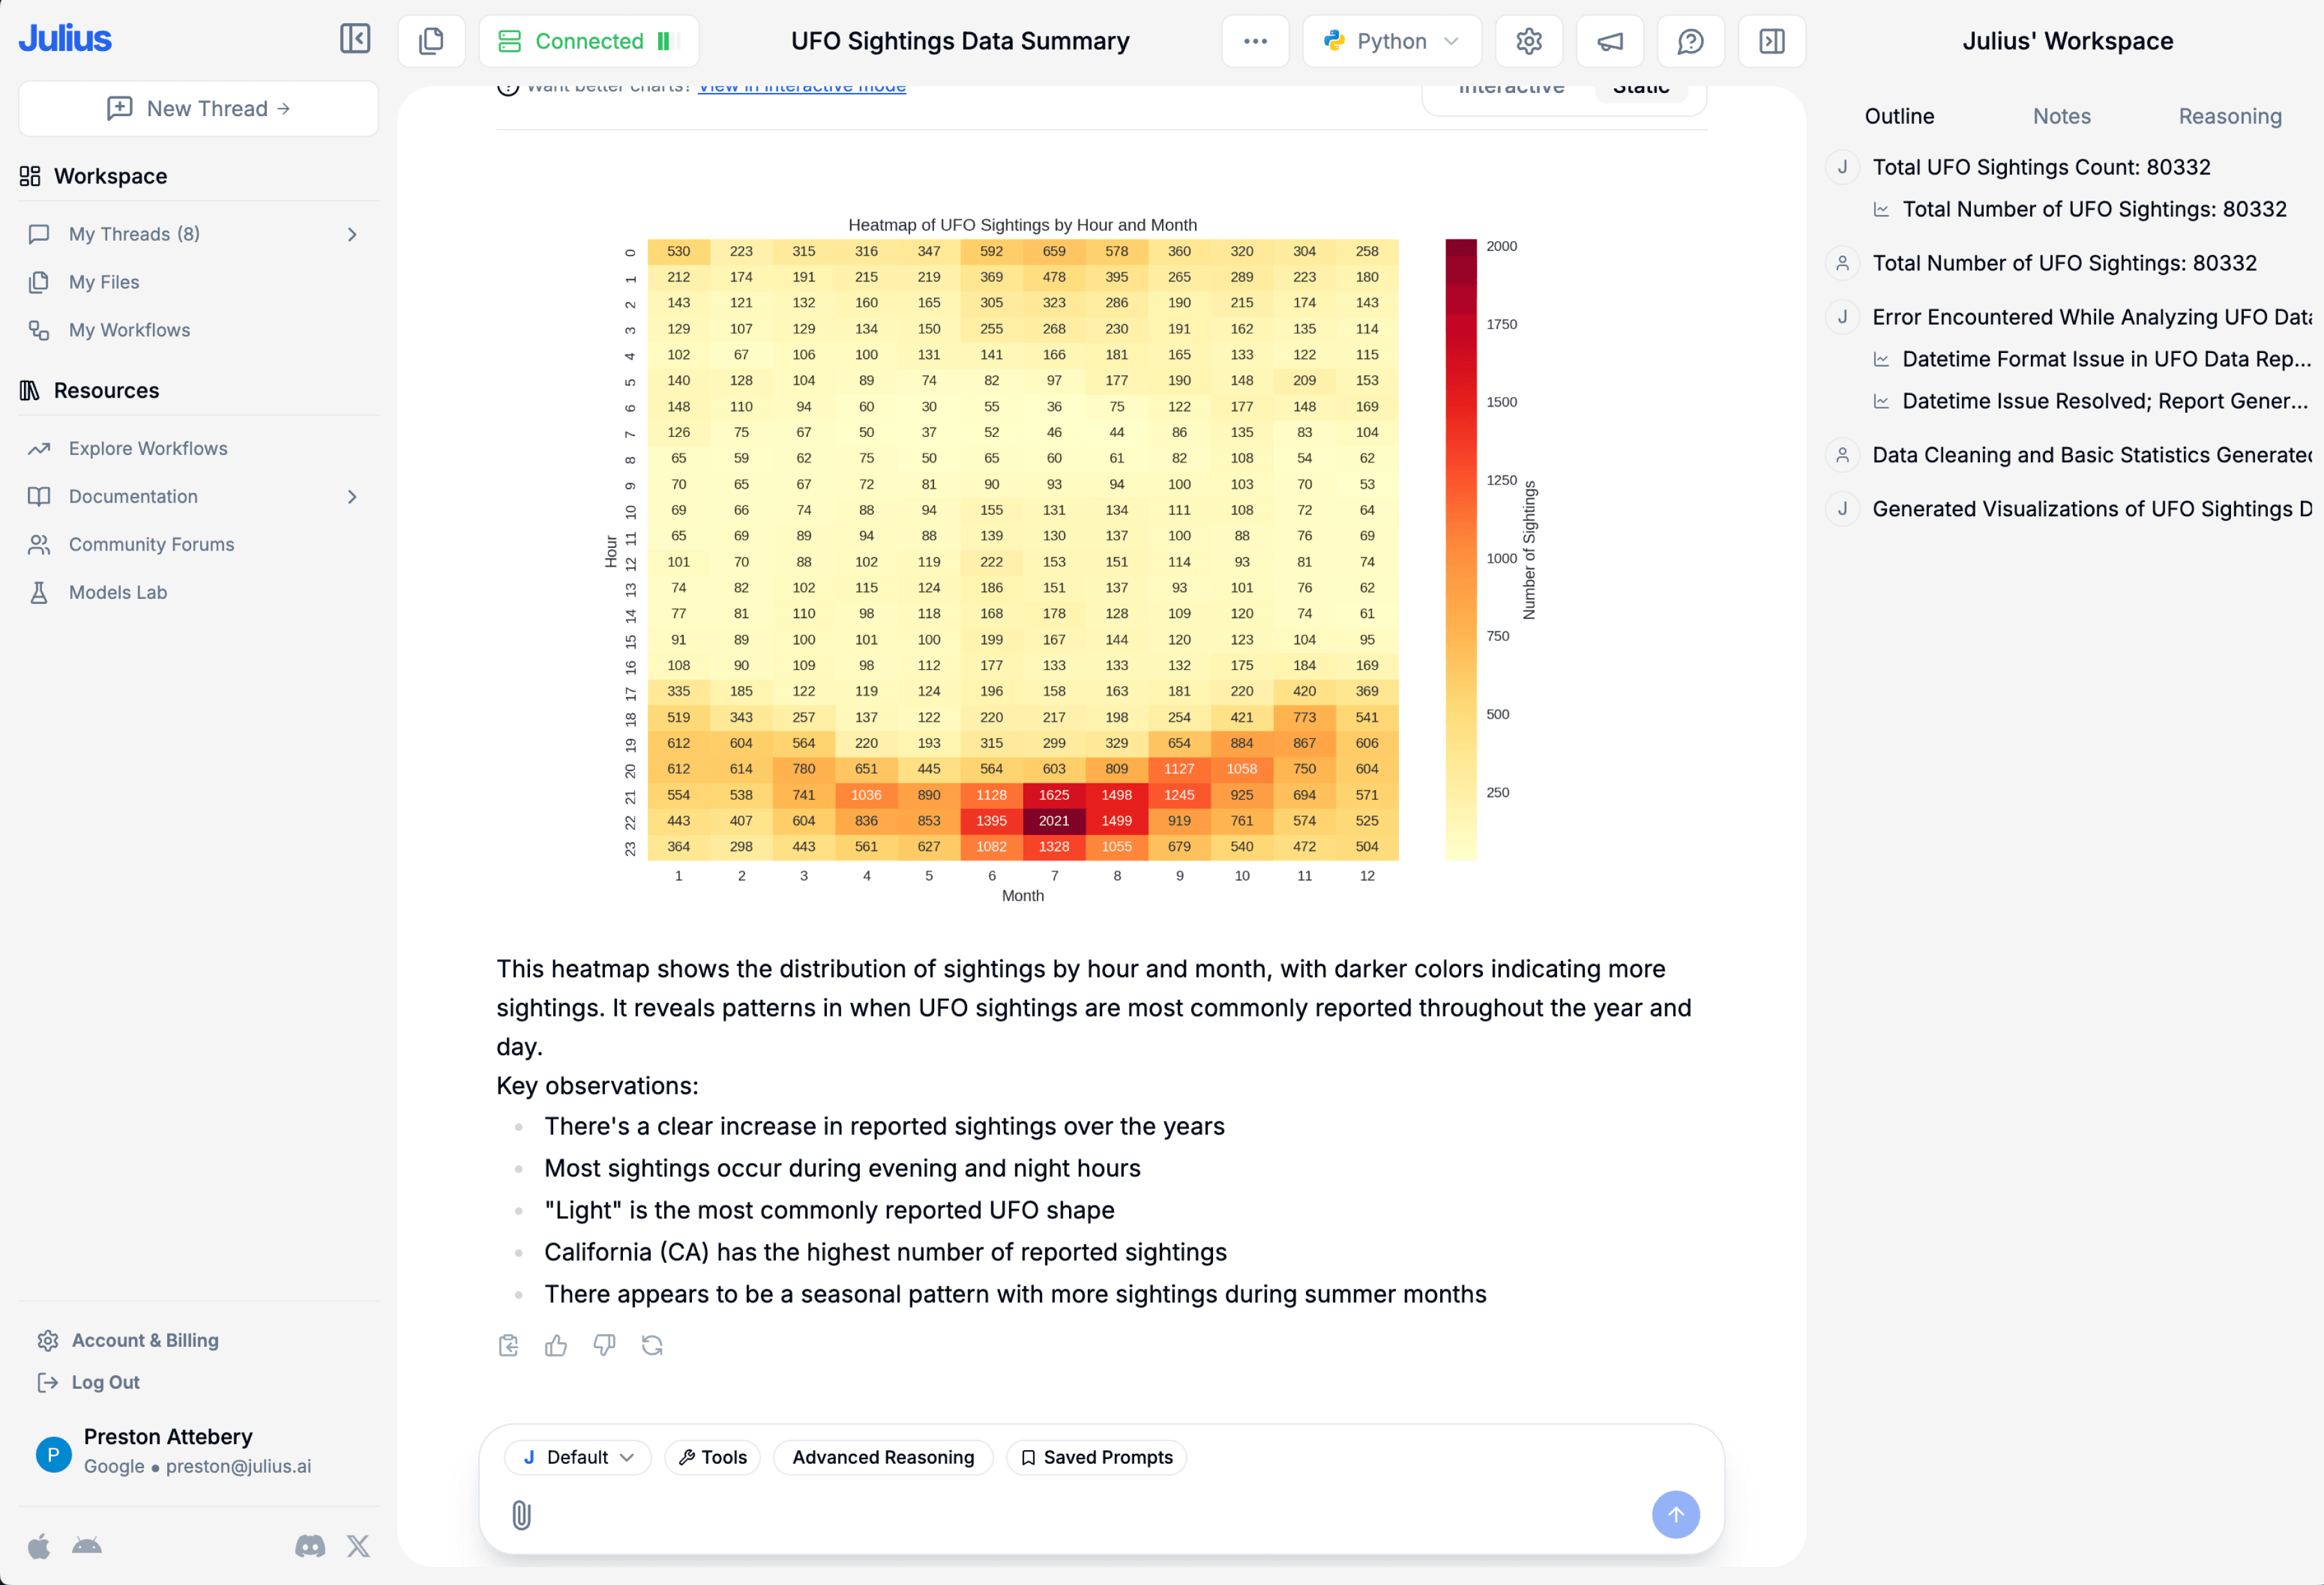
Create data visualizations
Turn results into clear charts and graphs.
Clean and prepare data
Automate repetitive data preparation.
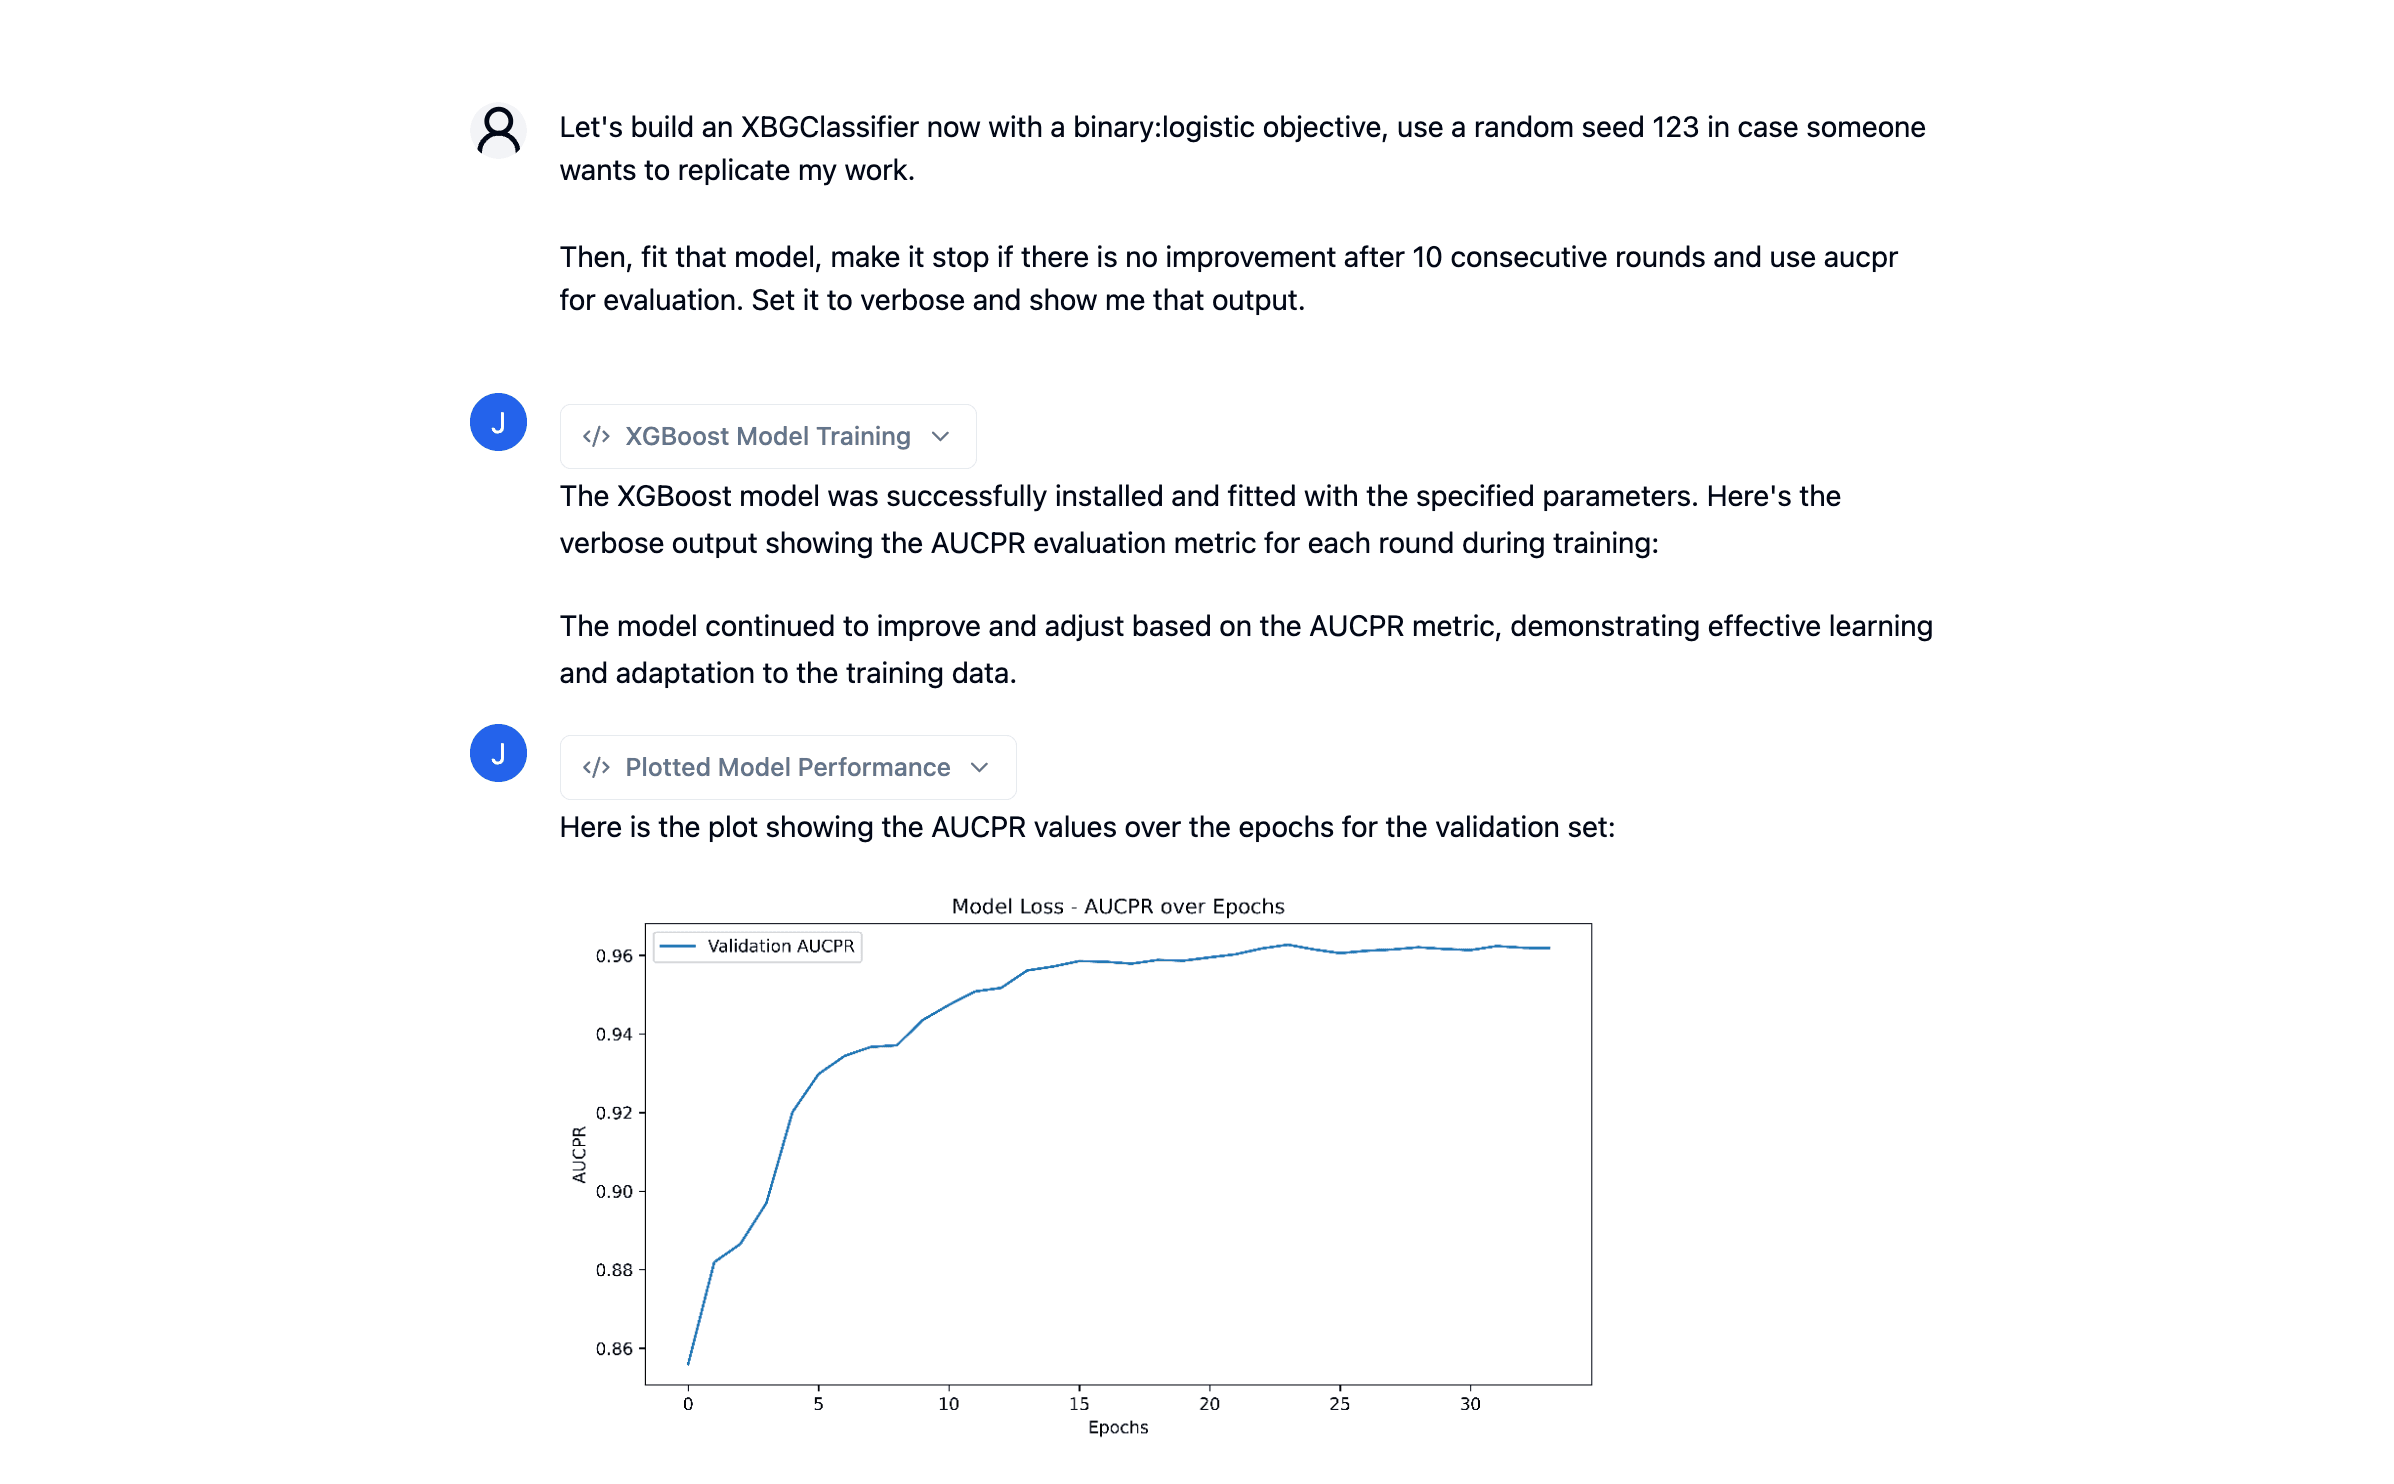
Run statistical analysis
Build models and forecasts using plain English.
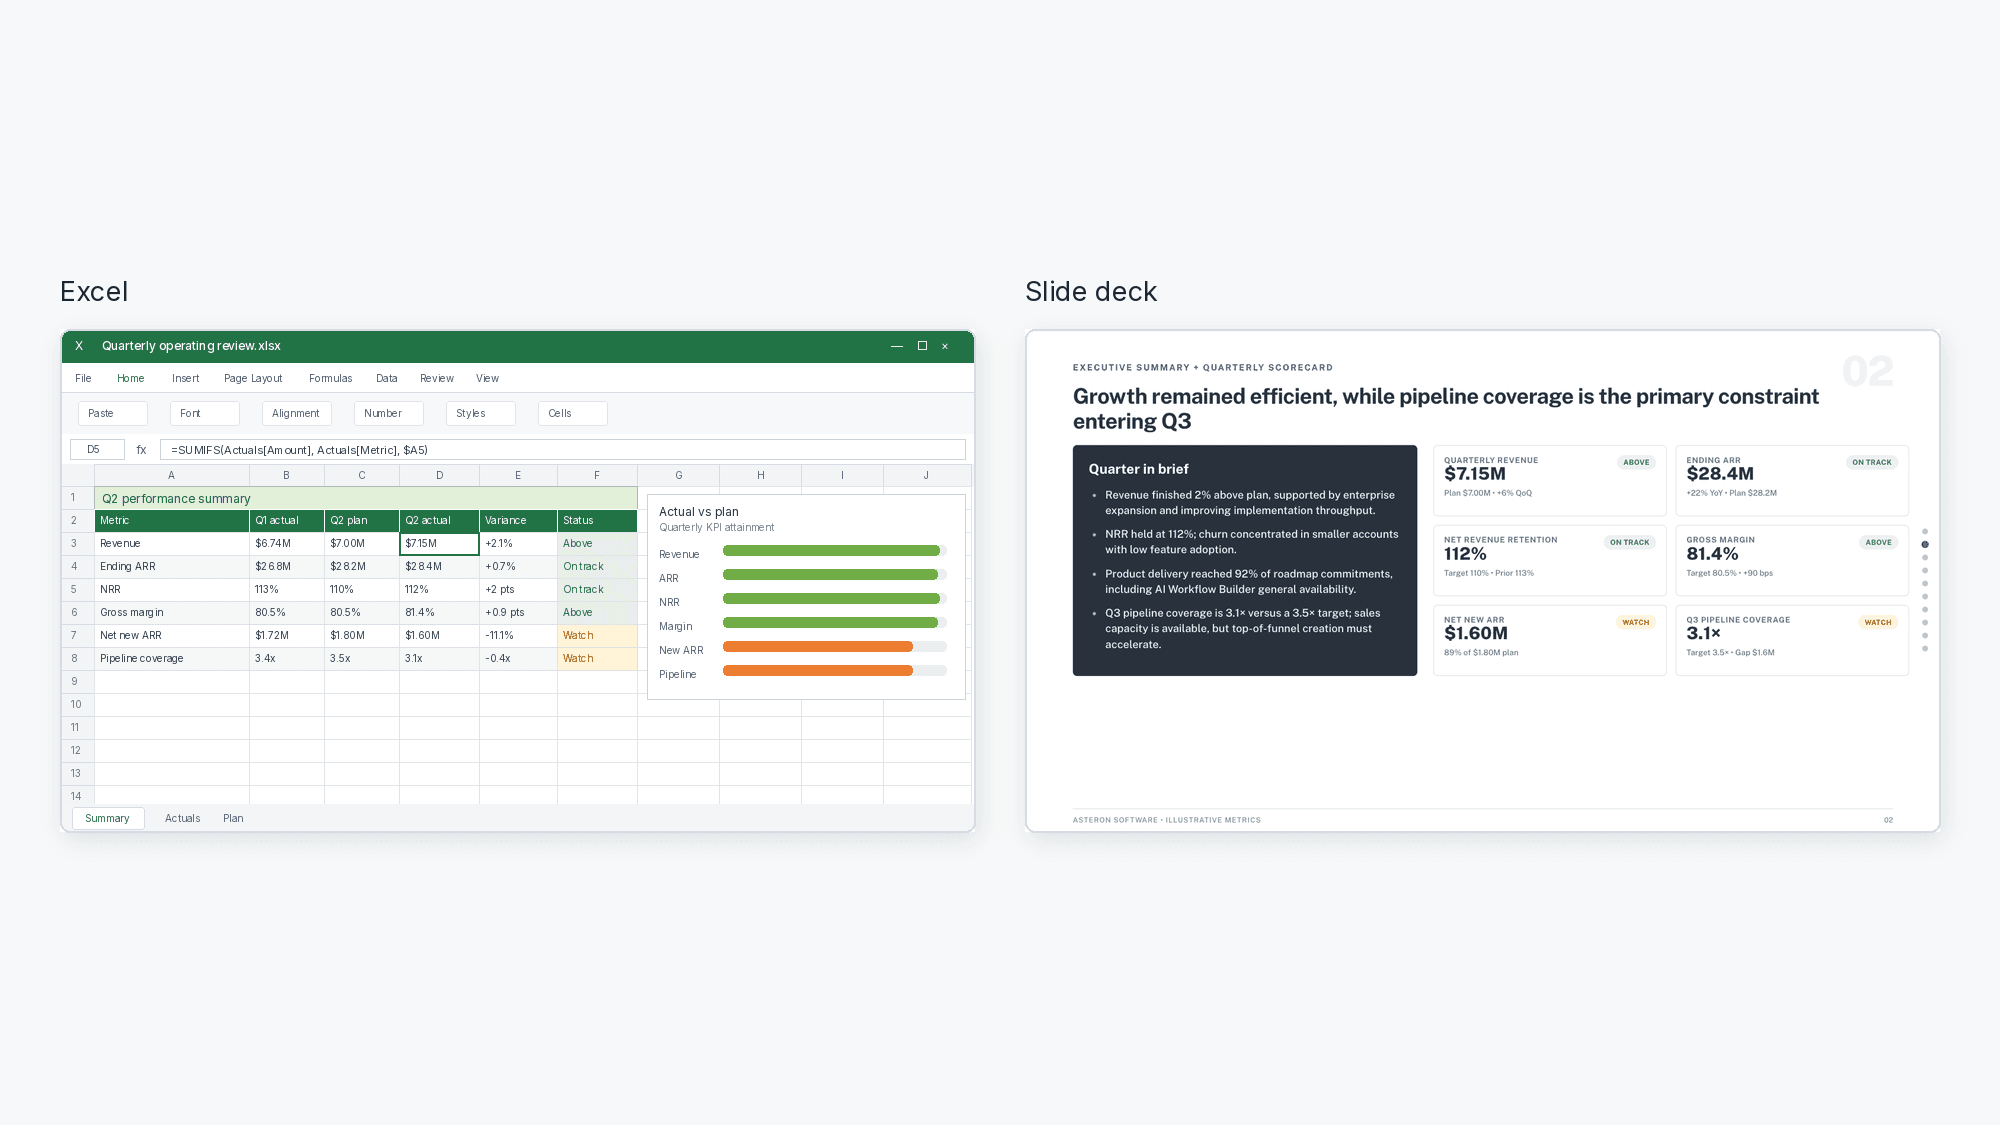
Create presentations with AI
Turn data and insights into polished slide decks.
Build data websites with AI
Turn findings into interactive websites and data stories.
Frequently asked questions
How do I upload or connect data to Julius?
Connect a data source from the Files page or directly in Chat. For step-by-step help, see the Julius Start Guide.
What do I do after linking a data source?
What data sources are supported?
Julius works with common data formats including Excel and CSV files, Google Sheets, images, PDFs, Word documents, and text files. If you have another format, upload it in Chat and Julius will let you know if it can work with it.
Can Julius analyze Excel files with multiple sheets?
Yes. Upload the spreadsheet as usual, then refer to a tab by name in your prompt. Julius can analyze one tab or work across several tabs.
Can Julius create charts and data visualizations from my data?
Yes. Upload or connect your data, then ask Julius to create a chart or graph. You can also describe the chart type, variables, labels, or styling you want.
What is Julius' data privacy policy?
Your files are protected with strict access controls, and code runs in sandboxed environments. When you delete data in Julius, it is also removed from our servers. Read more in our data privacy policy.
Is Julius free to use?
Yes. Julius users receive free daily credits. If you need more credits, you can upgrade your plan from your Account page.
Can I turn my data analysis into a presentation or website?
Yes. Once your analysis is ready, use the AI Presentation Maker to create a polished deck, or use the AI Website Builder to publish your findings as an interactive website or data story.