KPI Presentation Template for Performance Reports
Run a KPI review with 12 slides covering scorecard, revenue, margin, customer, operations, people, trends, variance, priorities, and actions.
Preview the 12-slide KPI Presentation Template
Review the complete Q3 performance story from revenue beat and margin pressure through customer, delivery, people metrics, root drivers, decisions, and scorecard.
What you're getting
A KPI deck that explains what management should do next
This 12-slide template turns a scorecard into an operating conversation. It covers enterprise summary, financial, customer, operational, and people measures, trend and variance, drivers, priorities, ownership, targets, and follow-through.
The sample quarter demonstrates how to report mixed performance without hiding unfavorable measures. Replace the data with reconciled sources, define every KPI and threshold, and avoid changing targets or denominators after results are visible.
- Included
- 12 performance slides
- Best for
- Executive and QBR reporting
- Export
- PowerPoint or Google Slides
Built for
Executives running a business review
Leaders connecting results, drivers, risk, decisions, and accountability across functions.
Operations teams managing performance
Owners explaining target variance, root causes, corrective action, forecast, and support needed.
Boards reviewing enterprise health
Decision-makers who need a stable scorecard, context, outlook, and clear management priorities.
Getting started
Define the KPI system before reporting the result
Every measure needs an owner, formula, source, cadence, target, threshold, and management response.
- 1
Lock definitions and period
Confirm KPI formulas, populations, units, source systems, cutoffs, targets, and prior-period comparability.
- 2
Lead with the scorecard
Show current, target, trend, status, and owner for the small set of measures that govern performance.
- 3
Explain material variance
Connect outcomes to controllable drivers, external factors, timing, quality, and one-time events.
- 4
Turn gaps into actions
Assign interventions, owners, due dates, expected effects, dependencies, and leading indicators.
- 5
Maintain the feedback loop
Record decisions, refresh forecasts, revisit thresholds, and track whether actions change the KPI.
Explore more
Related templates worth comparing
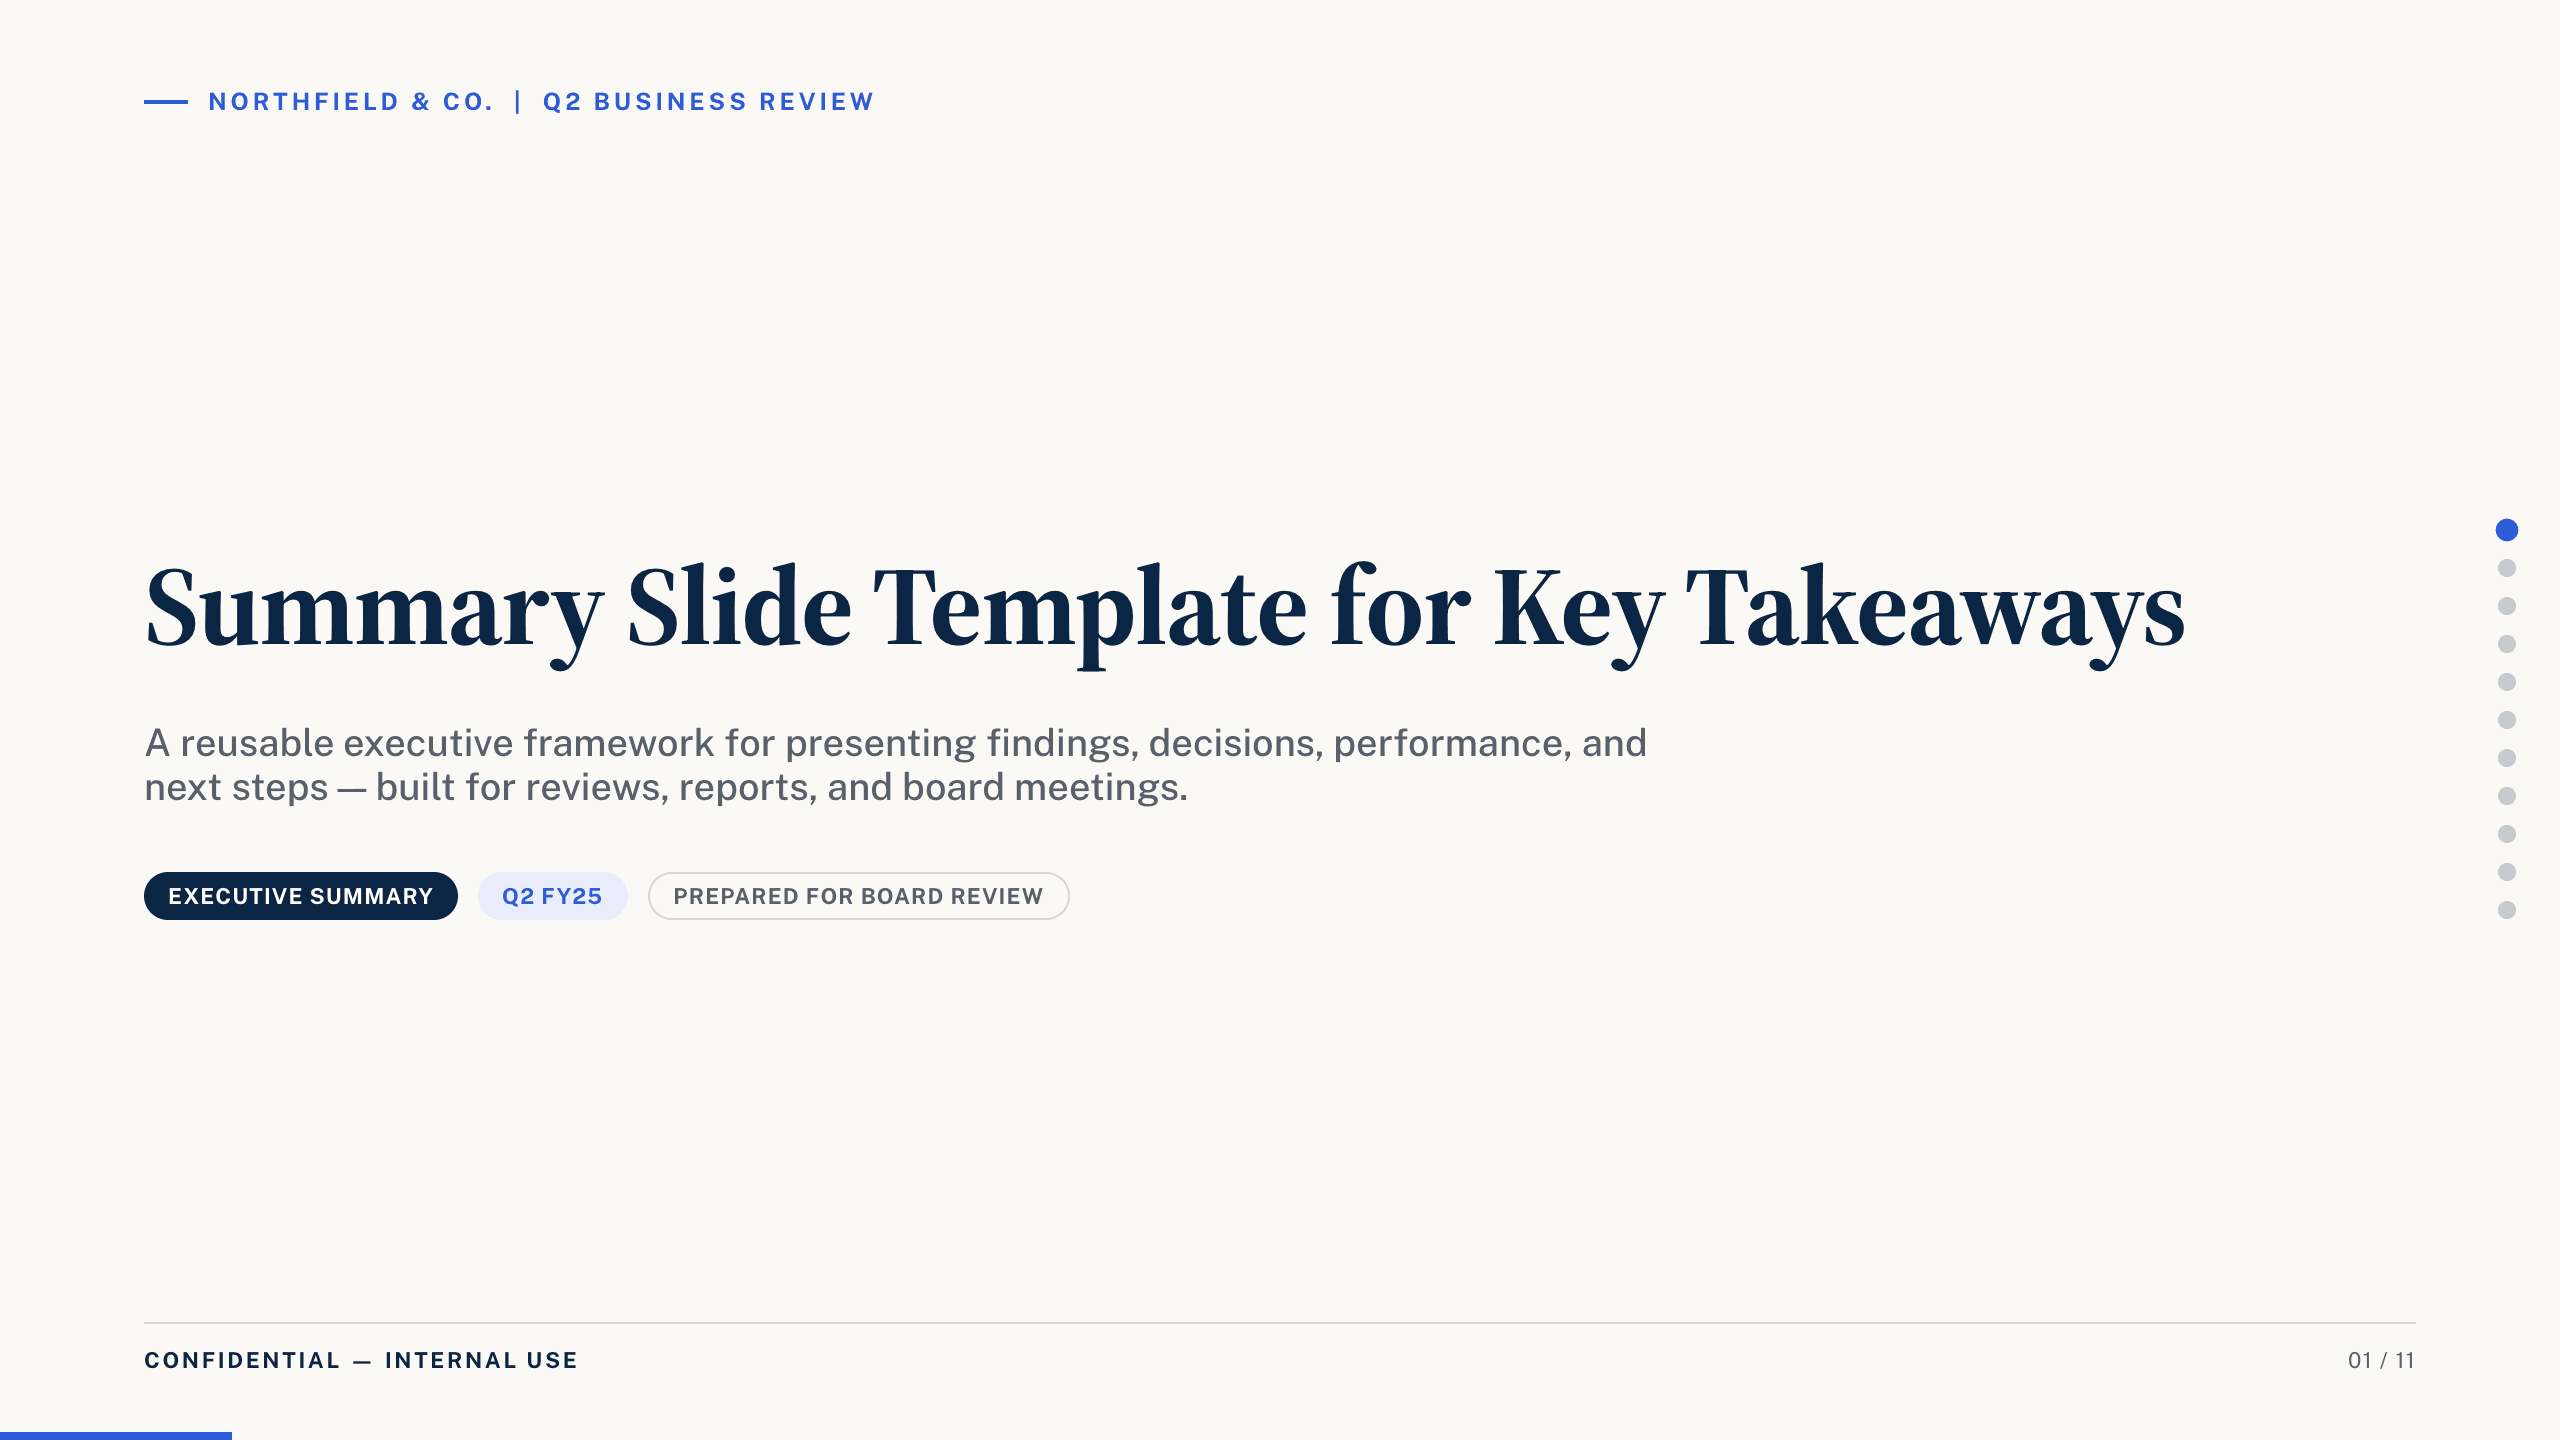
Summary Slide Template
Use nine summary-slide layouts to present key findings, performance, decisions, risks, priorities, actions, owners, and executive takeaways.
View template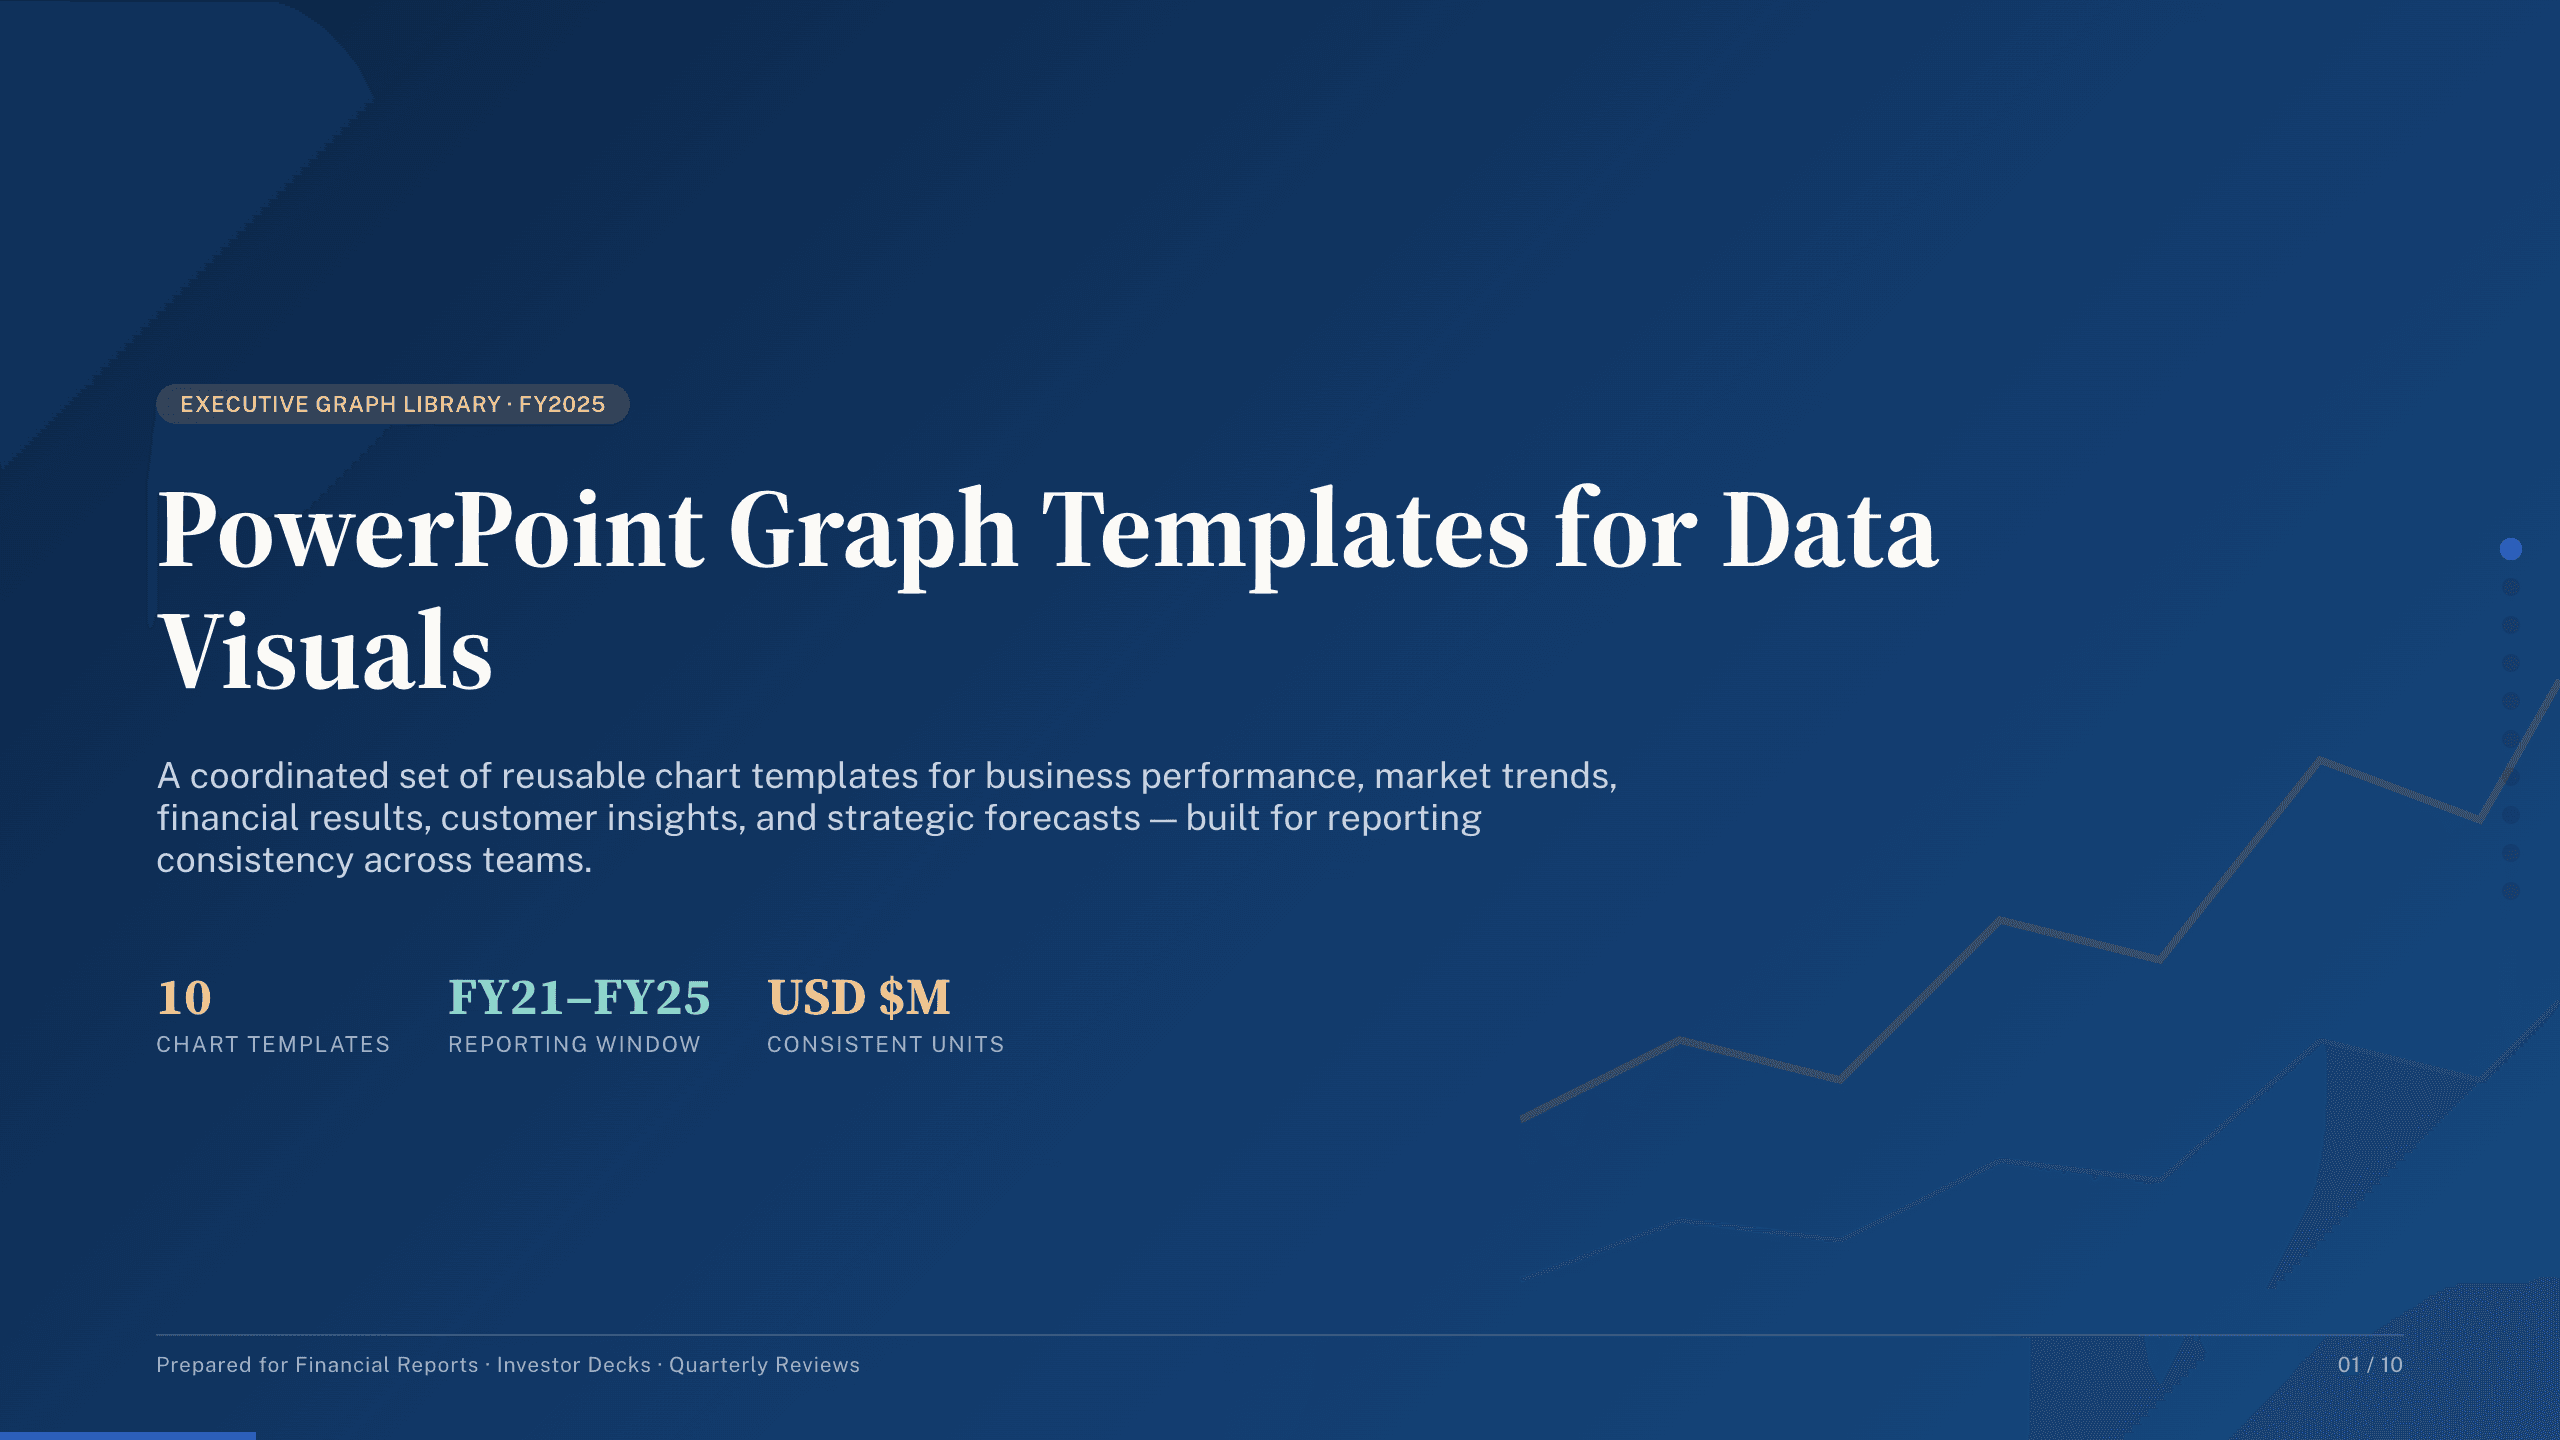
PowerPoint Graph Templates
Inspect a 10-slide featured example and find a starting point for data visuals.
Browse collection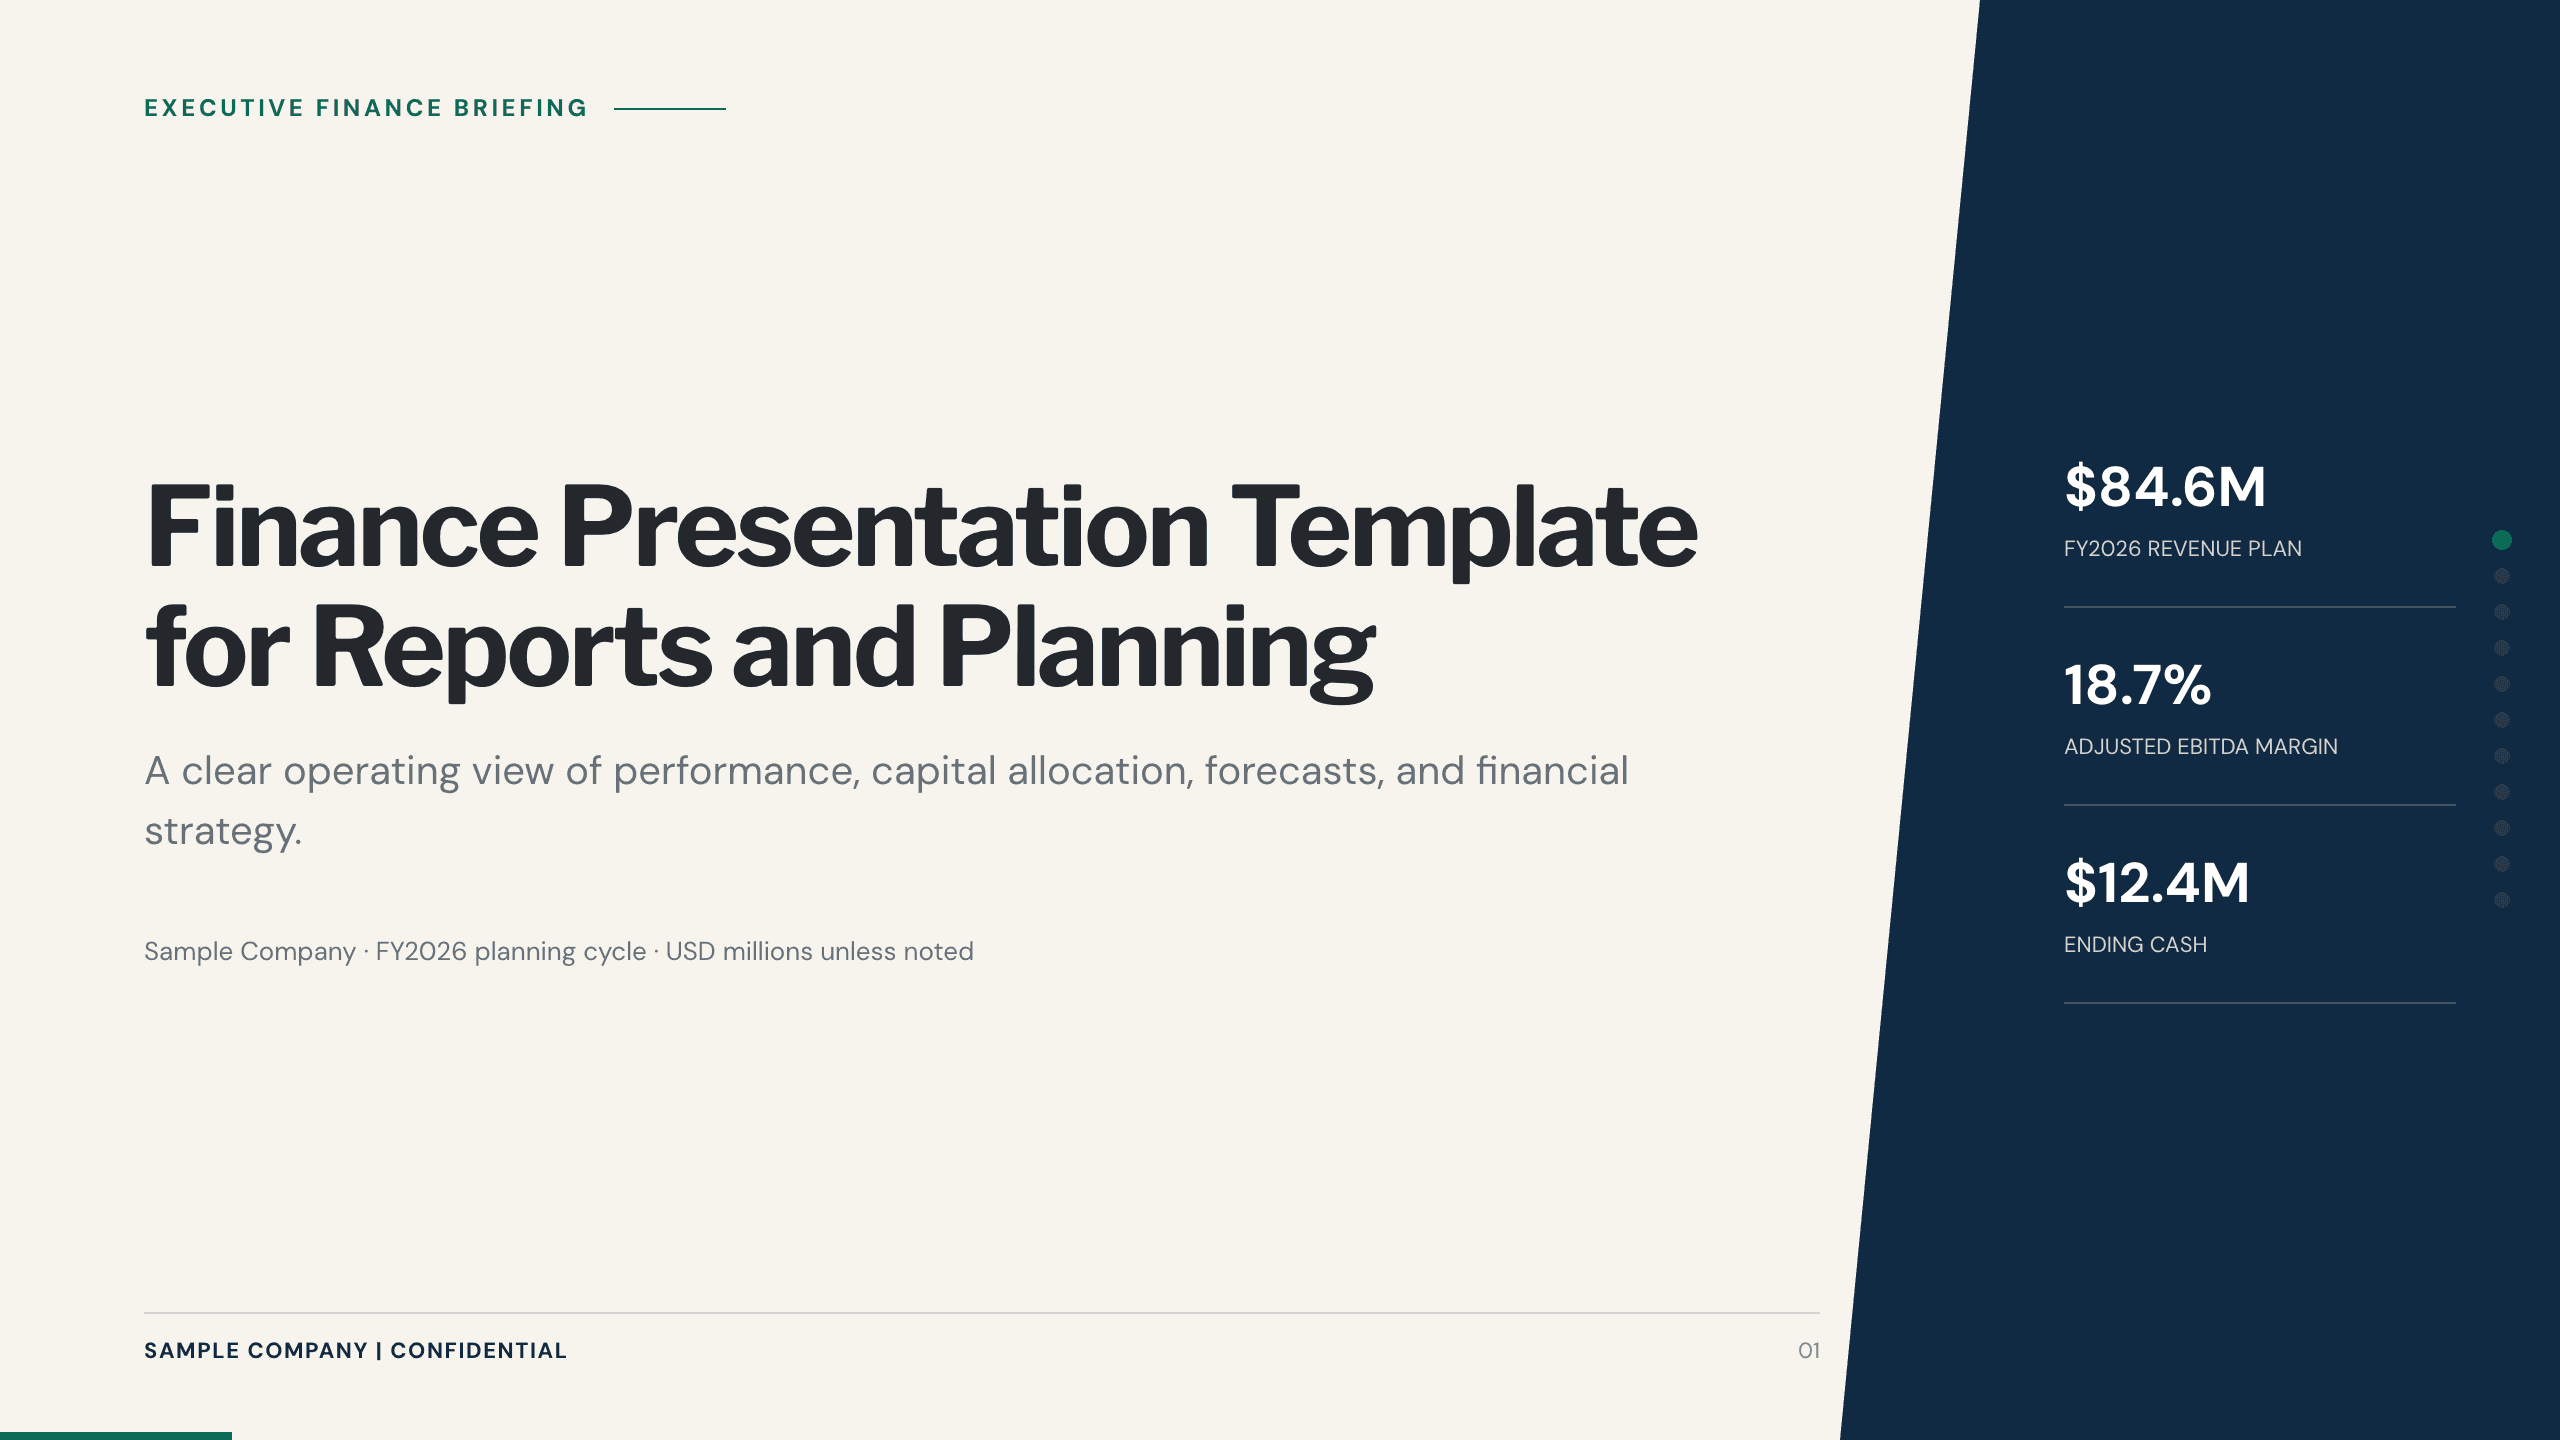
Finance Presentation Template
Present financial performance with 11 slides for results, drivers, margin, cash, capital allocation, forecast, risks, priorities, and decisions.
View template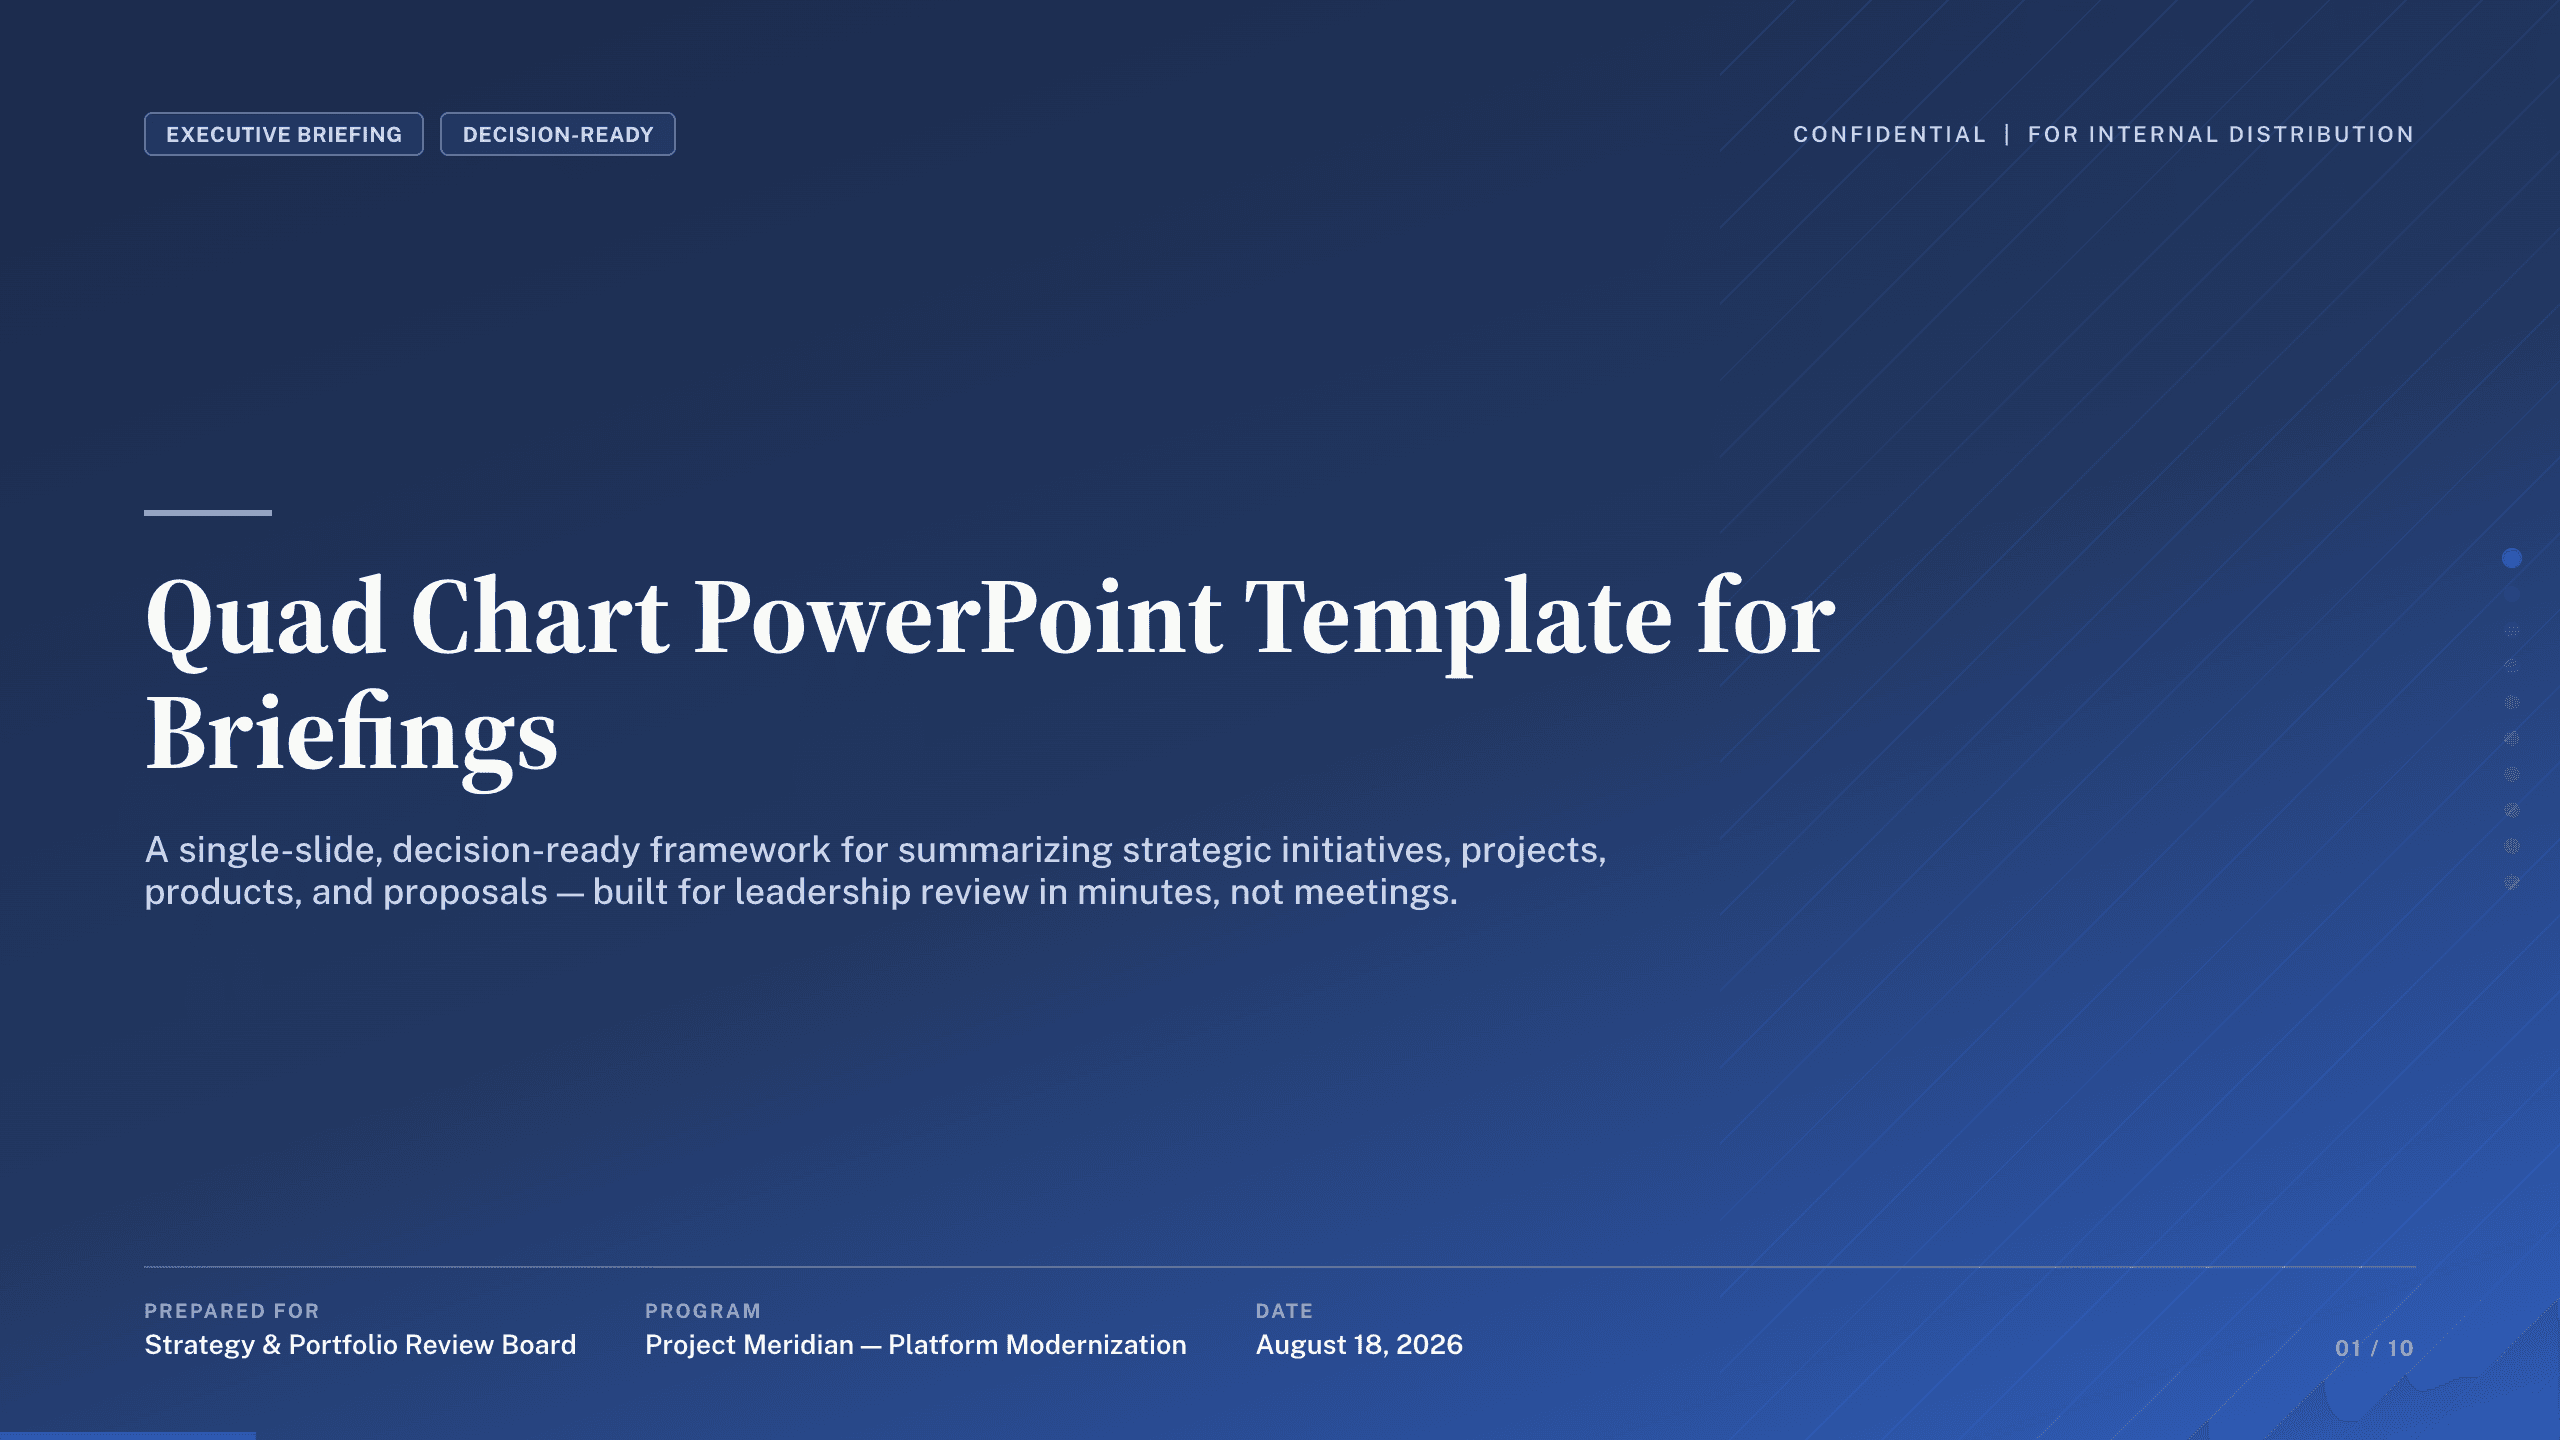
Quad Chart PowerPoint Template
Summarize an initiative in 10 PowerPoint quad charts covering objective, status, approach, milestones, budget, risks, recommendation, and decisions.
View template
Photo Slideshow Template
Turn photographs into a coherent 10-slide story with layouts for places, people, details, milestones, reflection, and a memorable closing image.
View template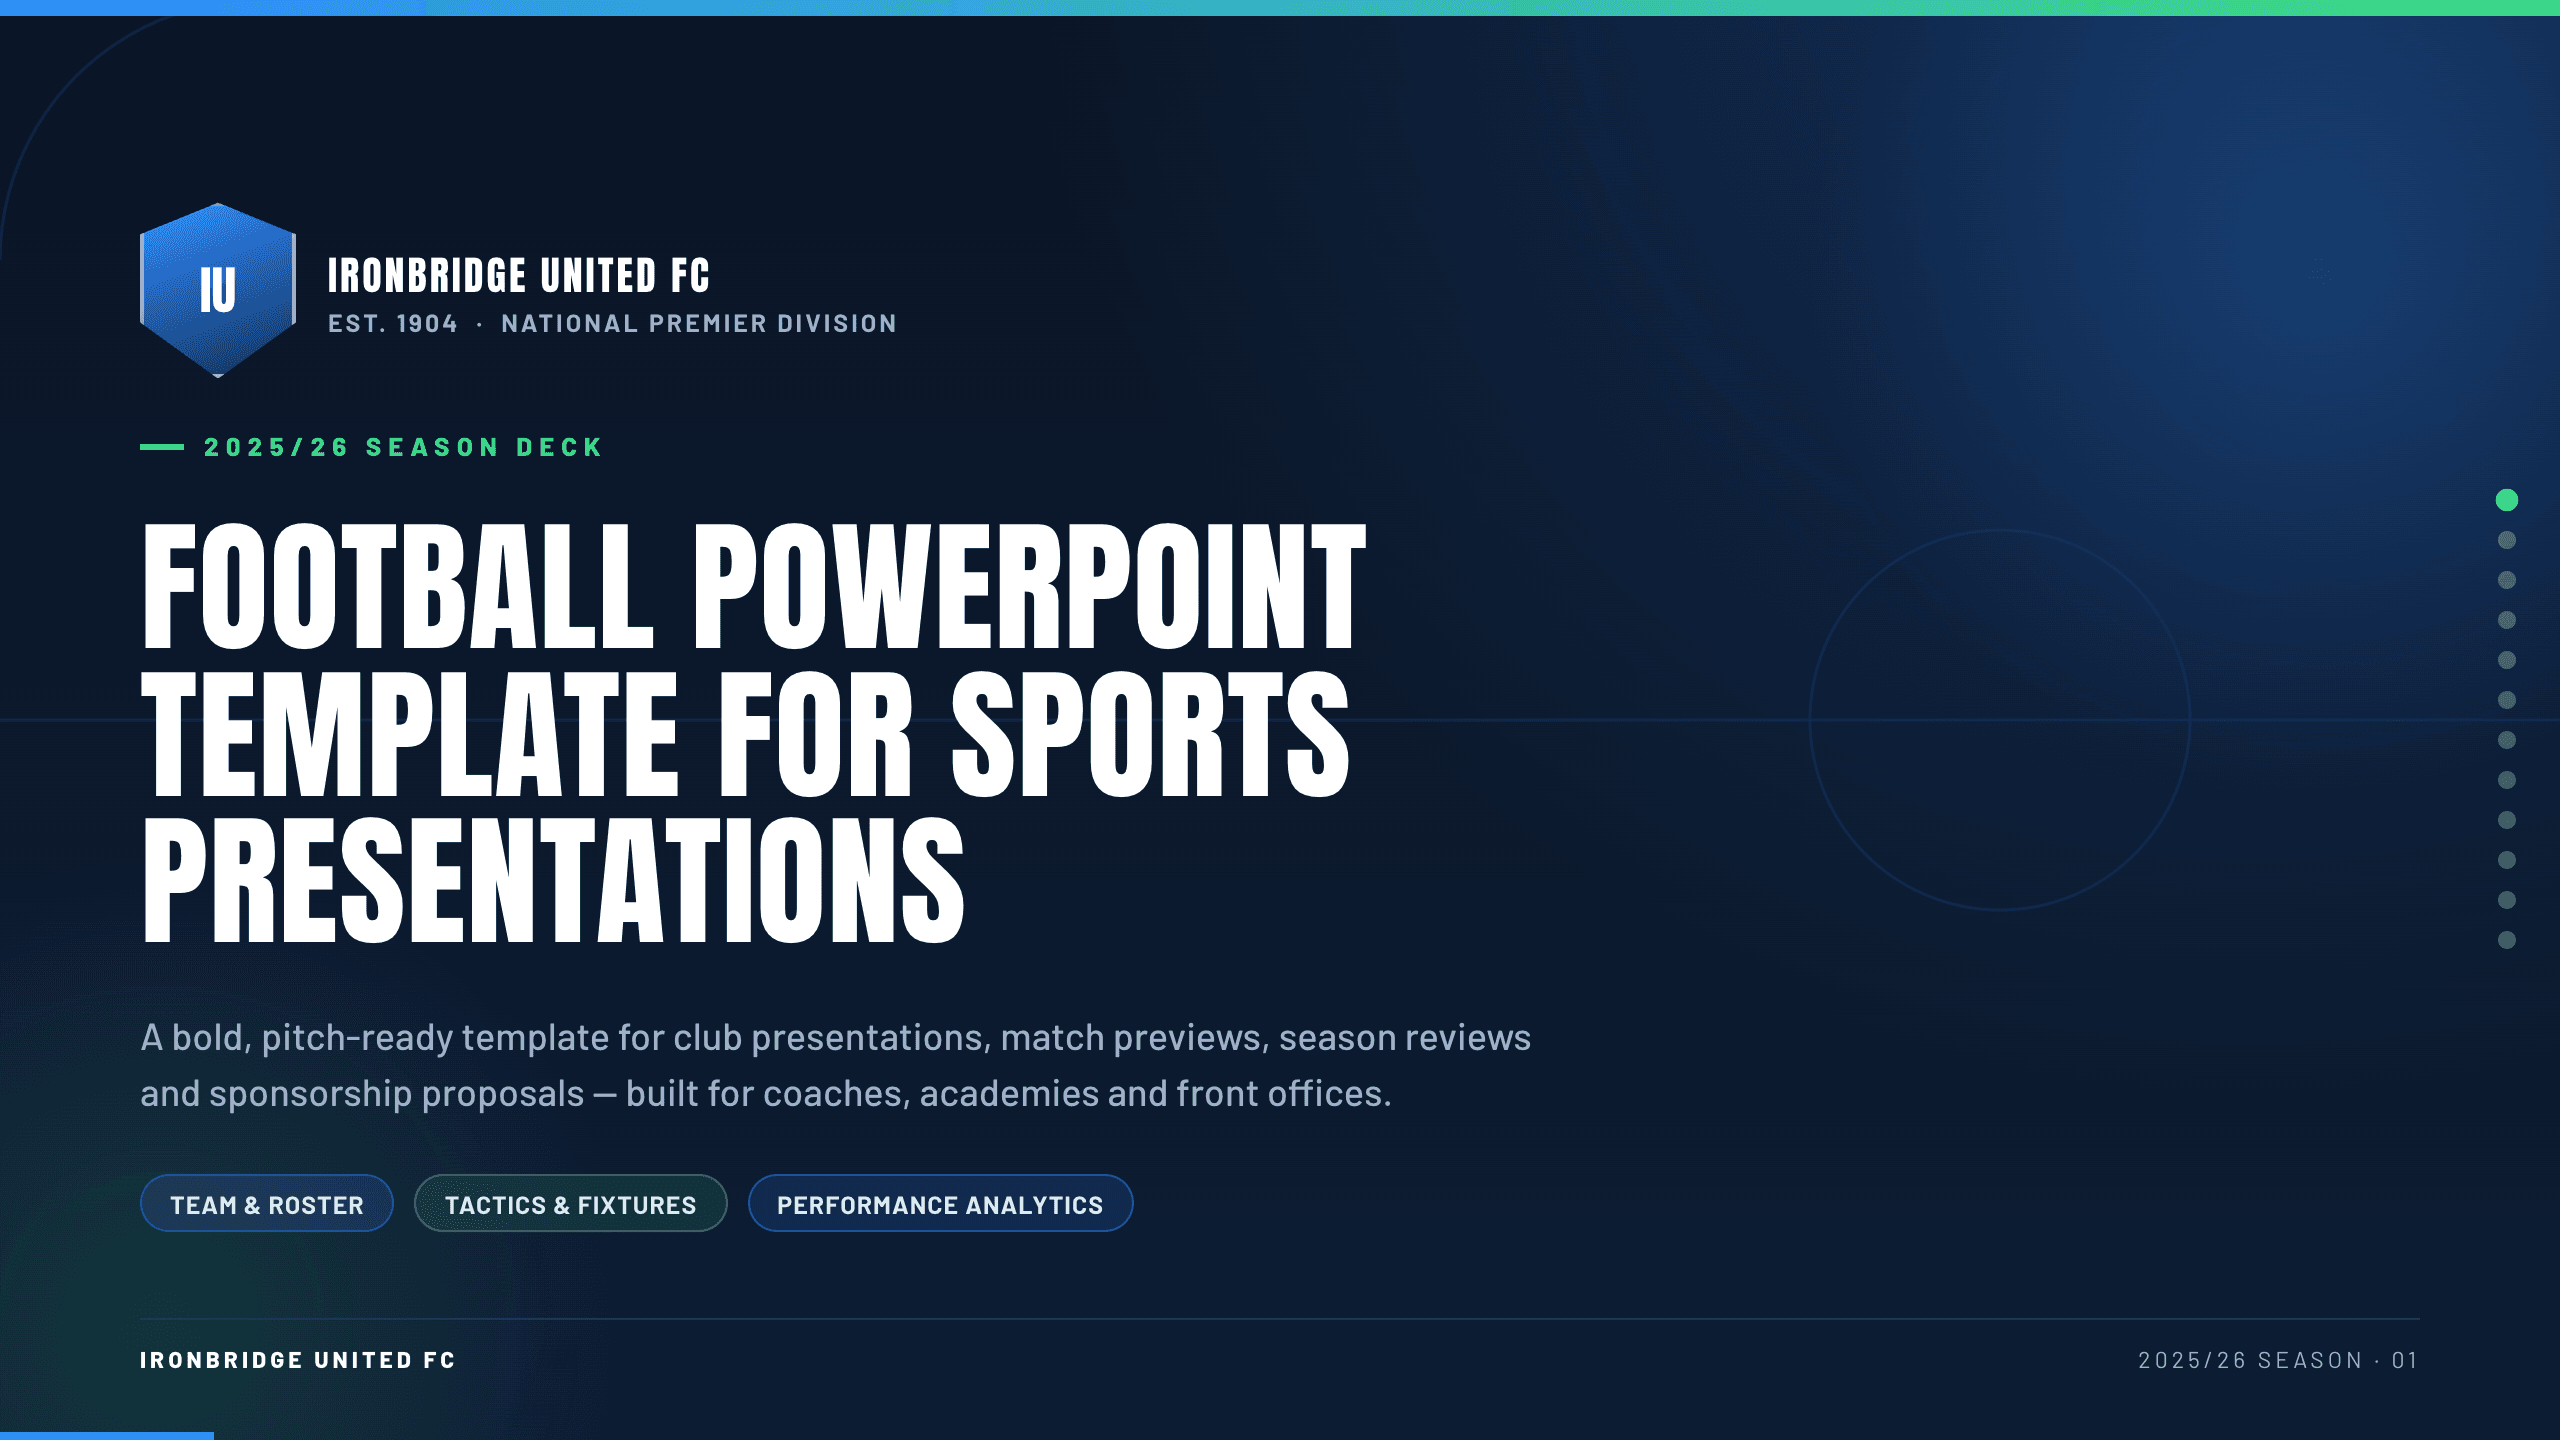
Football PowerPoint Template
Prepare a 12-slide football club deck covering identity, objectives, squad, tactics, training, performance, fixtures, partners, and match priorities.
View templateExplore other template hubs
Customize the KPI Presentation Template with Julius AI
1
Preview the complete example
Inspect all 12 slides to understand the narrative, layouts, and level of detail before replacing the example content.
2
Add your content and direction
Give Julius AI your source material, evidence, audience, constraints, and desired outcome.
3
Review and export
Check the narrative, facts, and design, then export an editable version to PowerPoint or Google Slides for final delivery.