Google Slides Org Chart Template for Team Structures
Clarify reporting lines and ownership with 11 org-chart slides covering leadership, functions, customer teams, interfaces, and operating-model changes.
Preview the 11-slide Google Slides Org Chart Template
Explore the complete company example, including executive, functional, product, commercial, customer, and cross-functional team views.
What you're getting
An org chart that explains how work gets done
This 11-slide Google Slides template goes beyond a single reporting tree. It provides company-wide, leadership, functional, product, commercial, customer-coverage, and cross-functional views so people can understand both authority and collaboration.
The worked company structure is a starting point for discussion, not a universal model. Replace names and roles, clarify dotted-line relationships, and pair every chart with the decisions or responsibilities it is meant to explain.
- Included
- 11 structure slides
- Best for
- Organizations and teams
- Export
- Editable Google Slides
Built for
People teams documenting an organization
HR and operations partners maintaining accurate roles, reporting relationships, spans, and vacancies.
Leaders planning a restructure
Executives comparing a future operating model with current ownership and coordination gaps.
Managers onboarding new teammates
Teams helping new hires understand who owns decisions and where cross-functional work happens.
Getting started
Make reporting and decision ownership easy to follow
Choose the few views your audience needs rather than forcing the entire organization onto one unreadable slide.
- 1
Define the chart boundary
Set the company, business unit, geography, date, and level of role detail included.
- 2
Verify the source of truth
Confirm names, titles, managers, open roles, and effective dates with the people or HR system owner.
- 3
Choose the right views
Use separate functional, product, regional, or customer charts when one hierarchy cannot explain the work.
- 4
Label cross-functional ownership
Show dotted lines, forums, shared goals, or decision rights without implying a reporting relationship.
- 5
Publish with a review date
Name the maintainer and refresh cadence so the chart does not become trusted but outdated documentation.
Explore more
Related templates worth comparing

Engineering Presentation Template
Present an engineering project with 12 slides connecting requirements, design rationale, simulation, risk, verification, economics, and implementation.
View template
Project Kickoff Presentation Template
Align a project team with 12 kickoff slides covering purpose, outcomes, scope, roles, workstreams, timeline, governance, risks, and next steps.
View template
PowerPoint Project Charter Template
Authorize a project with 11 charter slides covering need, objectives, scope, stakeholders, governance, milestones, budget, risks, and approval.
View template
Process PowerPoint Template
Map and improve a workflow with 12 PowerPoint slides covering five-step flow, branches, handoffs, measures, bottlenecks, future state, and action.
View template
Change Management Presentation Template
Guide an organizational change with 12 slides covering the case, stakeholder impact, readiness, resistance, communication, rollout, and adoption.
View template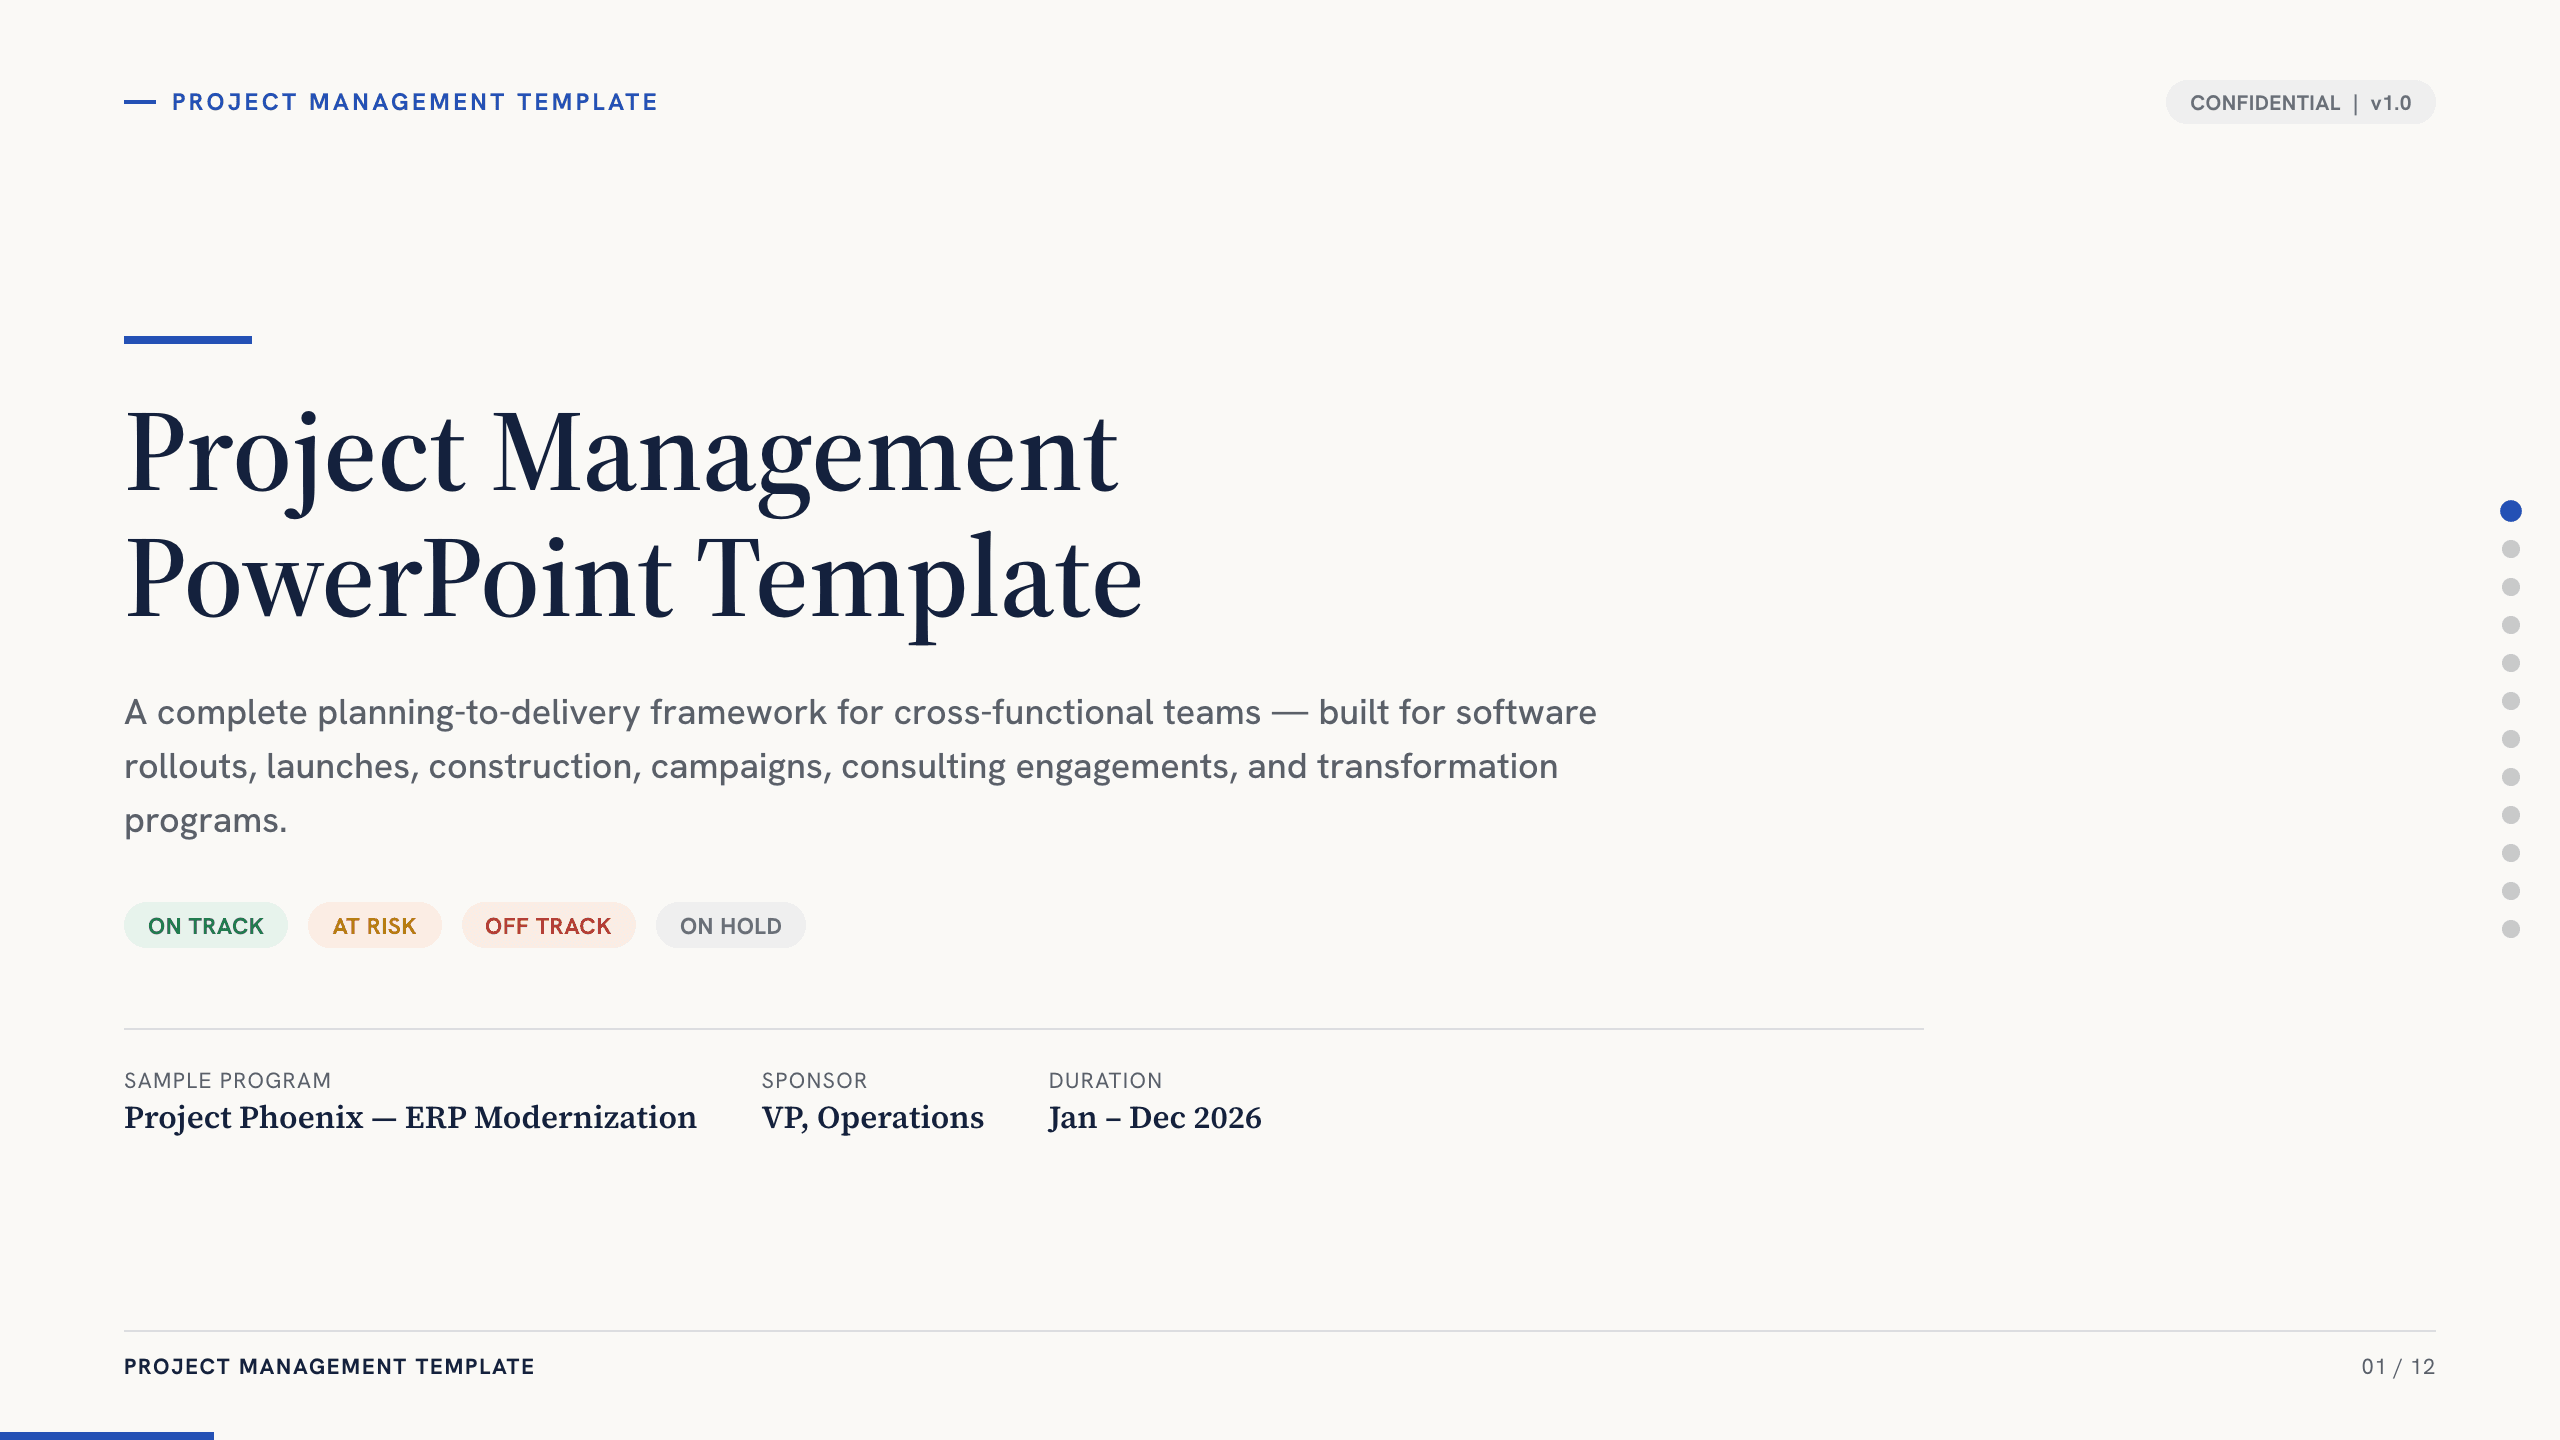
Project Management PowerPoint Template
Manage an initiative with 12 PowerPoint slides for objectives, scope, workstreams, schedule, resources, budget, risks, status, and decisions.
View templateExplore other template hubs
Customize the Google Slides Org Chart Template with Julius AI
1
Preview the complete example
Inspect all 11 slides to understand the narrative, layouts, and level of detail before replacing the example content.
2
Add your content and direction
Give Julius AI your source material, evidence, audience, constraints, and desired outcome.
3
Review and export
Check the narrative, facts, and design, then export an editable version to Google Slides for final delivery.