Fishbone Diagram PowerPoint Template for Root Causes
Investigate defects with a 10-slide fishbone deck covering the problem, 6M cause categories, evidence, validation, countermeasures, and control.
Preview the 10-slide Fishbone Diagram PowerPoint Template
Inspect the worked product-quality investigation, including the 6M diagram, cause deep dives, validation table, corrective actions, and sustainment plan.
What you're getting
A fishbone analysis that separates causes from guesses
This 10-slide template uses the Ishikawa 6M structure to investigate a recurring quality defect across people, methods, machines, materials, measurement, and environment. It then forces suspected causes through evidence and validation before recommending action.
The manufacturing example is intentionally worked through to early results and control. Replace it with your incident data, but keep the discipline of distinguishing symptoms, hypotheses, confirmed causes, and countermeasures.
- Included
- 10 investigation slides
- Best for
- Cause-and-effect analysis
- Export
- Editable PowerPoint
Built for
Quality teams investigating repeat defects
Practitioners who need a shared evidence trail from problem statement through corrective action.
Operations leaders reducing process failure
Managers aligning cross-functional owners around causes they can test and control.
Service and software teams adapting 6M
Teams translating the categories into people, process, technology, inputs, measurement, and environment.
Getting started
Move from the observed defect to a controlled fix
Treat the diagram as a hypothesis map. Evidence and validation determine what earns the label root cause.
- 1
Write a measurable problem statement
Specify the defect, location, frequency, impact, baseline, and time window without embedding a presumed cause.
- 2
Map possible causes
Facilitate ideas across all six categories and write each cause at a level the team can investigate.
- 3
Attach evidence
Add process data, observations, samples, maintenance history, and interviews to the relevant branches.
- 4
Validate the root causes
Test whether removing or changing a suspected cause changes the outcome consistently.
- 5
Assign controls
Name corrective actions, owners, dates, verification measures, and the monitoring needed to sustain the fix.
Explore more
Related templates worth comparing
Root Cause Analysis PowerPoint Template
Run a root cause analysis with 11 slides covering the incident, timeline, symptoms, hypotheses, validation, corrective actions, owners, and controls.
View template
Competitor Analysis PowerPoint Template
Compare competitors with 12 slides covering market position, buyer needs, feature gaps, pricing, messaging, and strategic moves.
View template
PowerPoint Venn Diagram Template
Use 11 PowerPoint Venn diagram slides to compare markets, products, audiences, capabilities, responsibilities, and strategic intersections.
View template
PowerPoint Project Charter Template
Authorize a project with 11 charter slides covering need, objectives, scope, stakeholders, governance, milestones, budget, risks, and approval.
View template
Process PowerPoint Template
Map and improve a workflow with 12 PowerPoint slides covering five-step flow, branches, handoffs, measures, bottlenecks, future state, and action.
View template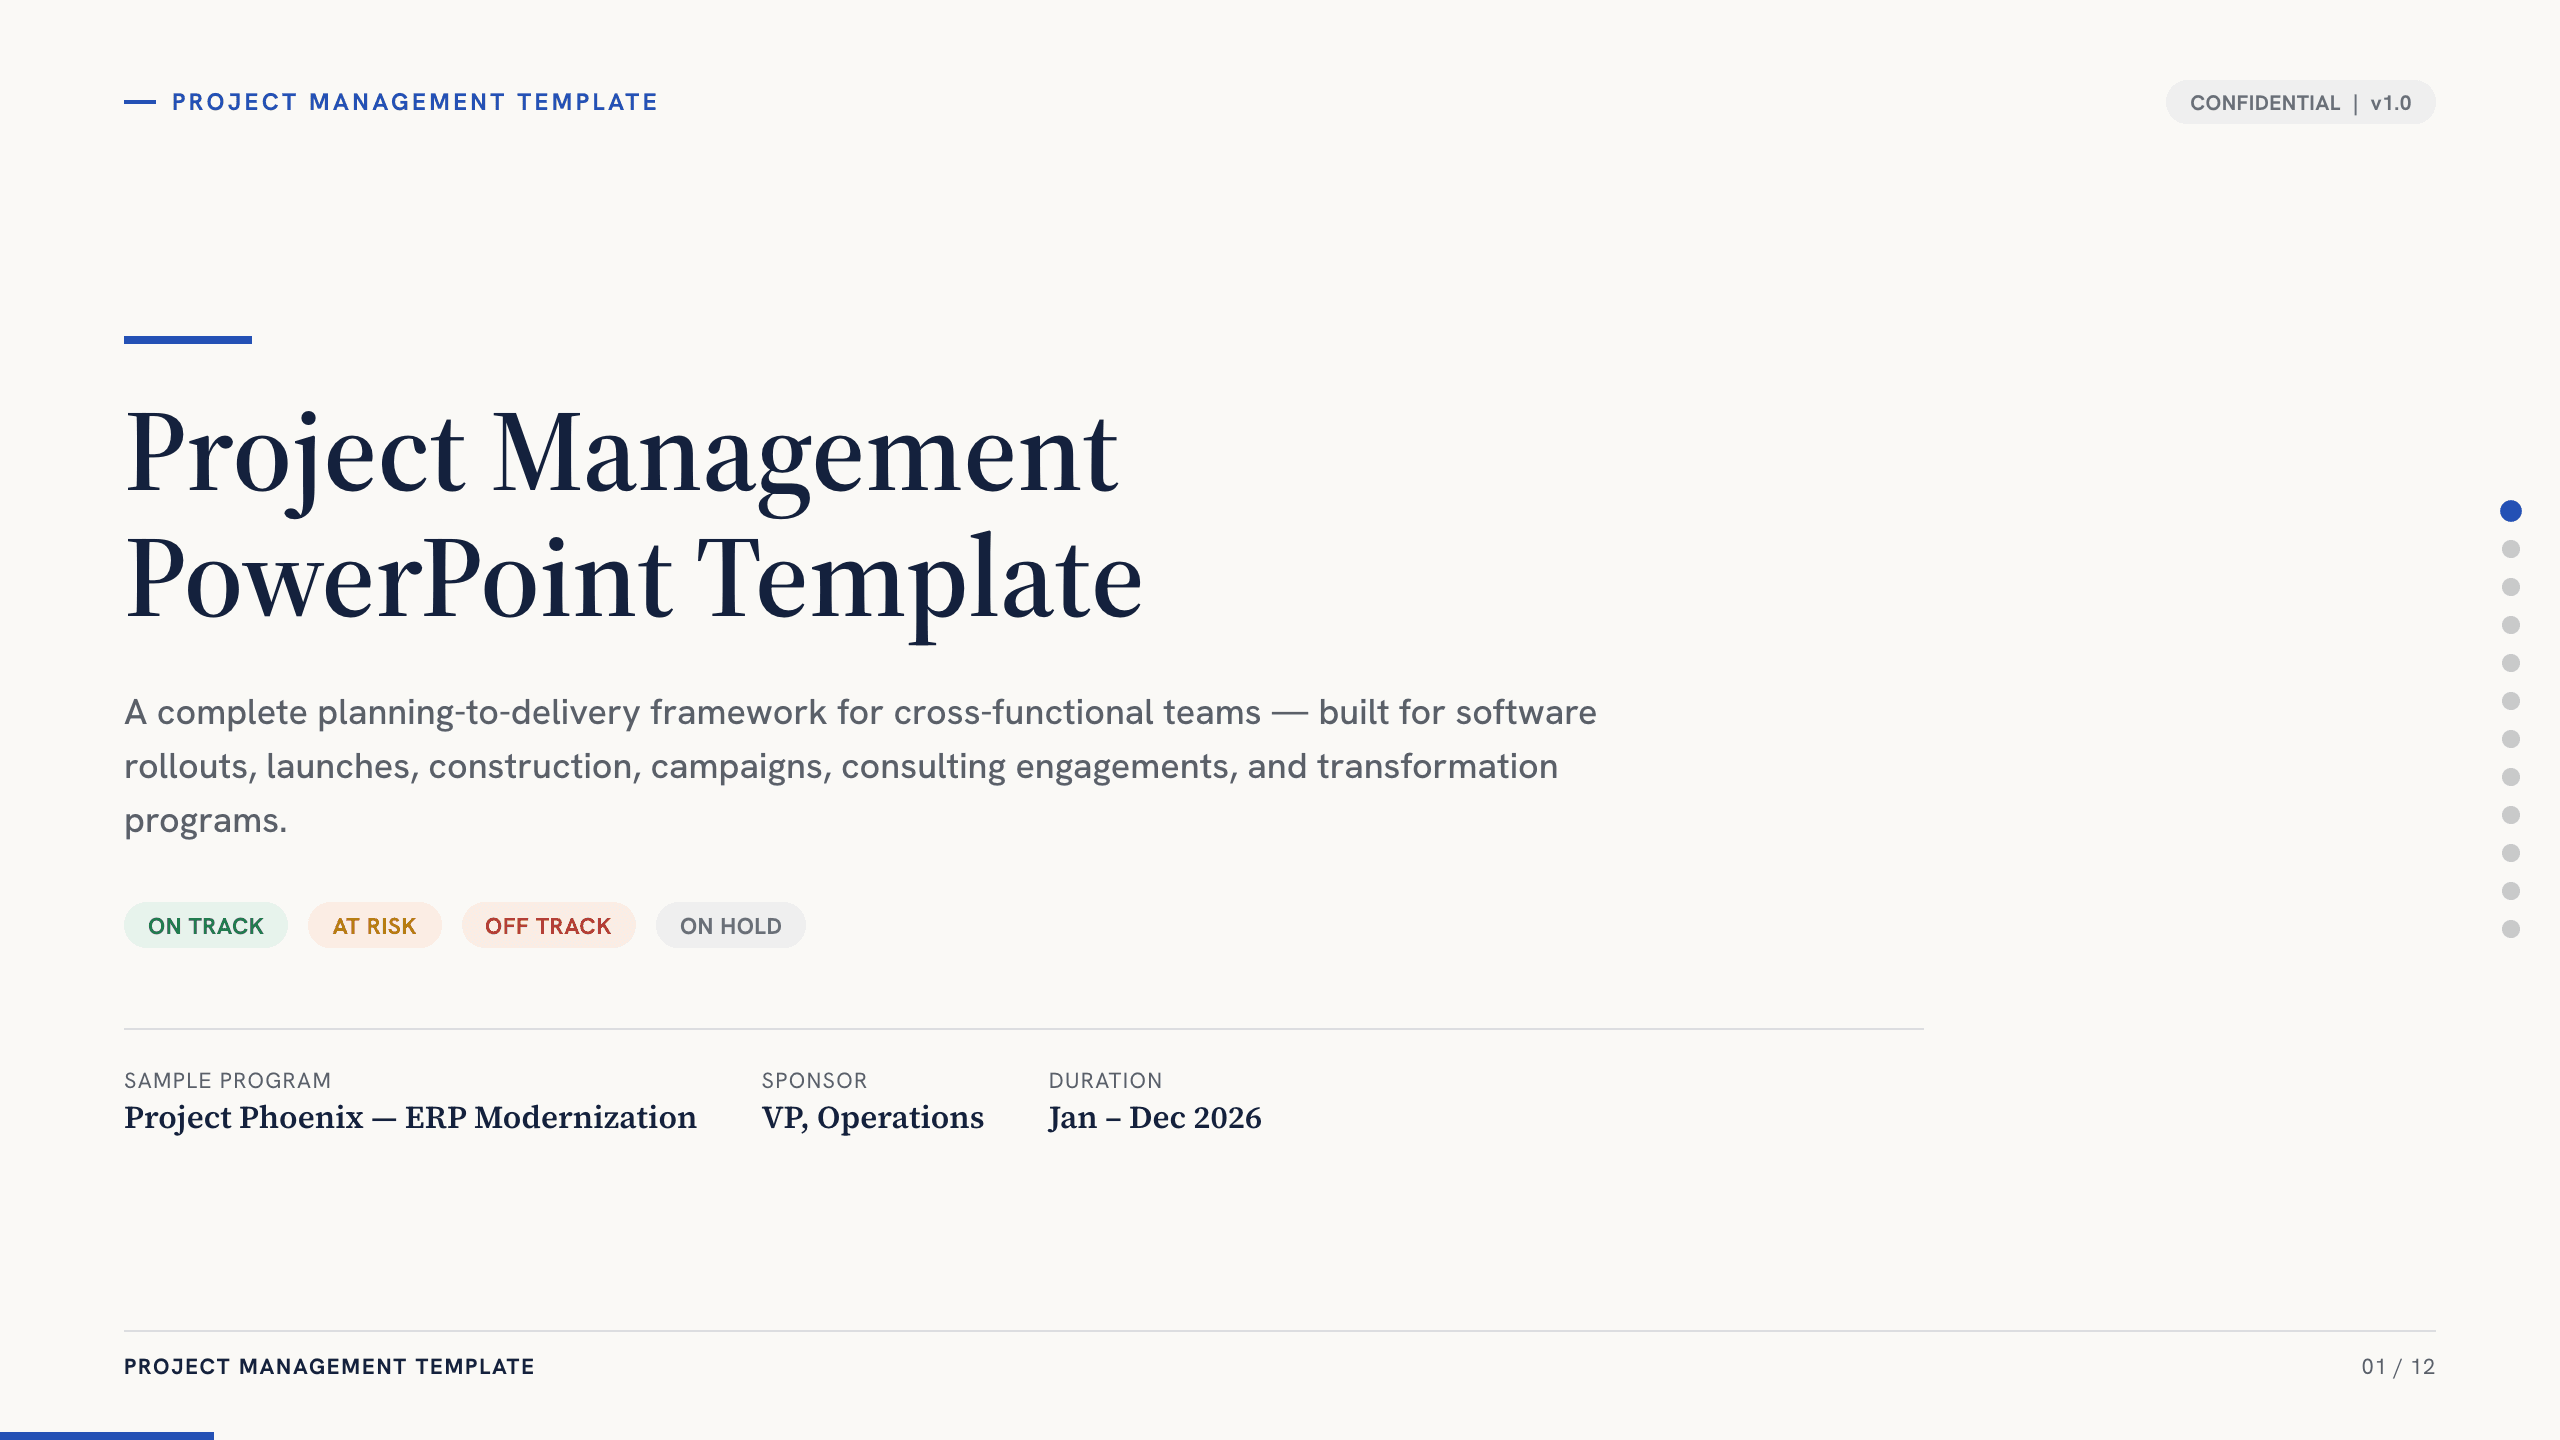
Project Management PowerPoint Template
Manage an initiative with 12 PowerPoint slides for objectives, scope, workstreams, schedule, resources, budget, risks, status, and decisions.
View templateExplore other template hubs
Customize the Fishbone Diagram PowerPoint Template with Julius AI
1
Preview the complete example
Inspect all 10 slides to understand the narrative, layouts, and level of detail before replacing the example content.
2
Add your content and direction
Give Julius AI your source material, evidence, audience, constraints, and desired outcome.
3
Review and export
Check the narrative, facts, and design, then export an editable version to PowerPoint for final delivery.