PowerPoint Venn Diagram Template for Comparisons
Use 11 PowerPoint Venn diagram slides to compare markets, products, audiences, capabilities, responsibilities, and strategic intersections.
Preview the 11-slide PowerPoint Venn Diagram Template
Inspect the full executive toolkit, including two- and three-circle comparisons, segment overlaps, capability intersections, positioning, and 90-day priorities.
What you're getting
A Venn diagram toolkit focused on meaningful overlap
This 11-slide PowerPoint template offers multiple two- and three-set layouts for comparison, segmentation, capability, positioning, and ownership questions. Supporting conclusions explain why an overlap matters instead of leaving circles to speak for themselves.
Use a Venn diagram only when membership and intersection are the real logic. Replace the sample labels with mutually understandable sets, keep the number of items low, and choose another chart when scale or sequence is more important.
- Included
- 11 diagram slides
- Best for
- Overlap and segmentation
- Export
- Editable PowerPoint
Built for
Strategy teams mapping an opportunity
Leaders identifying the intersection of customer need, capability, differentiation, and economic value.
Product teams clarifying feature overlap
Teams comparing offers, platforms, personas, or requirements without a dense matrix.
Operations leaders defining ownership
Groups showing distinct responsibilities, shared work, and the forums that govern the intersection.
Getting started
Use overlap only where membership carries meaning
Write the conclusion first; then decide whether two sets, three sets, or a different visual makes it easiest to understand.
- 1
Name the decision
State what the audience should understand or choose from the overlap.
- 2
Define the sets precisely
Use parallel labels with clear inclusion rules so an item can be placed consistently.
- 3
Limit the intersections
Keep only the most decision-relevant items and move supporting detail to notes or an appendix.
- 4
Label the implication
Explain the opportunity, conflict, shared responsibility, or positioning that the overlap creates.
- 5
Check the visual logic
Confirm items sit in the correct region and do not imply size, scale, or probability unless intended.
Explore more
Related templates worth comparing
Comparison Slide Template
Make a defensible choice with 10 comparison slides for requirements, capabilities, pricing, implementation, trade-offs, scoring, and recommendation.
View template
2 Picture Slide Template
Use nine two-picture slide layouts for clear before-and-after, option, person, place, product, portfolio, and process comparisons with minimal supporting copy.
View template
2 Key Point PowerPoint Template
Present two essential ideas with 10 PowerPoint layouts for priorities, paths, comparisons, risks, findings, scenarios, decisions, and executive recommendations.
View template
Fishbone Diagram PowerPoint Template
Investigate defects with a 10-slide fishbone deck covering the problem, 6M cause categories, evidence, validation, countermeasures, and control.
View template
SWOT PowerPoint Template
Use a complete 12-slide SWOT deck to separate internal and external factors, prioritize what matters, and turn the analysis into concrete strategic actions.
View template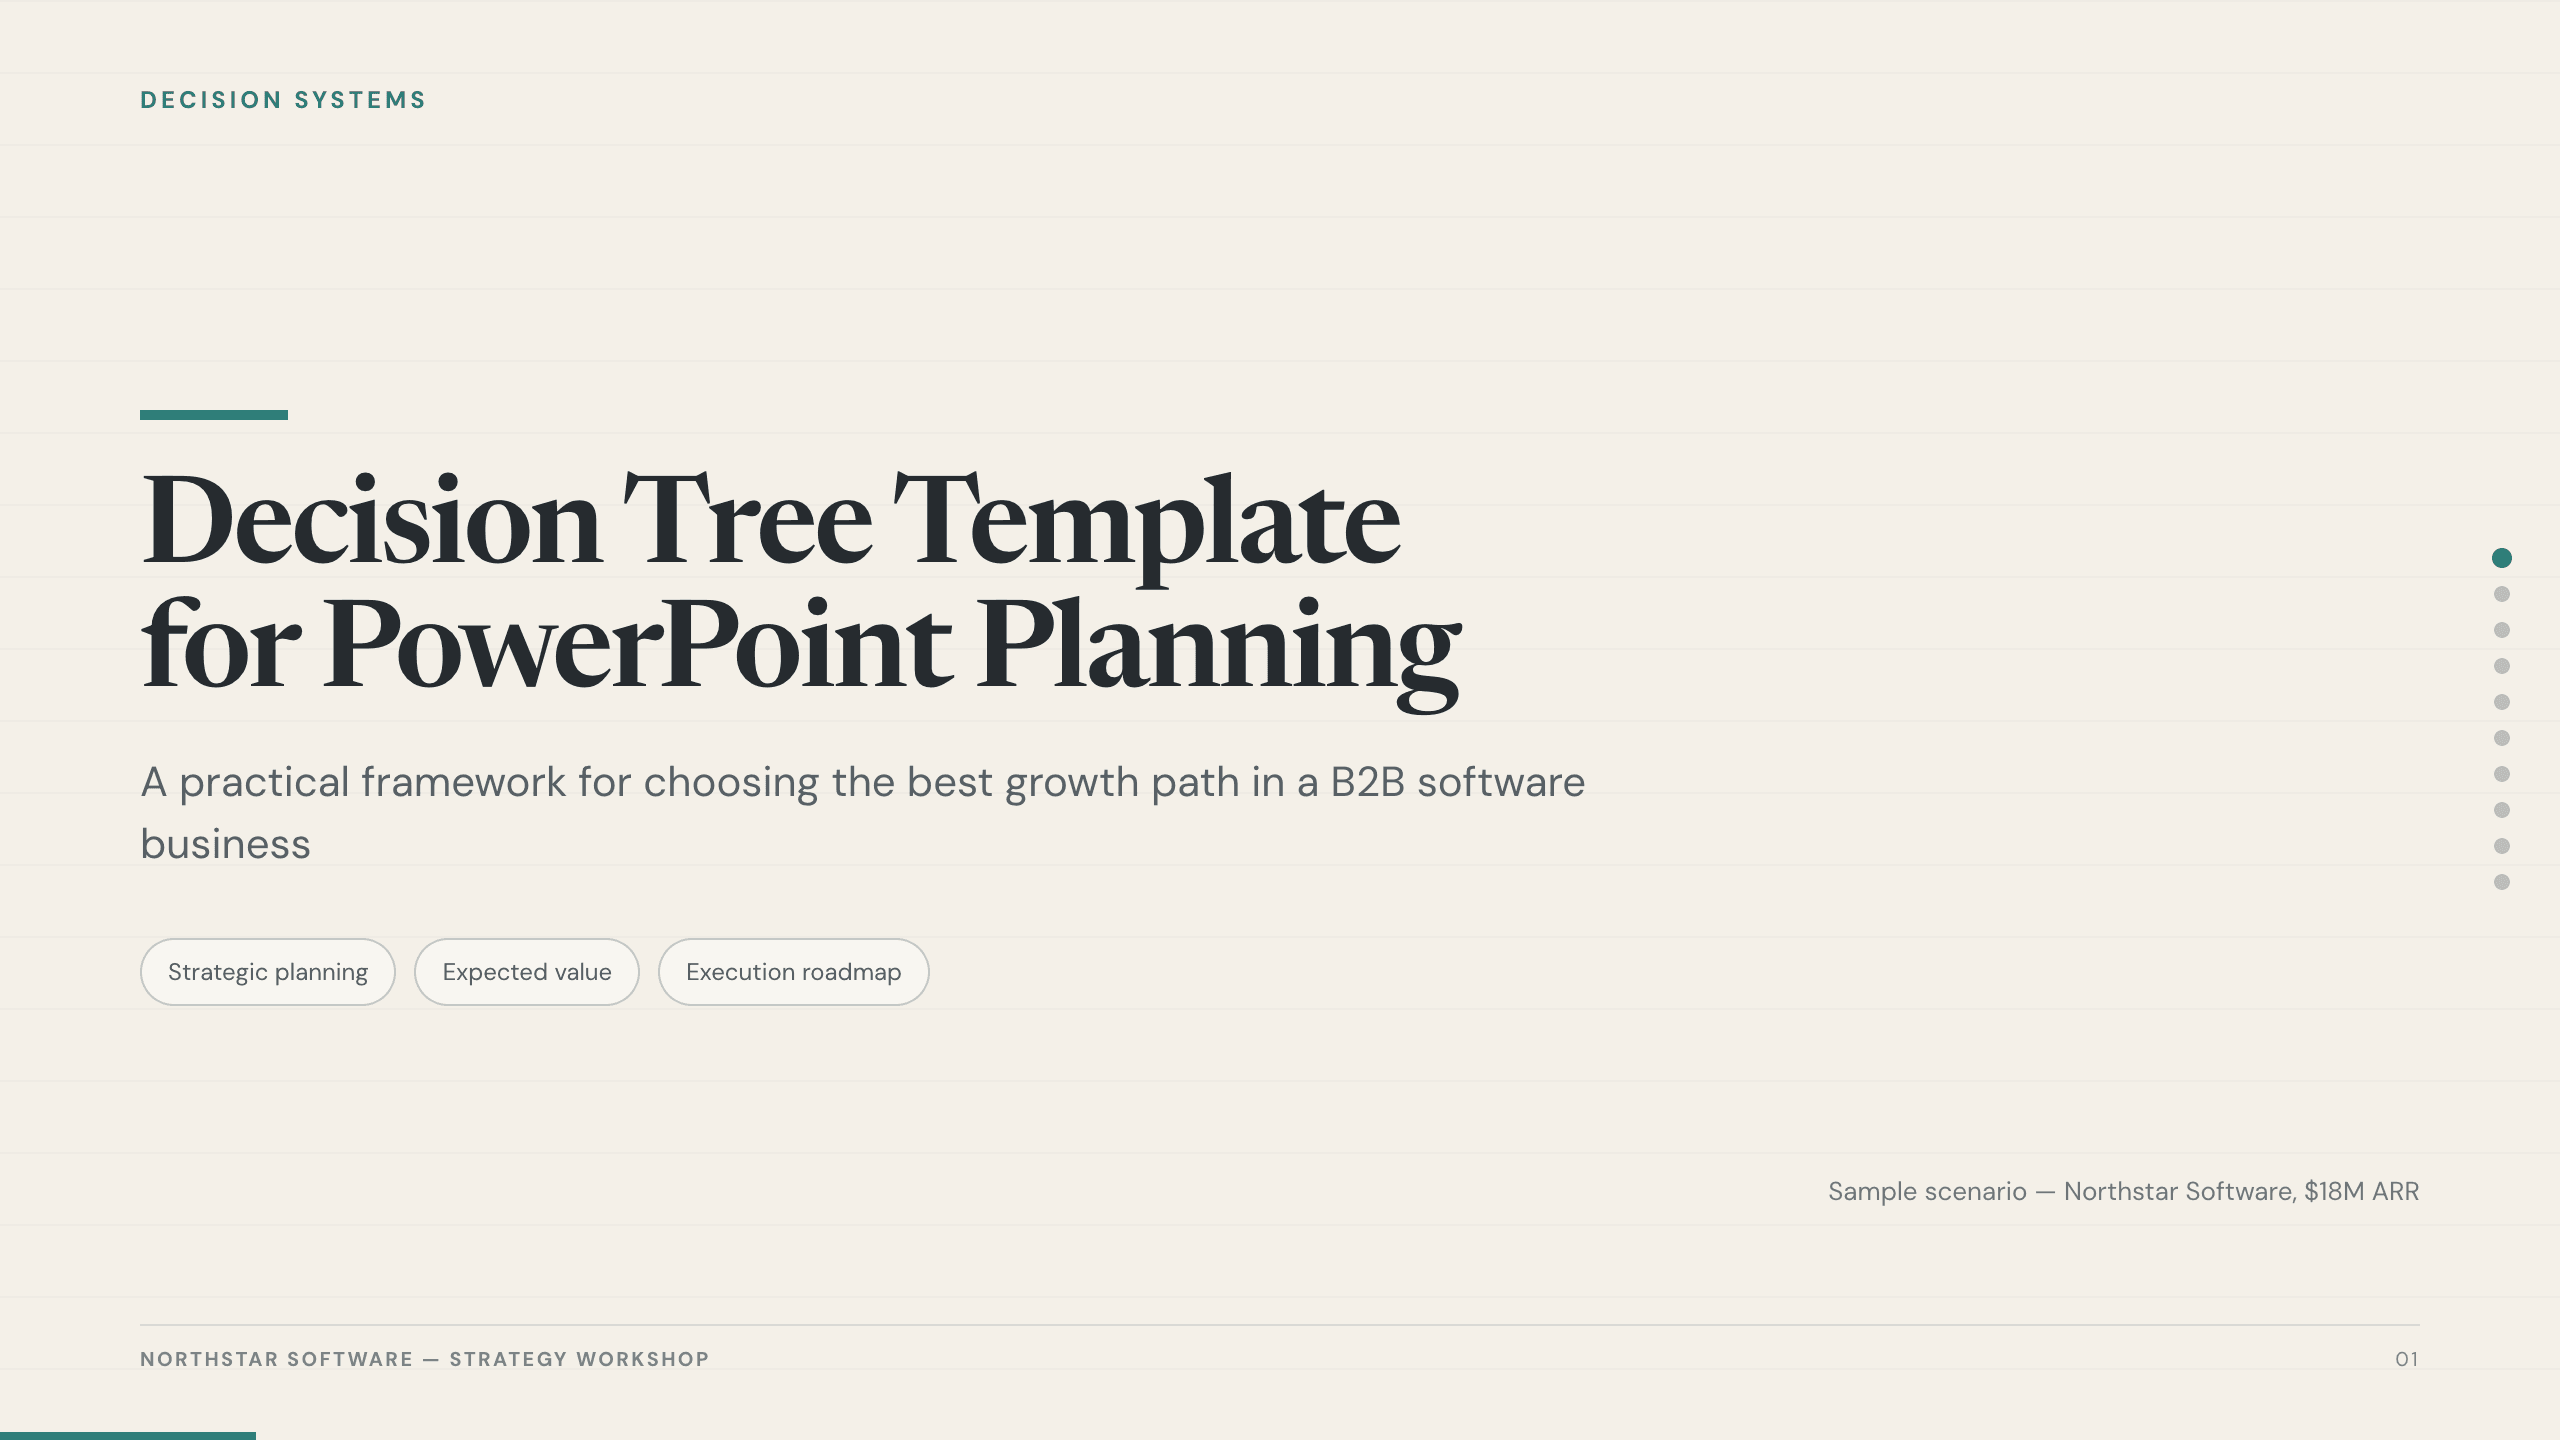
Decision Tree Template
Choose among options with 10 decision-tree slides covering the objective, criteria, branches, probabilities, economics, risks, sensitivity, and next test.
View templateExplore other template hubs
Customize the PowerPoint Venn Diagram Template with Julius AI
1
Preview the complete example
Inspect all 11 slides to understand the narrative, layouts, and level of detail before replacing the example content.
2
Add your content and direction
Give Julius AI your source material, evidence, audience, constraints, and desired outcome.
3
Review and export
Check the narrative, facts, and design, then export an editable version to PowerPoint for final delivery.